Kyle Hilliard, Mikaya Hamilton, Steven Jiang, Lauren Davis (2023). Usability Evaluation of Food Bank Data Visualizations using Eye-Tracking Technology. In: Human-Centered Design and User Experience. AHFE Open Access, vol. 114, pp. 419–429. https://doi.org/10.54941/ahfe1004260
Effective resource allocation in hunger-relief agencies relies on data-driven decision-making. In recent years, major hunger-relief organizations, such as food banks, have increasingly adopted data visualizations as a fundamental tool for presenting and comprehending analytics. As this trend has gained momentum, the need for establishing a standardized approach for food banks to presenting visualizations has become evident. These visualizations must be efficiently interpreted by users to prevent potentially dire miscommunications. A usability evaluation was conducted on selected visualizations using eye-tracking technology in this study. Usability concerns and design recommendations were identified. Findings of this study have the potential to improve food bank operations through evidence-based decision making.
Approximately 34 million Americans, including nine million children, are food insecure (Feeding America, n.d.), meaning they face hardships to obtain a reliable source of nutritious foods primarily due to a lack of resources (Coleman-Jenson et al., 2022). The landscape of food insecurity is extremely complex because factors like poverty, unemployment, and systemic inequal- ities can block access to healthy foods (Feeding America, n.d.). Fortunately, hunger relief organizations, such as food banks, play a vital role in distribut- ing food from various sources to those in need (Bazerghi et al., 2016). Food banks are often faced with intricate decision-making processes to bridge the gap between supply and demand and ensure vulnerable populations receive the right foods (Delpish, et al. 2018).
Recently, visual analytics, an approach that combines data analytics with human factors, has increased the need to provide evidence-based decision- making support to food bank operations managers. (Desai, et al., 2017; Parks, et al., 2021; Hamilton, et al., 2023a; Hamilton, et al., 2023b; Washing- ton et al., 2023a; Washington et al., 2023b). While data visualizations provide a graphical way to present data in a manner that allows users to identify and analyze relationships, patterns, and trends amongst a data set (Sadiku et al.,
2016), improperly designed visualizations may make the interpretation even harder. The usability of the visualizations utilized by food banks in recent years has not yet been assessed systematically; therefore, there remains a likelihood that those visualizations aren’t effectively assisting food banks. Usability evaluation of the visualizations is necessary to determine the effi- cacy of the visualizations currently in use, as well as to produce a set of standards that food banks can use for future data visualizations to attempt to eliminate the production of misleading visualizations.
In the context of food bank data visualizations, the most relevant usabil- ity metrics are those that measure the degree to which a visualization is informative (i.e., producing understanding) and/or emotive (i.e., produc- ing a useful emotional response through aesthetics and engagement) (Few, 2017). As such, conventional methods of gathering performance data and using participant surveys alone will likely be insufficient in assessing usability issues; given that people aren’t entirely conscious of their cognitive pro- cesses, self-reported data is rarely satisfactory in gathering accurate data on anything more than surface-level engagement, and performance measures (time on task, error rate) are satisfactory in diagnosing informative prob- lems, but fail to provide any emotive context (Bojko, 2005). Eye-tracking technology, which offers insight into unconscious processes in the form of gaze data, could be used in the usability evaluation. Eye tracking is a tech- nique that measures an individual’s eye movements and the sequence in which an individual’s eyes shift from one location to another in order to determine where the individual’s attention is being directed (Poole & Ball, 2006). Modern eye-tracking technologies can also be used to determine the intensity of a user’s engagement with different elements of a virtual screen, giving insights as to if a user is naturally biased toward the order in which they view certain elements and which elements they gave most attention to. Thus, the most effective way to gather the usability metrics mentioned earlier will be to combine eye-tracking technologies, which add necessary context to performance and self-reported data, with conventional testing methods.
In this preliminary study, a usability evaluation was conducted on four selected visualizations of food bank data using eye-tracking.
METHODS
Participants Five participants (4 male, 1 female) aged 22–55 years old (mean = 39, stan- dard deviation = 12.2311) were recruited for this study. In a preliminary survey, participants were asked to report their level of familiarity of com- puters (on a scale of 1-5, with 1 being novice), their vision status, and if they had any outstanding eye health concerns/visual impairments that would affect their ability to interact with visualizations. All participants reported an acceptable level of familiarity with computers, a vision sta- tus at near-normal (20/30 to 20/60) or normal (20/20), and no eye health concerns.
Usability Evaluation of Food Bank Data Visualizations 421
Stimuli Four selected visualizations developed for the food bank were chosen in the study. Each represents a typical food bank operation. An R shiny application was developed to present these visualizations.
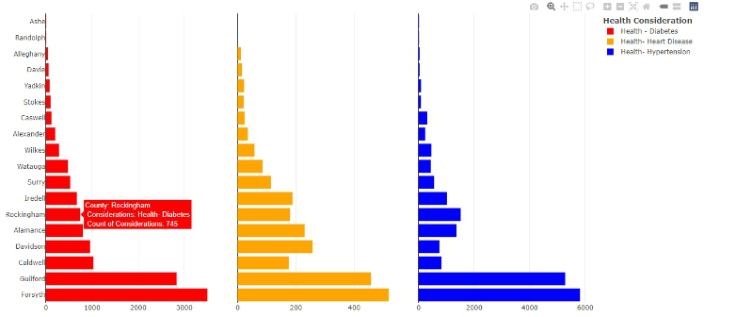
Figure 1 shows the first visualization used in the study, a table of three hor- izontal bar charts presenting the number of individuals with a given health consideration residing in several counties in North Carolina. The data is sepa- rated by color: the red chart presents the number of individuals with diabetes, the yellow chart presents the number of individuals with heart disease, and the blue chart presents the number of individuals with hypertension. The y- axis lists the counties, sorted in ascending order based on the values of the bars in the leftmost chart, and each bar chart has an individual x-axis, scaling in a manner relative to the values the chart is presenting. Interactivity features are available for this visualization.
Figure 1: Visualization 1.
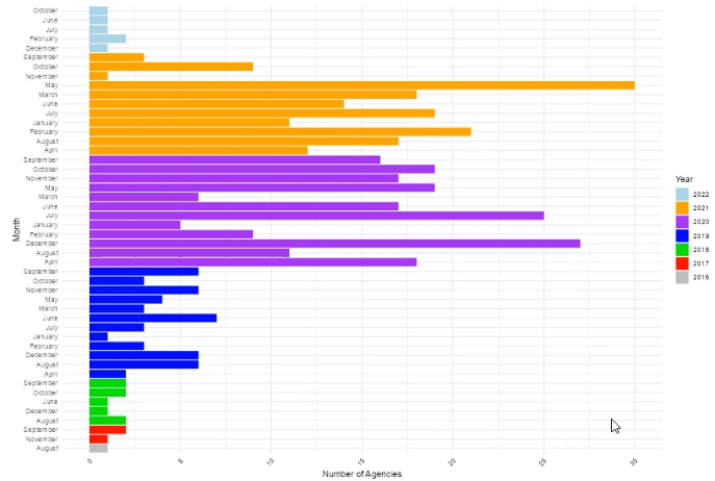
Figure 2 displays visualization 2, a grouped horizontal bar chart present- ing the number of hunger-relief agencies an organization visited each month over a 7-year timespan (2016 – 2022). For months in which no hunger-relief agencies were visited, the data was omitted for the sake of simplicity. The graphic utilizes color-blocking techniques to present data pertaining to dif- ferent years: data entries representing agency visits in 2016 are grey, agency visits in 2017 are red, agency visits in 2018 are green, etc. The y-axis lists the months of the year, sorted in ascending alphabetical order, and the x-axis scales by intervals of 5.
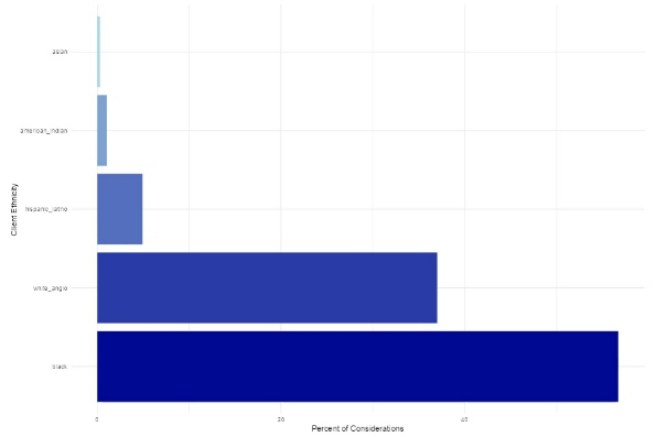
Figure 3 displays visualization 3, a simplistic horizontal bar chart present- ing the demographic composition within a group of individuals who have a given set of health considerations. The y-axis lists the five racial/ethnic groups related to this dataset, those being Asian, American Indian or Alaskan Native, Hispanic or Latino, White, and Black, and the x-axis scales by intervals of 20.
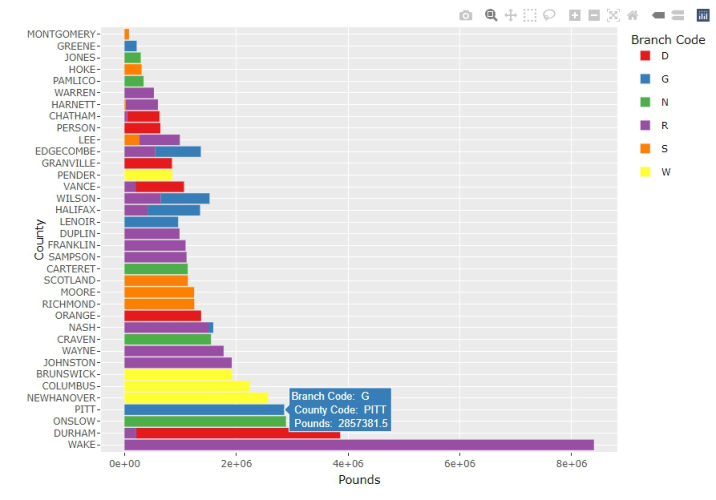
Figure 4 displays visualization 4, a horizontal bar chart presenting the pounds of food a large hunger-relief agency distributed to different branches
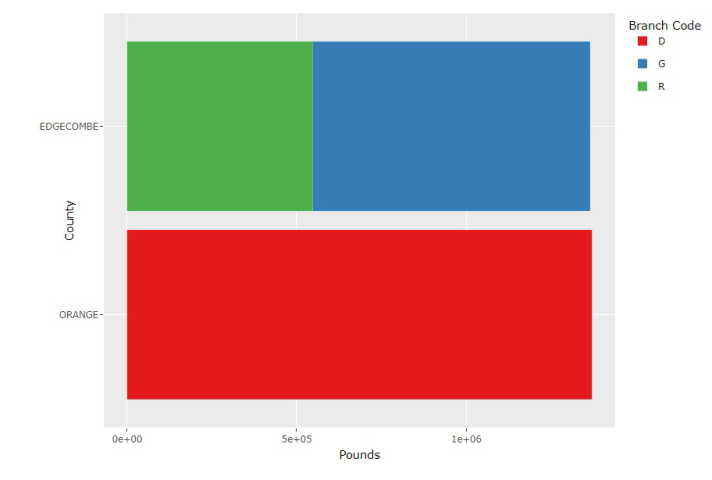
in each county in a given region over some period of time. Branches were separated by code, and the graphic utilizes color-blocking techniques to dif- ferentiate between branches of each code (branch code D – red, G – blue, N – green, etc.) The y-axis lists the counties, and the x-axis is written using scientific notation to account for the extreme range and variation of the data. Interactivity features are available for this visualization.
Usability Evaluation of Food Bank Data Visualizations 423
Figure 4: Visualization 4.
Equipment Stimuli were presented in a Dell Computer. The Tobii Pro Spectrum was used to collect eye-tracking data, and the HyperX QuadCast was used to record participant audio for later analysis.
Experimental Design A within subject design was used in this study. Each participant went through all four visualizations.
Tasks and Procedure Upon arrival, participants were briefed with the purpose of the study, and offered opportunities to answer their questions. After signing an informed consent, they completed a pre-test questionnaire where their demographic information was collected. Participants were given time to familiarize them- selves with the computer and the Tobii Spectrum eye-tracking device. Partic- ipants were instructed to relax when using the eye-tracker, the only require- ments being to remain in the acceptable distance away from the monitor (participants were shown a position guide for reference) and to not obstruct the cameras utilized by the eye-tracker. Each participant was asked to com- plete three data retrieval tasks for the visualizations. As each visualization was presented to the participant, the test moderator gave a simple description of the visualization. Each participant was asked to answer a set of questions using specific parts of the visualization. Table 1 provides a summary of the tasks.
1 1 Are there more individuals with heart disease, diabetes, or hypertension in Forsyth County?*
Inconsistent x-axis scaling
1 2 Are there more individuals with hypertension or heart disease in Davidson County?* 1 3 Approximately how many individuals have diabetes in Randolph County?
Interactivity features 2 1 In April 2020, how many agencies were visited?
Y-axis navigation, x-axis scaling 2 2 In February of 2022, how many agencies were visited?
Color blocking
Y-axis navigation, x-axis scaling 2 3 At a glance, would you say more agencies were visited in 2020 or 2021?
3 1 What percentage of individuals with health considerations were Hispanic?
X-axis scaling, simplistic design 3 2 What percentage of individuals with health considerations were Black?
X-axis scaling, simplistic design
X-axis scaling, simplistic design 3 3 What percentage of individuals with health considerations were Asian, and is that a confident answer?
4 1 How many total pounds were distributed to Richmond County?
Color blocking
X-axis scaling, hover boxes 4 2 How many different branch codes were distributed to in Halifax County, and what are their identifiers?
Color blocking
4 3 Were more pounds distributed to Edgecombe or Orange County?
*Participants were requested to neglect interactivity features when answering these questions to further understand the relationship between accuracy rates and the presence of interactivity features.
After completing the usability study, participants were asked to complete a post-test survey that allowed them to reflect upon the visualizations. The survey gave 4 questions per visualization, those being one 5-point Likert scale to understand participant confidence in interpreting each visualization, two yes-no questions to determine if the interactivity and peripherals in each visualization were satisfactory, and one open-response question requesting any improvements participants could recommend. The survey was developed using Google Forms.
Data Collection Performance data such as accuracy was collected by manually comparing participant responses to the data used to create each graphic. Eye-tracking data was collected from Tobii Pro Spectrum and analyzed using Tobii Pro Labs. Survey data was collected using Google Forms.
Usability Evaluation of Food Bank Data Visualizations 425
RESULTS AND DISCUSSION
Performance Data Accuracy data were calculated based on the performance of the participants using the four visualizations and can be seen in table 2. The mean percent- age of correct responses was 66.7% with a standard deviation of 19.6%, showing that participants had some trouble using the visualizations to com- plete the tasks. Visualization 3 received the lowest percentage indicating some potential design issues.
Table 2. Participant responses to usability study.
Table available in the original PDF paper.
Visualization Number Percentage Correct 1 73.3% 2 66.7% 3 40.0% 4 86.7% Mean 66.7% Standard deviation 19.6%
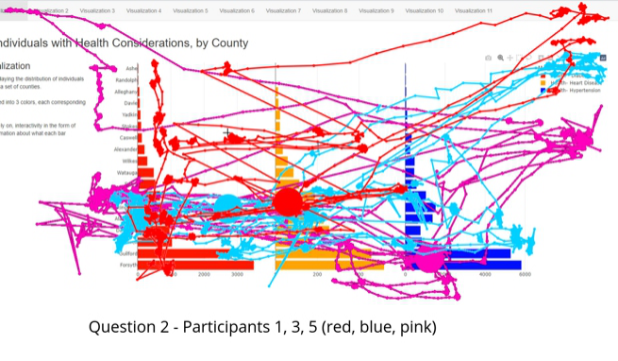
Eye Tracking Data Gaze plots were constructed based on the eye tracking data collected from each participant using the visualizations to answer a specific question. An example is shown in Figure 5, collected from when participants used visual- ization 1 to answer question 2 (Are there more individuals with hypertension or heart disease in Davidson County?).
Figure 5: Participant 1 (red), 3 (blue), and 5 (pink)’s eye-tracking data for question 2.
The gaze plots revealed that participants had a difficult time using this visu- alization due to a lack of consistent x-axis scaling, causing the participants
to rely on interactivity features in the form of hover boxes for interpretation. Notice that for participants 1 and 3, who answered question 2 incorrectly, there is a lack of gaze datapoints around the x-axis, but for participant 5, who answered correctly, the gaze data suggests a fair amount of attention allot- ted to the x-axes. This relationship between attention given to the x-axis and accuracy was also evident in question 1, with participant 1 neglecting the x- axis and reporting an incorrect value. Similar patterns were discovered from gaze data collected from other visualizations indicating that accuracy and magnitude of the data have a disproportionate relationship, and thus, par- ticipants would benefit from additional interactivity features such as hover boxes.
The results of the study on visualization 4 emphasize that reliance can- not only be placed on interactivity features, and peripheral characteristics of visualizations remain a priority for any complex analysis. Questions 1 and 2, being simple data retrieval questions, recorded a perfect accuracy rate, as participants simply needed to navigate to the relevant bar and use the inter- activity features to get the exact value. For question 3, which required participants to compare two different data entries, only a 60% accuracy rate was recorded. Notice from Figure 6, the two bars relevant to the question are approximately the same length and the x-axis is generally unhelpful, mean- ing comparing with solely peripheral characteristics isn’t feasible. The upper bar is stacked using color blocking techniques, so the interactivity feature will only display data relevant to one branch code at a time, rather than the total of the Edgecombe bar, and thus, participants cannot effectively use the interactivity feature to compare the two bars. Neither the subpar peripheral features nor the interactivity features are enough for participants to reliably compare the data.
Post-Study Survey Data The first question in the post-study survey asked participants to select a confidence level (1-5, with 1 representing a total lack of confidence and 5 representing complete confidence) that best suited their feelings about inter- preting the data presented in visualizations 1, 2, 3, and 4. The majority of participant confidence levels in interpreting the data presented in each visu- alization ranged from somewhat confident (3) to fairly confident (4). Only one participant responded with a 5, which was in pertinence to the data pre- sented in visualization 3, and no participants reported a confidence level less than 3.
The second question asked if participants felt they could accurately assume the data in each visualization using only visual characteristics (no interac- tivity features). For visualizations 1, 2, and 4, participant responses were evenly split between feeling that interactivity features weren’t necessary and feeling that they were. For visualization 3, all participants felt that they could accurately assume the data being presented without using interactivity features.
The third question asked if participants found the labels and legend in visualizations 1, 2, and 4 to be clear and informative. For visualizations 1
Usability Evaluation of Food Bank Data Visualizations 427
Figure 6: Filtered visualization 4.
and 2, 75% of participants found the labels and legend clear and informative, whereas for visualization 4, participant responses were evenly split between finding the labels and legend clear and informative and not.
Given that visualization 3 was designed to be simplistic and therefore didn’t feature prominent labelling techniques, we decided to instead ask par- ticipants if the simplistic nature of the visualization made it easier to interpret the data, harder, or if there was no noticeable effect. 75% of respondents reported that the simplicity made the visualization easier to interpret, and 25% reported no noticeable effect.
Recommendation This preliminary study revealed that there were some usability concerns in the selected visualizations of food bank operations data.
For visualization 1, we recommend either scaling the x-axis consistently to accurately display the comparison between individuals with health consider- ations or displaying the data as three separate visualizations with increased size to account for the immense range of the data. Further testing is necessary to determine which improvement is more effective; if the former is chosen, precision is decreased; if the latter is chosen, the ability to compare the three datasets being represented is lost.
We recommend adding interactivity features to visualization 2, as we believe it is necessary to increase participant accuracy in interpreting data at higher magnitudes. The color blocking techniques used were satisfactory in enabling comparison of data.
Based on the success of the x-axis scaling methods used in visualization 2, we recommend altering the x-axis of visualization 3 by increasing by intervals of 5 rather than intervals of 20 to increase participant accuracy in interpreting the data.
Lastly, for visualization 4, we recommend improving peripheral char- acteristics (x-axis scaling, sorting of the data) and adding more complex interactivity features (batch selection, dynamic data filtering, etc.) to account for the complex nature of the visualization. Participant responses indicate that the y-axis of visualizations 1, 2, and 4 was unsatisfactory, and should be re-ordered to bolster efficiency in finding data.
Findings suggest that, for smaller data sets, simplicity should be favored, as they produce consistent results across users. For larger data sets, interactivity features are essentially required to ensure precise values can be interpreted even across a data set with large magnitudes spanning a wide range; however, reliance on interactivity features alone proved insufficient for complex data retrieval tasks. Visualizations must have satisfactory peripheral qualities in the form of properly scaled x-axes, contextually ordered y-axes, and correctly applied color coding techniques to support the interactivity features.
CONCLUSION
A preliminary usability study was conducted using eye-tracking on selected food bank data visualizations. Eye fixation data collected from the study revealed important information how participants used the visualizations. Findings of the study can assist the creation of more effective data visual- izations for hunger-relief organizations, as well as serve as an introductory step to establishing standards using proper data visualization for food bank operations.
ACKNOWLEDGMENT
This research is partially funded by NSF EiR: Human Centered Visual Ana- lytics for Evidence Based Decision Making in Humanitarian Relief (Award #: CNS 2100855).
REFERENCES
Andrade C. (2021). Z Scores, Standard Scores, and Composite Test Scores Explained.
Indian journal of psychological medicine, 43(6), 555–557. https://doi.org/10. 1177/02537176211046525 Bazerghi, C., McKay, F. H. & Dunn, M. The Role of Food Banks in Addressing Food Insecurity: A Systematic Review. J Community Health 41, 732–740 (2016). https://doi.org/10.1007/s10900-015-0147-5 Bojko, A. (2005). Eye tracking in user experience testing: How to make the most of
it. In Proceedings of the UPA 2005 Conference. Coleman-Jensen, Alisha, Matthew P. Rabbitt, Christian A. Gregory, Anita Singh, September 2022. Household Food Security in the United States in 2021, ERR-309, U. S. Department of Agriculture, Economic Research Service. Delpish R., Jiang S., Davis L., Odubela K. (2018). A Visual Analytics Approach to
Combat Confirmation Bias for a Local Food Bank. In: Boring R. (eds) Advances
Usability Evaluation of Food Bank Data Visualizations 429
in Human Error, Reliability, Resilience, and Performance. AHFE 2018. Advances in Intelligent Systems and Computing, vol. 778, pp. 13–23. Springer, Cham. Desai, Y., Jiang, S. & Davis, L. (2017). Development of a Dashboard for a Local Food Bank. American Journal of Engineering and Applied Sciences, 10(1), 218–228. Feeding America. (n.d.). Hunger and food insecurity. Hunger in America. https://www.feedingamerica.org/hunger-in-america/food- insecurity#: ∼: text=A%20definition%20of%20food%20insecurity, people%20can’t%20afford%20food. Last retrieved, October 5 2023. Few, S. (2017). Data visualization effectiveness profile. Perceptual Edge, 10, 12. Hamilton, M., Jiang, S., Davis, L. (2023a). Understanding the Dietary Need of a
Local Food Bank’s Population Using Visual Analytics. In: Jay Kalra (eds) Health Informatics and Biomedical Engineering Applications. AHFE (2023) International Conference. AHFE Open Access, vol. 78. AHFE International, USA. https://doi. org/10.54941/ahfe1003452 Hamilton, M., Jiang, S., & Davis, L. (2023b, June). Visualizing a Local Food Bank’s Chronic Health Disease Population. In 8th North America Conference on Indus- trial Engineering and Operations Management, https://doi.org/10.46254/NA8. 20230154. Parks, L., Jiang, S., Davis, L. (2021), Development of a Dashboard to Improve
Fleet Maintenance for a Food Bank, Proceedings of the International Confer- ence on Industrial Engineering and Operations Management, Monterrey, Mexico, November 3–5, 2021. Poole, A., & Ball, L. J. (2006). Eye tracking in HCI and usability research. In Encyclopedia of human computer interaction (pp. 211–219). IGI global. Sadiku, M., Shadare, A. E., Musa, S. M., Akujuobi, C. M., & Perry, R. (2016).
Data visualization. International Journal of Engineering Research And Advanced Technology (IJERAT), 2(12), 11–16. Washington, H., Jiang, S., Davis, L., Kim, H. (2023a). Examining local food deserts using visual analytics. In: Christine Leitner, Jens Neuhüttler, Clara Bassano and Debra Satterfield (eds) The Human Side of Service Engineering. AHFE (2023) International Conference. AHFE Open Access, vol 108. AHFE International, USA. https://doi.org/10.54941/ahfe1003957 Washington, H., Jiang, S., Davis, L., & Kim, H. (2023b, July). E-Commence: Visu-
alizing a Growing Future of Tackling the Food Deserts Problem. In 6th European International Conference on Industrial Engineering and Operations Management, https://doi.org/10.46254/EU6.20230040.
LISTED IN THE AHFE DIGITAL BOOKSTORE CATALOGUE
Explore the complete digital volume
Human-Centered Design and User Experience
Read this individual research paper free through the original publisher, or explore the full digital proceedings book.
ISBN 978-1-958651-90-2
Explore this ISBN in the AHFE Bookstore ↗Listed in the July 2026 bookstore catalogue; search by ISBN to confirm current availability · Digital book purchase optional