Henry Ivuawuogu, Steven Jiang, Lauren Davis, Mikaya Hamilton (2024). Predictive Model for Partner Agencies Dependency on Food Banks. In: Human Factors in Design, Engineering, and Computing. AHFE Open Access, vol. 159, pp. 110–117. https://doi.org/10.54941/ahfe1005573
In the quest for equitable resource distribution within food banks and their partner agencies, understanding the dependencies of these agencies on food banks emerges as a critical factor. This study investigates the intricate dynamics influencing agency dependency ratios, exploring the complex factors that shape the demand for food resources. Leveraging historical self-reported dependency ratio data, this preliminary study employs predictive modeling using Multiple Linear Regression to forecast agency dependencies on food banks. The primary objective is to discern the underlying factors that significantly impact agency dependency ratios. Employing Least Absolute Shrinkage and Selection Operator (LASSO) as a feature selection technique, the study identifies the key variables that capture the essence of the dataset. Identifying the variables that contribute the most to the model paves the way for robust predictive modeling. This study offers a comprehensive approach to understanding and predicting agency dependencies on food banks. The findings hold significant implications for non-profit hunger relief organizations, aiding in strategic decision- making for equitable resource distribution.
Food insecurity, a critical economic and social condition denoting restricted access to nutritious food, stands as a daunting global challenge, imperiling the well-being of millions (Ivuawuogu et al., 2023). Defined by the United States Department of Agriculture (USDA) as the consistent absence of adequate, safe, and nutritious food to sustain an active and healthy life, this issue reverberates across physical and mental health, economic stability, and overall quality of life (Feeding America, n,d,).
Food banks, in collaboration with their partner agencies, form a complex distribution network aimed at reaching those in need. Food banks acquire donated food from various sources, including individuals, businesses, and government programs. The partner agencies, such as food pantries and soup kitchens, play a crucial role in the last-mile distribution of food to individuals and families facing food insecurity.
To achieve perfect equity, which is defined as distributing food proportional to the demand within each area of a food bank’s service
Predictive Model for Partner Agencies Dependency on Food Banks 111
region (Islam and Ivy 2022), it is imperative to understand the degree to which partner agencies depend on the food bank (dependency ratio). This dependency ratio holds the key to effective planning and resource allocation. Several factors (location, food insecurity rate, population, poverty, etc.) could influence the dependencies of these partner agencies on the food bank. Understanding these factors is vital for precise forecasting. The relationship between socioeconomic factors such as income, unemployment, and poverty, and their role in food insecurity, has been well-documented (Huang et al., 2016; Brown et al., 2022; Wight et al., 2014).
PROBLEM DESCRIPTION The Second Harvest Food Bank of Northwest North Carolina (SHFB) is a vital entity within the Feeding America network, playing a crucial role in combating hunger across 18 counties in the region. As one of the seven Feeding America affiliated food banks in North Carolina, SHFB ensures the distribution of nutritious food and essential services to individuals in need. The 2022 Annual Report highlights SHFB’s extensive impact, reaching over 34.5 million meals through a network of more than 460 local programs, including food pantries, shelters, soup kitchens, and specialized initiatives for children, families, and seniors. With decentralized branches acting as key hubs for storing and distributing food donations, SHFB effectively addresses the diverse needs of local communities.
SHFB’s current approach involves partner agencies self-reporting their dependency on the food bank, a complex issue influenced by various factors such as program types, service capacity, and visit frequency. Recognizing the unique characteristics of each agency, our study aims to develop a predictive model using linear regression. By understanding and accounting for the individuality of partner agencies, this research contributes to the equitable allocation of resources, supporting SHFB’s mission to alleviate hunger within communities.
RELATED RESEARCH In distributing food for hunger relief organizations, prioritizing equity, efficiency, and effectiveness is crucial. Predictive models, relying on deterministic parameters for demand estimation, facilitate precise resource allocation and planning for food banks and charitable organizations. Thompson et al. (2018) emphasize the significance of understanding ideal family demand through factors like daily energy requirements, family composition, and individual characteristics. Noteworthy contributions from Orgut et al. (2016) and Sengul and Lodree (2023) provide mathematical models addressing equity and effectiveness, with a focus on optimal allocation and strategic planning. Islam and Ivy, (2022) present a mixed integer programming model enhancing equity and efficiency in demand zone assignments to distribution centers, while Davis et al. (2014) optimize Food Delivery Points (FDPs) to enhance food access.
Expanding on the existing body of literature, our study endeavors to fill a crucial void by predicting the dependency ratio of partner agencies. This extends the equity discourse from counties to agencies, introducing a more granular perspective. Employing a predictive methodology, we aim to gain a nuanced understanding of resource allocation, tailoring distributions to align with the distinct dependencies and demand patterns of individual agencies. Through the application of Multiple Linear Regression, our research strives to unveil the socio-economic descriptors that influence agency dependency. This, in turn, contributes to more effective planning and implementation strategies within the context of food banks.
DATA COLLECTION AND PREPROCESSING The data for 2018 and 2019 was gathered from the SHFB. An in- depth analysis of the dataset’s characteristics was performed to gain a comprehensive understanding of the socio-economic indicators relevant to 415 agencies. Addressing missing values was a crucial part of the process, where the occurrence of ‘---’ representing missing data led to replacing these values with NaN. After conducting a comprehensive analysis of the dataset, there was no significant concerns regarding outliers, normality, or linearity. The overarching goal is to thoroughly examine and create a model that captures the relationship between the target variable, “Dependency Ratio,” and a specified set of predictor variables.
DATA EXPLORATION Data exploration commenced with a comprehensive exploration of the dataset, specifically focusing on the detection and mitigation of multicollinearity—a phenomenon where high correlations between variables can significantly impact the choice and reliability of predictors in a model. The identification of multicollinearity is crucial for ensuring the robustness of the model and preventing inflated standard errors.
Upon conducting the multicollinearity check, indications of multicollinearity were observed within the dataset. Given the substantial number of variables at our disposal, we employed the Least Absolute Shrinkage and Selection Operator (LASSO) as a feature selection technique. LASSO is particularly effective in reducing the number of variables while simultaneously addressing multicollinearity, promoting a more streamlined and interpretable model. This strategic use of LASSO allows us to enhance the efficiency of our analysis by selecting the most relevant predictors and mitigating the potential adverse effects of multicollinearity on the model’s performance. Table 1 below presents the sample of the culmination of variable selection achieved through the implementation of LASSO.
Predictive Model for Partner Agencies Dependency on Food Banks 113
Table 1. Sample of the dataset for the predictive model after LASSO.
Table available in the original PDF paper.
Predictive Variables Parameter Values Est. Distance- to Warehouse 25 Food Insecurity Rate 0.14 Highschool Dropout rate by Zip Code 0.14 Bachelor’s degree or Better by Zip code 0.31 Persons in Poverty by City 0.27 Number of Title I Schools (County) 15 Hourly Wage Necessary to afford 2 Bedroom Fair Rent Market 15.56 Annual Area Median Income 53000 Persons with Diabetes by County 0.09 Portion of total lbs. received from stores 0.35 Number of grocery stores in county 76 Dependency Ratio 0.58
DATA SPLITTING Following data exploration and preprocessing, the dataset is strategically partitioned into training and testing sets through an 80–20 split. This deliberate division is crucial for the robust development and evaluation of the regression model. The choice of an 80–20 split aims to strike a balance between training and evaluation phases. By assigning 80% of the data to the training set, the model gain exposure to a diverse range of examples, facilitating the capture of underlying patterns. Simultaneously, reserving 20% for testing serves as a reliable benchmark to assess real-world performance. This approach helps mitigate the risk of overfitting and ensures the effective generalization of models to new instances.
MULTIPLE LINEAR REGRESSION Multiple linear regression expands upon simple linear regression, estimating the relationship between a response variable y and multiple explanatory variables x1, x2,..., xp. The foundational equation for multiple linear regression is expressed as:
yi = β0 + β1x1i + β2x2i + . . . + +βpxpi + ei (1) Here, (βo) is the constant, the predicted value of y when all explanatory variables are at zero, while (β1, β2, ..., βp) are the coefficients associated with each explanatory variable. The term (ei) represents the error term capturing the difference between the predicted and observed values of (y).
The analytical approach employed in multiple linear regression offers a robust approach to explore relationships between multiple explanatory variables and a continuous response variable. The method relies on critical assumptions for model validity and reliability. Linearity assumes a linear relationship, homoscedasticity requires constant variance of residuals, and a normal distribution of residuals ensures valid statistical inferences. Limited multicollinearity minimizes correlation among explanatory variables, and the absence of external variables confirms the model includes all relevant factors. Independence assumptions encompass both error independence and independence among dataset observations. These collective assumptions form the foundation of the multiple linear regression model, guiding
researchers in interpreting complex relationships and drawing meaningful conclusions from the data.
PROBLEM DESCRIPTION In assessing the performance of our predictive models, we employed a suite of evaluation metrics to gauge their accuracy and precision. The Mean Squared Error (MSE), a foundational metric, measures the average squared difference between predicted and actual values. A lower MSE signifies superior predictive accuracy. Similarly, the Mean Absolute Error (MAE) provides insights into the average absolute difference between predicted and actual values, offering a straightforward assessment of model precision. The Root Mean Squared Error (RMSE), an extension of MSE, presents the average prediction error in the same unit as the target variable, facilitating a more intuitive interpretation of errors. Additionally, the Mean Squared Logarithmic Error (MSLE), applied conditionally, evaluates the average logarithmic difference between predicted and actual values. This metric is particularly valuable when dealing with variables with varying magnitudes. Each of these metrics contributes a unique perspective to the evaluation process, ensuring a comprehensive understanding of the model’s performance across different aspects of prediction and accuracy.
RESULTS
Acknowledging the challenge of multicollinearity within our dataset, our analytical journey led us to strategically employ dimensionality reduction techniques. With an initial set of 20 attributes, the implementation of LASSO emerged as a robust solution, effectively reducing the variable count to a more manageable and meaningful 11. This reduction not only streamlined the dataset but also established the groundwork for a focused and interpretable analysis. By honing in on the most influential variables, we not only mitigated redundancy but also ensured a refined dataset that contributes to a more nuanced understanding of the relationships within.
Building upon this refined dataset, the subsequent step involved the construction of a multiple linear regression model. The strategic reduction of variables, coupled with the application of LASSO, not only set the stage for a more efficient and focused regression model but also positioned our analysis to provide meaningful insights into the intricate dynamics of the dataset. Analyzing the test dataset’s performance, the model reveals a Mean Squared Error (MSE) of 0.03 and a corresponding Mean Absolute Error (MAE) of 0.13. The Root Mean Squared Error (RMSE) yielded a value of 0.17, while the Mean Squared Logarithmic Error (MSLE) was observed to be 0.03. The final regression equation is expressed as: Dependency Ratio = −23.9211 − 0.8313(Portion of total lbs. received from stores) + 0.1121(Number of grocery stores in county) + 18.2131(Persons with Diabetes by County) + 0.0003(Annual Area Median Income) + 0.5615(Hourly Wage Necessary to afford 2 Bedroom Fair Rent Market) + 0.0031(Number of Title I Schools (County) – 0.5923 (Persons in Poverty by City)) – 0.1516 (Bachelor’s degree or Better by Zip
Predictive Model for Partner Agencies Dependency on Food Banks 115
code) – 0.5191 (High School Dropout rate by Zip code) + 8.1795 (Food Insecurity Rate) + 0.0023 (Est. Distance- to Warehouse).
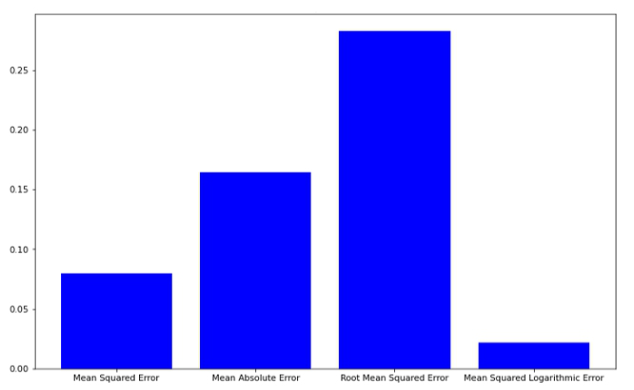
In evaluating the performance of our model on the validation dataset, Figure 1 illustrates its effectiveness across various metrics. The linear regression model exhibited a Mean Squared Error (MSE) of 0.08, representing the average squared difference between predicted and actual values. The Mean Absolute Error (MAE) registered at 0.16, shedding light on the average absolute difference between predicted and actual values. Additionally, the Root Mean Squared Error (RMSE), an extension of MSE, was computed as 0.28, offering insight into the average prediction error measured in the same unit as the target variable. Notably, the linear regression model demonstrated a Mean Squared Logarithmic Error (MSLE) of 0.02, underscoring its effectiveness, especially in scenarios involving variables with varying magnitudes. The comprehensive analysis of these metrics provides a thorough understanding of the model’s performance, highlighting its accuracy and reliability across diverse evaluation criteria.
The derived regression equation unveils the weighted contributions of each variable towards predicting the Dependency Ratio. Notably, variables such as the portion of total pounds received from stores, the number of grocery stores in the county, and the presence of persons with diabetes emerged as significant factors influencing the Dependency Ratio. The negative coefficients associated with factors like poverty rates and educational attainment underscore their impact on dependency ratios.
Understanding these relationships provides valuable insights for policy- making, resource allocation, and strategic interventions aimed at addressing socio-economic challenges related to dependency ratios. For instance, the positive coefficient of the hourly wage necessary to afford a 2-bedroom fair rent market suggests a potential link between economic well-being and dependency ratios.
Figure 1: Domains of human systems integration. (Adapted from U.S Air Force, 2005).
Moreover, the evaluation metrics in Figure 1 demonstrate the model’s accuracy and reliability. The low values of MSE, MAE, RMSE, and MSLE signify a close alignment between predicted and actual values, bolstering confidence in the model’s predictive capabilities. This robust performance across multiple metrics enhances the model’s utility and underscores its potential for real-world applications.
CONCLUSION
Through this in-depth analysis of partner agency dependency within the SHFB, we have not only developed a predictive model using Multiple Linear Regression but also streamlined our dataset for greater interpretability. The resulting linear regression equation, supported by meticulous evaluation metrics, reveals significant factors influencing the Dependency Ratio, offering valuable insights for strategic interventions. The success of this model in capturing the complexities of this network highlights its potential for real- world applications and underscores its role in guiding resource allocation and decision-making. By extending the equity discourse from counties to agencies, this research contributes to a more understanding of socio-economic factors shaping food security. As we forge ahead, this study lays the groundwork for future endeavours to refine predictive models and advance the collective mission of alleviating hunger within communities.
ACKNOWLEDGMENT
This project is partially supported by NSF award #2100855 and NSF Award #173528. Any opinions, findings, and conclusions or recommendations expressed in this material are those of the author(s) and do not necessarily reflect the views of the National Science Foundation.
REFERENCES
Brown, H., Mills, S., & Albani, V. (2022). Socioeconomic risks of food insecurity during the Covid-19 pandemic in the UK: findings from the Understanding Society Covid Survey. BMC Public Health, 22(1), 590. Davis, L. B., Sengul, I., Ivy, J. S., Brock III, L. G., & Miles, L. (2014). Scheduling food
bank collections and deliveries to ensure food safety and improve access. Socio- Economic Planning Sciences, 48(3), 175–188. Feeding America. (n.d.). Hunger in America - a definition of food insecurity. Feeding America Website: https://www.feedingamerica.org/hunger-in-america/. Huang, J., Kim, Y., & Birkenmaier, J. (2016). Unemployment and household food
hardship in the economic recession. Public Health Nutrition, 19(3), 511–519. Islam, M. H., & Ivy, J. S. (2022). Modeling the role of efficiency for the equitable and effective distribution of donated food. Or Spectrum, 44(2), 485–534. Ivuawuogu, H., Jiang, S., & Davis, L. (2023, May). Clustering Partner Agencies for
a Local Food Bank. In Proceedings of 2023 Industrial and Systems Engineering Annual Conference. Orgut, I. S., Ivy, J., Uzsoy, R., & Wilson, J. R. (2016). Modeling for the equitable and effective distribution of donated food under capacity constraints. IIE transactions, 48(3), 252–266.
Predictive Model for Partner Agencies Dependency on Food Banks 117
Sengul Orgut, I., & Lodree, E. J. (2023). Equitable distribution of perishable items in a food bank supply chain. Production and Operations Management, 32(10), 3002–3021. Thompson, C., Smith, D., & Cummins, S. (2018). Understanding the health and
wellbeing challenges of the food banking system: A qualitative study of food bank users, providers and referrers in London. Social Science & Medicine, 211, 95–101. Wight, V., Kaushal, N., Waldfogel, J., & Garfinkel, I. (2014). Understanding the link between poverty and food insecurity among children: does the definition of poverty matter?. Journal of Children and Poverty, 20(1), 1–20.
LISTED IN THE AHFE DIGITAL BOOKSTORE CATALOGUE
Explore the complete digital volume
Human Factors in Design, Engineering, and Computing
Read this individual research paper free through the original publisher, or explore the full digital proceedings book.
ISBN 978-1-964867-35-9
Explore this ISBN in the AHFE Bookstore ↗Listed in the July 2026 bookstore catalogue; search by ISBN to confirm current availability · Digital book purchase optional