Henry Washington, Steven Jiang, Lauren Davis, Hyung Nam Kim (2023). Examining local food deserts using visual analytics. In: The Human Side of Service Engineering. AHFE Open Access, vol. 108, pp. 405–411. https://doi.org/10.54941/ahfe1003957
Food insecurity, an economic and social condition where households have limited access to nutritious food, is a long-standing and growing problem in both the rural and urban areas of the United States. Food deserts refer to areas that do not have adequate food access to affordable and nutritious food. Food deserts can be characterized by availability, accessibility, accommodation, affordability, and acceptability (5A’s). This research investigates food deserts in Mecklenburg County, North Carolina, which includes the city of Charlotte. The food insecure population estimate in Mecklenburg County is about 15% which is higher than the national average of 11%. Using visual analytics, a combination of analytics and human factors, this study aims to examine how age, education, and income are related to food deserts in Mecklenburg County. Data gathered from US Census Bureau was used for analysis. Results indicated that education and food desert status, and age and food desert status in Mecklenburg County were related.
Food insecurity refers to an economic and social condition when people have limited access to healthy food (USDA, 2021). There used to be three labels of food security used by USDA: food security, food insecurity without hunger, and food insecurity without hunger. To differentiate between insecurity and hunger, the Committee on National Statistics (CNSTAT) classified food secu- rity into: high food security, marginal food security, low food security, and very low food security (USDA, 2021). Food insecurity has become a large public health concern and is considered one of the social determinants of health (USDA, 2021, Dukto et al., 2012). Obesity, heart disease, and diabe- tes are associated with the overconsumption of energy dense, low nutrition food. Diabetes has also gained public attention especially diabetes in children (Dutko et al., 2012). Children are a demographic who represent a large pre- cent of the U.S. population in poverty, where in 2020 the U.S. poverty rate is 16.1% for people under 18. The U.S. poverty rate across all age groups in 2020 is 11.4% (Shrider et al., 2021). Food insecurity affects not only those people living in rural areas but also those live in urban areas. The geographic area that have limited access to
affordable and healthy food is called food desert. A food desert is more likely found in an area composed of predominately low-income communities (Institute of Medicine & National Research Council, 2009).
Food insecurity describes the people who lack access the nutritious foods while food deserts shift the focus toward the environment where these food insecure consumers tend to live. Food insecure consumers lack the income for consistent and healthy meals, while food deserts include low-income neighborhoods in its definition (Haskell, 2022).
The USDA measures food deserts per census tract which is a subdivision of a county with a population between 1,000 and 8,000 people. A census tract with low income (20 percent or higher poverty rate, or the median family income is less than 80 percent of the state median family income) and low access (at least a third of census tract population lives greater than a mile from a supermarket and grocery store for urban areas or 10 miles for rural areas) is considered a food desert (Ver Ploeg et al., 2011). Alternatively, a food desert can also be defined as a low-income census tract where the distance to a supermarket or a large grocery store is 0.5 miles in urban areas while a rural census tract’s distance remains as 10 miles. A third definition is, while the urban tract distance remains at 1 mile, the rural tract distance is 20 miles (USDA, 2022). The fourth definition considers transportation. A food desert is where 100 or more households living in at least 0.5 mile from a large grocery store do not have access to vehicles or 500 or more households that have access to vehicles live at least 20 miles away from a large grocery store. USDA identified 6500 census tracts (about 10%) as food deserts, affecting 13.5 million households. Food deserts are in both urban and rural areas across the U.S. The USDA reported that larger levels of poverty increase the likelihood of a food desert’s presence regardless of the area type, rural or urban (Dutko et al., 2012). According to USDA. North Carolina is the 16th worst in the United States with 16% of the 2195 census tracts being food deserts.
This study focus on Mecklenburg County, North Carolina, which contains the city of Charlotte and the surrounding suburbs. A small percentage of the county is considered rural. Mecklenburg County currently has 15% of its 2.8 million population living in a food desert, which is higher than the national average of 11% and the North Carolina’s state average of 13% (McFadden, 2020). This project aims to use visual analytics, a combination of analytics and human factors, to examine how age, education, and income are related to food deserts in Mecklenburg County.
METHODS
Data Collection For this research, data was collected from various sources like the U.S. Census Bureau and the USDA as shown in Table 1. This data was used to conduct a multiway frequency analysis and create several map overlays of Mecklenburg County.
Examining Local Food Deserts Using Visual Analytics 407
Table 1. Data collection for Mecklenburg County, NC.
Table available in the original PDF paper.
Type of Data Measure Location
Percentage
Total Population number of people Census Website - https://data.census.gov/cedsci/table Median Income Dollars (USD) Income breakdown Dollars (USD) Education breakdown Percentage Age breakdown Percentage Median Age Years Poverty rate Percentage Poverty rate for Mecklenburg County Tract Food Desert Location Binary (Y/N) USDA Website - https://www.ers.usda.gov/data- products/food-access-research- atlas/download-the-data/ Food insecurity Percentage Census Tract Location
Location (Geodata Data)
Census Website - https://data.census.gov/cedsci/table
Visualization and Statistical Analysis To address the relationship among the age, education, income, and food deserts, visualization was developed using Tableau. Multiway frequency analysis was also conducted to reveal the relationship from the statistical perspective.
The visualization aspect includes a map overlay of Mecklenburg County, made in Tableau. Sourced from the USDA and U.S. Census Bureau, education, age, and age demographics data has its own overlay. Also, the shapefiles and centroid for each Mecklenburg census tract used for the overlay was sourced from the U.S. Census Bureau.
RESULTS AND DISCUSSION
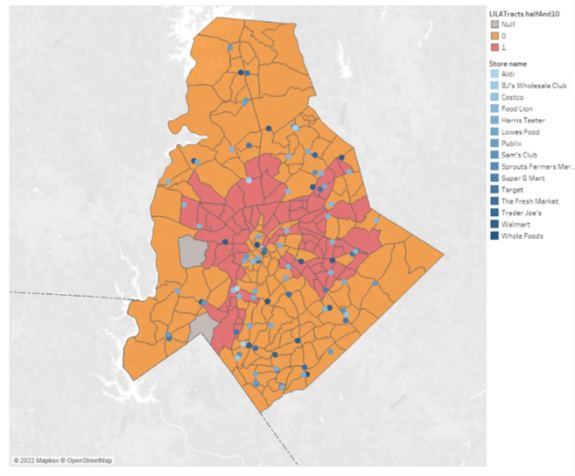
The visualization of overlays of Mecklenburg County with the highlighted food desert census tracts is developed using Tableau. Figure 1 shows food deserts according to the low-income, low-access 0.5-mile urban tract and 10-mile rural tract definition. 79 census tracts were classified as a food desert. The blue-grey highlighted census tracts contain no residential population within the borders. Two examples are census tract 9803, which contained the entirety of the Charlotte Douglas International Airport (CLT) and census tract 9802, which contained Carowinds Amusement Park and a warehouse district. The food deserts in Mecklenburg County were concentrated in the city of Charlotte and surrounded downtown Charlotte to the north, west and east in a C-shape cluster. A large concentration of stores locations was found in southern Mecklenburg County. The majority of the GIS store locations lan- ded in the orange-highlighted non-food desert tracts. There were some food deserts which contained a store location, as seen in Figure 1. However, this was caused from using 2010 census tract data for classifying food deserts
Figure 1: Mecklenburg County; low income & low-access: 0.5 mile urban and 10 miles rural; orange area (0) = non-food desert; red area (1) = food desert.
while using current 2022 GIS store locations. Between 2010 and 2022, a physical store could have been built in the highlighted food deserts.
When the food desert definition was changed from low-access 0.5 urban to 1 mile urban, the number of food deserts dropped to 19. The remaining food deserts, were north, northwest, and east of Charlotte’s downtown area. Mecklenburg County contained 7 rural tracts and 224 urban tracts. Regard- less of the food desert definition, all discovered food deserts in Mecklenburg County were urban tracts. In both situations, the food deserts clustered toge- ther; Every census tract labelled as a food desert, with exception to one, shared a border with another food desert.
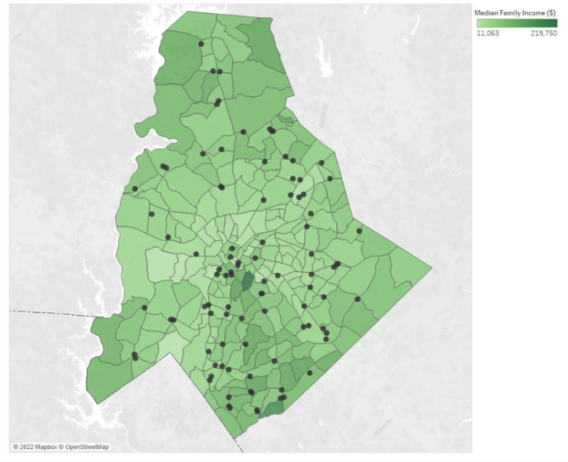
The median household income across all tracts in Mecklenburg was ∼$56.3k. The minimum median household income ∼$11k was from tract 3 while the maximum was ∼$219k from tract 28 as seen in Figure 2. Despite the broad range between their median incomes, tract 3 and tract 28 were both located in downtown Charlotte and central Mecklenburg County. Nei- ther tract were food deserts. While comparing Figures 1 and 2, the lighter green areas (lower income tracts) appeared to also be food deserts.
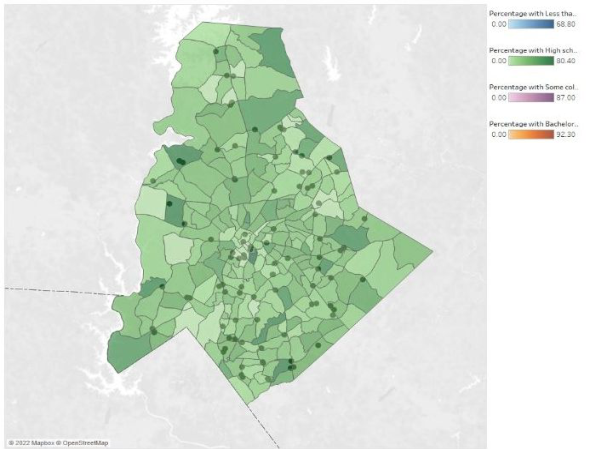
Similarly, education level (i.e., high school, Batchelor’s degree) can be plot- ted as an overlay of the population percentage as seen in Figure 3. In terms of education in Mecklenburg County, the most common majority for each cen- sus tract was ‘some college education’, which was any college education less than a bachelor’s degree, like an associate degree at a count of 118. A census tract with some education had the highest count of food deserts followed by the majority with less than a high school degree at 36 and 26, respectively. It was not examined if the census tracts with a majority of less than a high
Examining Local Food Deserts Using Visual Analytics 409
Figure 2: Mecklenburg County; median income; range from $11,000 - $220,000.Figure 3: Mecklenburg County; % of population with a high school degree or equivalent.
school degree were because of a large child population or from adults who had not graduated from high school. If the bachelor’s degree or higher cate- gory was the majority in a census tract, the visualization shows a low count of confirmed food deserts.
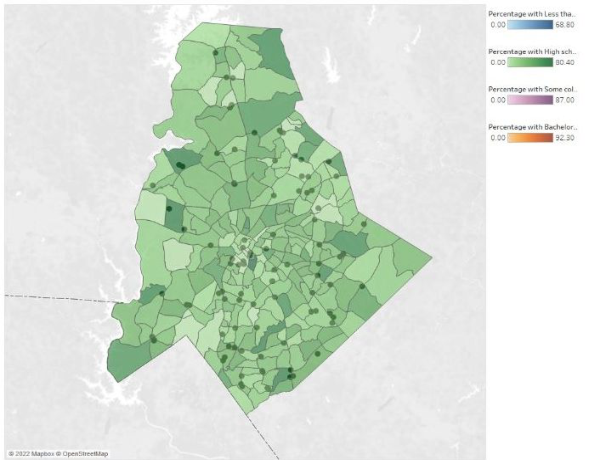
Figure 4 shows the census tract population between the ages of 25 and 34, which contained a combination of the Millennial generation and Generation X during the 2010 U.S. census. Mecklenburg County census tracts with a median age between 25 to 34 years old was the largest group.
Multiway Frequency Analysis A multiway frequency analysis was conducted to study the relationship among the four discrete variables: Food Desert, Age, Income, and Educa- tion. Results did not show a significant association among all four variables (χ2=6.11, p = 0.5272). However, there is a significant association between food desert, age and education χ2=15.95, p<0.05). A significant associa- tion between food desert, income and age was also revealed (χ2=19.59, p<0.05). Although the association between food desert, income, and age was not significant at 0.05 level of significance, it is significant if the 0.1 level of significance is used. These results suggest that studies of food desert need to consider these important factors since they are associated with food desert.
Further frequency analysis revealed that census tracts with the median age of less than $50k and between $50k to $74.99k were the most common at 90 and 78 tracts respectively. The higher end of a median income greater than $100k was not common for a census tract. If the census tract had a median income of less than $50k, then they seemed more likely to be a food desert. Out of the 79 confirmed food deserts, census tracts with a median income of less than $50k accounted for 73 of them. Because of the lack of data points for every category, like $100k+ for confirmed food desert, the Chi square test could not be performed so, no statistical solution was found for the relation between median income and food desert status in Mecklenburg County. If a
Figure 4: Mecklenburg County; % of population between 25 to 34 years old.
Examining Local Food Deserts Using Visual Analytics 411
census tract’s median income was above $75k, then it was not classified as a food desert at all.
Frequency analysis of the age reveals the census tracts with a median age between 32 and 40 years old was the largest group at 117. According to the U.S. Census Bureau, the median age of Mecklenburg County is 35.2, this made sense. This group had the most food deserts at 33 followed closely by 28 for median age between 26 and 32 years old.
CONCLUSION
This project used visual analytics approach to study the relationship among some key factors and food deserts in the Mecklenburg County in North Caro- lina. The combination of the visualization and the statistical analysis provides evidence based decision support to take appropriate actions to alleviate food deserts. Future work will include exploring different interventions including e commerce to tackle food deserts problems.
ACKNOWLEDGMENT
This project is partially supported by NSF award# 2100855. Any opinions, findings, and conclusions or recommendations expressed in this material are those of the author(s) and do not necessarily reflect the views of the National Science Foundation.
REFERENCES
Dutko, P., Ver Ploeg, M., & Farrigan, T. (2012). Characteristics and Influential Factors of Food Deserts (Economic Research Report, pp. 1-30, Rep. No. 140). United States Department of Agriculture. Haskell, S. (2022, January 21). Food insecurity and food deserts: How are they rela-
ted? Retrieved February 03, 2022, from https://www.canr.msu.edu/news/food-ins ecurity-and-food-deserts-how-are-they-related Institute of Medicine (IOM) & National Research Council (NRC). (2009). The public health effects of food deserts: Workshop summary. Washington, DC: The National Academies Press. McFadden, J. (2020, April 06). Eating healthy in a food desert: Mecklenburg leaders
seek New Solutions. Retrieved January, 25th 2023, from https://ui.charlotte.edu /story/eating-healthy-food-desert-mecklenburg-leaders-seek-new-solutions Shrider, E. A., Kollar, M., Chen, F., & Semega, J. (2021, October 18). Income and poverty in the United States: 2020. Retrieved January, 25th 2023, from https: //www.census.gov/library/publications/2021/demo/p60-273.html USDA (2022, October 20). Food Access Research Atlas. Retrieved January, 25th
2023, from https://www.ers.usda.gov/data-products/food-access-research-atlas/ documentation/#:~:text=Definition%3A%20A%20tract%20in%20which,super market%2C%20regardless%20of%20vehicle%20availability. USDA. (2021, May 29). Stores accepting snap online. Retrieved January, 25th 2023, from https://www.fns.usda.gov/snap/online-purchasing-pilot Ver Ploeg, M., Nulph, D., & Williams, R. (2011, December 1). Mapping food deserts
in the United States. Retrieved January, 25th 2023, from https://www.ers.usda.g ov/amber-waves/2011/december/data-feature-mapping-food-deserts-in-the-us/
LISTED IN THE AHFE DIGITAL BOOKSTORE CATALOGUE
Explore the complete digital volume
The Human Side of Service Engineering
Read this individual research paper free through the original publisher, or explore the full digital proceedings book.
ISBN 978-1-958651-84-1
Explore this ISBN in the AHFE Bookstore ↗Listed in the July 2026 bookstore catalogue; search by ISBN to confirm current availability · Digital book purchase optional