Steven Jiang, Kehinde Odubela, Lauren Davis (2022). Evidence-based decision making using visual analytics for a local food bank. In: The Human Side of Service Engineering. AHFE Open Access, vol. 62, pp. 442–447. https://doi.org/10.54941/ahfe1002587
Food insecurity is defined as an individual or household’s inability or limited access to safe and nutritious food that every person in the household need for an active, healthy life. In this research, we apply visual analytics, the integration of data analytics and interactive visualization, to provide evidence-based decision-making for a local food bank to better understand the people and communities in its service area and improve the reach and impact of the food bank. We have identified the indicators of the need, rates of usage, and other factors related to the general accessibility of the food bank and its programs. Interactive dashboards were developed to allow decision-makers of the food bank to combine their field knowledge with the computing power to make evidence-based informed decisions in complex hunger relief operations.
Food insecurity is defined as an individual or household’s inability or limited access to safe and nutritious food that every person in the household need for an active, healthy life (Campbell, 1991; Coleman-Jensen, et al., 2020). The United States Economic Research Service (ERS) reported that 13.7 million households (10.5% of US households) were food insecure at least sometime during the year and 4.1 percent of the household experienced very low food security defined as one or more times, the food intake of household mem- bers was reduced, and their eating patterns were disrupted (Coleman-Jensen, et al., 2020). Food insecurity can be attributed to poverty, underemployment, stagnant wages, and rising costs of living (Davis, et al., 2016).
In North Carolina, 1,417,440 people including 419,470 children are facing hunger (Feeding America, 2021). In other words, 1 in 7 North Carolinians and 1 in 5 children are facing hunger. The food insecurity rate for North Carolina is at 12.1% based on a recent study of three year average (2018- 2020) conducted by United State Department of Agriculture (USDA), which ranks NC the 11th with food insecurity among the nation (USDA ERS, 2021).
Many households that face food insecurity are not eligible for deferral nutrition programs and rely on hunger relief organizations such as food banks. Feeding America is the largest hunger-relief organization in the Uni- ted States and has a network of 200 food banks across America. Food banks are nonprofit organizations that aims to improve food insecurity by seeking
Evidence-Based Decision Making Using Visual Analytics for a Local Food Bank 443
donated food from various sources (individual donors, supermarkets, etc.) and redirecting this food to individuals or households seeking charitable food assistance. A typical food bank has a network of branches that serve as hubs for food distribution. Each food bank branch works with local partner age- ncies to get the food directly to individuals that need food assistance within their service area. With the increased demands and the prevalence of the food insecurity, food banks often need to purchase food as well. The Covid-19 pan- demic has caused the demand to increase and there is an urgency to meet the needs from the food insecure individuals and/or households. Food bank ope- rations are very complex due to its inherent uncertainty in both supply and demand (Delpish, et al., 2018). Supply of the food bank comes from dona- tions from manufacturers, grocers, and farmers and the amount and quality of the food items are not certain and can be affected by multiple factors. On the other hand, the needs from the food insecure individuals and/or the households drives the demand for the food bank and these needs are depen- dent on socioeconomic factors such as poverty and unemployment, and the sudden-onset disasters such as natural disasters (i.e., hurricanes) and slow- onset disasters such as pandemic (i.e., COVID-19). These disasters can cause disruptions in the community including economic losses to individuals and households which can aggravate the food insecurity.
There are seven feeding America affiliated food banks in North Carolina and one of them is Second Harvest Food Bank of Northwest North Carolina (SHFBNNC). SHFBNNC serves 18 counties in northwest NC. SHFBNNC has a network of nearly 470 partner programs and distributes over 43 mil- lion pounds of food to over 170,000 individuals across 18 counties every year. Each county and partner program have their unique assets, needs and chal- lenges. The complexity of the food bank operations prompted SHFBNNC to seek understanding of the root causes of food insecurity in the service area and to maximize the reach and impact of the food bank and their network. In this research, we worked with SHFBNNC to utilize visual analytics (VA), an approach that combines data analytics with human factors (Desai, et al., 2017; Parks, et al., 2021) to provide evidence-based decision making support to food bank operations managers.
METHOD
In this research, we adopted human centered design (HCD) approach in the development of the interactive dashboards for the food bank. HCD focu- ses on the requirements of the potential user from the product’s inception and checks at each step of the design phase with these users to ensure sati- sfaction with the final interface design. We started with analyzing the needs and requirements of SHFBNNC. This was done through interviews and field observations. Exploratory data analysis was used to complement user resea- rch. User profiles were developed to gain better understanding of users. Task analysis was conducted to describe how SHFBNNC perform their decision making tasks and this served as a guide for visualization and interaction development. Closely working with SHFBNNC, data analytics, an intera- ctive dashboard was designed to address the needs identified. Evaluation of
Table 1. Description of sample data.
Table available in the original PDF paper.
Data description Example Sources Service Insights Link2Feed (L2F)
number of households and individuals
Household/individual who seek food assistance
residence
rates of use,
dietary considerations and health concerns
total poundage
Poundage Information
Monthly Reports from Partners
lbs on own
Store Rescue lbs.
Fees
Shared maintenance
Monthly Reports from Partners
Rural delivery fees
Food purchase program fees
Food bank operation file
Operation hours
Partner agency and food bank operation
Rural delivery date and time
Location of program sites
the dashboard was conducted with real users to test the utility and usability of the system. Several iterations were made to revise the dashboard. Prior to the development, we identified user needs. Several interviews were conducted with two operations managers from SHFBNNC. Due to the pandemic restri- ctions, virtual interviews were conducted via Zoom meetings. Task analysis was conducted to understand how food bank managers perform their opera- tions tasks. In order to develop the dashboard, we collected data from various sources to support evidence based decision making. Table 1 below provides details of the sample data collected in this research.
With the users centered in the deign process, interactive dashboards were developed to meet the user needs. Three interactive dashboards were developed using Tableau to address different user needs.
Various visualization styles and interactivity modes were applied using human factors principles and with the input from the users. The first dash- board addresses the concerns of weekly food distributions of the food bank and their agencies. The second dashboard focuses on poundage informa- tion and the third dashboard provides information on impact analysis where food insecurity and annual meal gap were provided for each service area. Heuristic evaluation was conducted to assess the usability of the dashboard. Heuristic evaluation is a discount usability evaluation technique that experts apply design principles/heuristics to measure the usability of an interface. Two experts with expertise in both human factors and food bank operati- ons explored the interactive dashboard and reported usability issues. Design revisions were made based on the heuristic evaluation.
Evidence-Based Decision Making Using Visual Analytics for a Local Food Bank 445
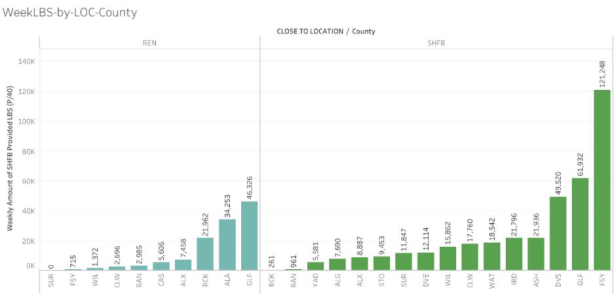
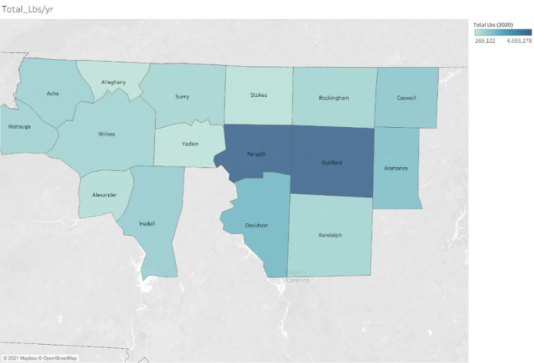
Figure 1: Weekly food distribution by county.Figure 2: Total pounds per year.
RESULTS
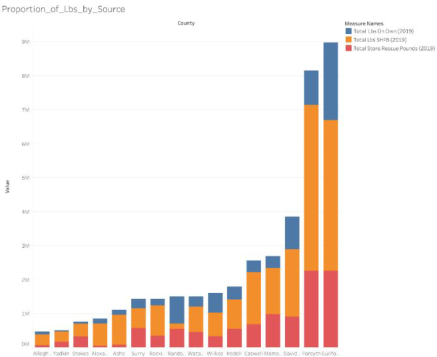
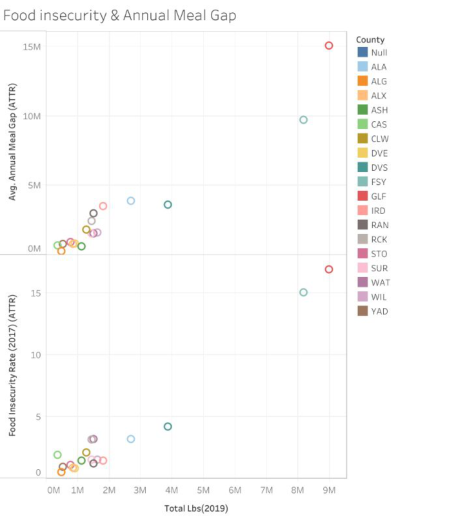
Three interactive dashboards were developed to meet the needs of the food bank to better understand their service area and their service programs. The first dashboard has four tabs each provides information about the weekly food distribution that can assist SHFBNNC managers to make informed decision. These four tabs are: Weekly Food Distribution by County, Weekly Food Distribution by-Agency Location, Number of Agencies in a County, and Weekly Food Distribution. An example tab of this dashboard can be seen in Figure 1. The second dashboard has four tabs that provide information on poundage. These four tabs are: Total pounds per year, Pounds vs. fees for a given year, Proportion of pounds by source, and breakdown of pounds by source. Example tabs can be seen in Figure 2 and Figure 3. The third dashbo- ard provide impact analysis that considers food insecurity and annual meal gap as seen in Figure 4.
Figure 3: Proportion pounds by source.Figure 4: Impact analysis.
DISCUSSION AND CONCLUSION Food bank operations are very complex and food bank operations mana- gers need assistance to provide evidence based decision making. Food bank data are large, heterogeneous, and messy and it is very challenging for their operations managers to make informed decisions using those data. This research applied visual analytics approach that combines the power of the
Evidence-Based Decision Making Using Visual Analytics for a Local Food Bank 447
analytics and human factors to provide interactive visualizations and dash- boards to allow the managers to easily explore the data and interact with the visualizations to make decisions that are based on evidence.
Working with a local food bank, we applied human centered design to the development of the interactive dashboards. SHFBNNC operations managers were at the center of the design process and were closely involved in every step of the design process. Food bank operations are very complex and despite the expertise of human factors engineers, food bank operations managers are the end users of the dashboards and therefore need to be active participants of the design process. This research provided a quick and easy tool for the managers to view the data and visualizations. There are still more work that needs to be done to investigate the possible trends, correlations, and implica- tions of the food bank operations data. Those enhanced understanding of the data will allow the food bank to improve future planning, capacity building, equitable distribution, optimal resource allocation and ultimately contribute to the effort to alleviate food insecurity in the community.
The enhanced understanding of these areas will help the food bank identify opportunities for enhanced efficiencies, well-managed uses of resources and targeted programmatic activities.
ACKNOWLEDGMENT
This research is partially funded by NSF EiR: Human Centered Visual Analy- tics for Evidence Based Decision Making in Humanitarian Relief (Award #: CNS 2100855). We would like to thank Eric Aft and Nikki McCormick from Second Harvest of Northwest North Carolina for their assistance in the study.
REFERENCES Campbell, C.C., (1991). “Food insecurity: a nutritional outcome or a predictor variable?” Journal of Nutrition, 121(3), 408–415. Coleman-Jensen, A., Rabbitt, M., Gregory, C., Singh, A. (2020). Household food
security in the United States in 2019. USDA-ERS Economic Research Report (ERR-275). Davis, L. B., Jiang, S. X., Morgan, S. D., Nuamah, I. A., Terry, J. R. (2016).
Analysis and prediction of food donation behavior for a domestic hunger relief organization. International Journal of Production Economics 182, 26–37. Delpish R., Jiang S., Davis L., Odubela K. (2018). A Visual Analytics Approach to Combat Confirmation Bias for a Local Food Bank. In: Boring R. (eds) Advances in Human Error, Reliability, Resilience, and Performance. AHFE 2018. Advances in Intelligent Systems and Computing, vol 778, pp13-23. Springer, Cham. Desai, Y., Jiang, S. & Davis, L. (2017). Development of a Dashboard for a Local Food
Bank. American Journal of Engineering and Applied Sciences, 10(1), 218–228. Feeding America: Hunger in North Carolina. https://www.feedingamerica.org/hungerin-america/north-carolina, accessed 12/18/2021. Parks, L., Jiang, S., Davis, L. (2021), Development of a Dashboard to Improve
Fleet Maintenance for a Food Bank, Proceedings of the International Confere- nce on Industrial Engineering and Operations Management, Monterrey, Mexico, November 3-5, 2021. USDA Economic Research Services, Food Security Status of U.S. Households in
Read this individual research paper free through the original publisher, or explore the full digital proceedings book.
ISBN 978-1-958651-38-4
Explore this ISBN in the AHFE Bookstore ↗Listed in the July 2026 bookstore catalogue; search by ISBN to confirm current availability · Digital book purchase optional