Jin Nakashima, Kohei Otake (2023). The Influence of Purchase Purpose and Customer Loyalty on Purchase Behavior in Fashion Stores. In: Human Factors, Business Management and Society. AHFE Open Access, vol. 97, pp. 345–355. https://doi.org/10.54941/ahfe1003912
In recent years, with the spread of COVID-19 infection, the consumer market in real places such as department stores and shopping centers was hit hard. The latest consumer trend surveys indicate that what consumers are looking for in physical shops after the coronavirus has been contained is 'confidence' and 'surprise' through the experience of touching actual products. From this, it can be inferred that the insight of consumers in actual shops lies in the process leading up to the purchase, i.e. the experience value, such as how they use the shop and search for products.In this study, we conducted an experiment on consumer behavior in a department store, and proposed marketing measures unique to a real shop in accordance with consumer behavior, using data on the flow line of shop movement and questionnaire data before and after the experiment. Specifically, a series of data on the consumer's flow line from entering to leaving the shop is collected using an eye-tracking device. From the collected traffic line data, we attempt to evaluate consumer behavior from the viewpoint of purchase purpose and loyalty by using Social Network Analysis(SNA) methods.
With the rise of the e-commerce market and the spread of COVID-19, the role of physical stores such as department stores and shopping centers have changed significantly. In contrast to the traditional model in which consu- mers recognize products through TV commercials, websites, and SNS and use physical stores as the final point of purchase, recent years have seen a shift to physical stores as a place for brand recognition and product experience. In the midst of this growing trend, concepts such as “retail entertainment” and “showrooming”have come into the limelight (Dentsu Digital Inc., 2021). Retail entertainment is a coined word that combines the words “retail” and “entertainment,” and refers to the provision of value in the form of “expe- riences that can only be obtained in that store” as a need that appeals to consumers in a physical store. This is expected to bring enjoyment and encounter, foster customer loyalty, and increase Life Time Value (XYMAX
Corporation, 2021). Showrooming refers to a style of purchasing in which a customer actually checks out a product in a physical store and then purchases it in an e-commerce store. This is expected to be beneficial for both parties: stores can reduce their inventory burden and maximize their sales floor space, and consumers do not need to take products home. In this context where the value of the experience in the actual store is important, it is necessary to improve the comfort of shopping in the store, especially in business categories where many stores are concentrated, such as department stores and shopping centers, in order to respond to the attributes and purposes of consumers and improve the value of the experience of the entire store.
Under these circumstances, studies focusing on purchasing behavior in actual stores have been conducted. Nagai et al. conducted a study on migra- tory behavior in an urban outlet mall as a target of a commercial complex (Nagai et al., 2016). They used GPS technology to examine the relation- ship between migratory behavior characteristics, such as distance traveled, range of behavior, and tendency to visit, and shopping behavior. They found that neither purchase amounts nor unplanned purchases were significantly correlated with the length of the shopping route, but that there was a signi- ficant negative correlation between the length of the route and the intention to reuse. It remains an issue to verify the specific behavioral characteristics of consumers in consideration of the shape of the mall and the relationship between stores.
Shiozaki et al. conducted a simulation of migratory behavior in two station-front commercial clusters and one shopping center, and proposed a specific store layout by analyzing factors that influence migratory behavior (Shiozaki et al., 2021). As a result, it was shown that applying the flow line theory of shopping centers, placing popular stores at the edges and gathe- ring stores of the same industry in each area are effective in promoting the circulation of customers. This is one of the few cases in which specific mar- keting measures are studied on a simulation basis based on the evaluation of migratory behavior.
Shimizu points out the necessity of considering the relationship between actual stores and consumers through a comprehensive review of flow line studies, and attempts to elucidate the factors that explain the length of flow line (Shimizu, 2020). Specifically, he conducted a flow line survey in a super- market to investigate the factors explaining flow line length by examining the influence of the relationship between consumers and stores on flow line length. The results showed that there were differences in purchase amount per visit, number of items purchased, time spent in the store, and flow line length between loyal customers and other, with loyal customers spending less money and having a shorter flow line length. This study is significant because it was the first to add the concept of the relationship between the subject store and the subjects in a traffic line survey study.
Based on these previous studies, this study compares and evaluates the migratory behavior of consumers in a large department store with multiple floors, starting with the presence or absence of a purchase purpose, and then, as an indicator of loyalty, the presence or absence of a favorite store, and exa- mines the importance of each store and the relationship between stores. Based
The Influence of Purchase Purpose and Customer Loyalty on Purchase Behavior 347
on the suggestions obtained from the analysis and discussion, we propose a specific store layout.
Experiments on Flow Line Observation In this study, we conducted the traffics line observation experiment in a large multi-story department store located in the center of Tokyo. Specifically, we conducted the experiment over three days on October 4, 5, and 8, 2022, using eye tracking devices to observe subjects’ viewpoints and extract traffic line data. The department store in which the experiment was conducted consists of 11 floors from B2F to 8F, where tenants of various categories, including fashion, general merchandise, and food stores, are gathered. Since the 7th and 8Fs are restaurant floors, they were excluded from this experiment, which focused on the subjects’ migratory behavior, and the floors from B2F to B6F were used for analysis. Table 1 shows a list of the product categories offered in the stores on the target floors.
Dataset In this study, we extracted data on subjects’ traffic line data between stores in a department store from the recorded data collected by an eye tracking device. We analyze the acquired data using a Social Network Analysis(SNA) framew- ork. SNA is a mathematical analysis of the social structure of any social unit (actor), such as an individual, company, or country (Suzuki, 2018). It is an analytical method that aims to elucidate the occurrence of social events invo- lving actors by using graphs that represent the relationships between elements by means of nodes and edges.
We created a node list representing the stores where they stayed and an edge list representing their movement lines between stores. The stores where the subjects visited are represented as a node list consisting of store IDs, store names, and store floors (Table 2).
Table 1. List of product categories.
Table available in the original PDF paper.
Product Categories
fashion women’s fashion men’s fashion shoes women’s shoes bag accessory glass hat watch innerwear lingerie socks suit kimono contact wig sundries cosmetics perfume art supplies sweets ticket event space
Table 2. Example of node list.
Table available in the original PDF paper.
Store ID Store Name Floor 1F_01 Store A 1F 1F_02 Store B 1F 1F_03 Store C 1F
348 Nakashima and Otake
The subject’s movement between stores is represented as an edge list, consi- sting of the store ID before the move (from) and the store ID at the destination (to). The number of moves is given as a weight for each from-to record that represents a move between stores (Table 3).
In this study, we conduct Social Network Analysis (SNA) using these node and edge lists.
Result and Discussion
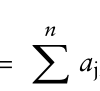
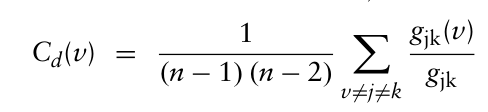
A total of 63 subjects, 32 female and 31 male, participated in the experiment, and data were collected on 38 of them. Of the 36 valid subject pairs used in the analysis, 13 were alone, 9 were female-male pairs, 8 were male-male pairs, 5 were male-female pairs, and one pair consisted of one female and two males, for a total of three participants. On the day of the experiment, we asked participants whether or not they intended to make purchases and whether or not they had a favorite store in the building. We compared the network graphs according to the presence or absence of a purchase purpose and the presence or absence of a favorite store. Specifically, we use degree centrality (Eq. 1) and betweenness centrality (Eq. 2) to reveal the differences between their respective structures (M. E. Newman, 2004), (Shinoda et al, 2008).
n X
Equation reproduced from the original PDF.
gjk(v) X
(2)
Equation reproduced from the original PDF.
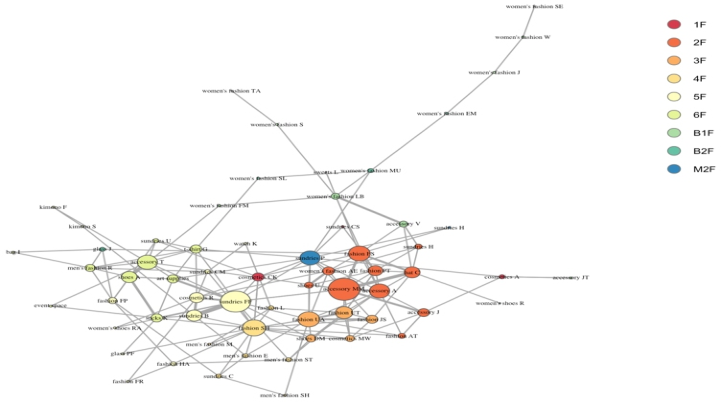
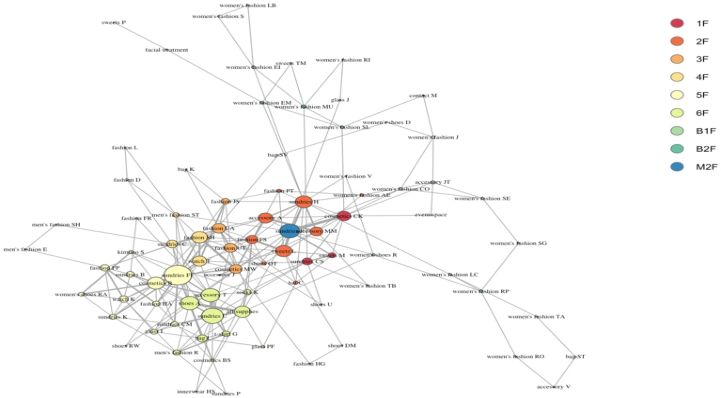
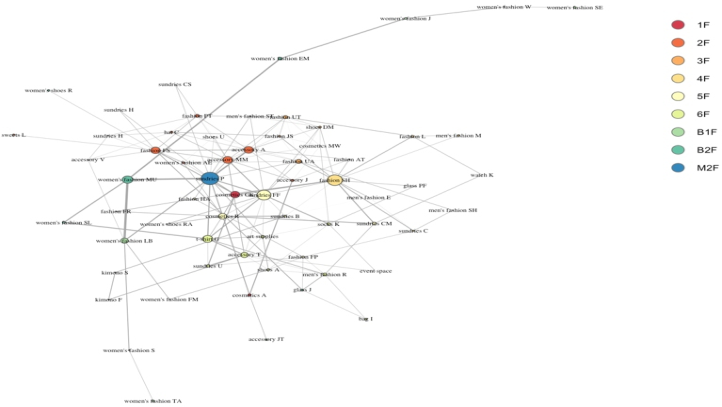
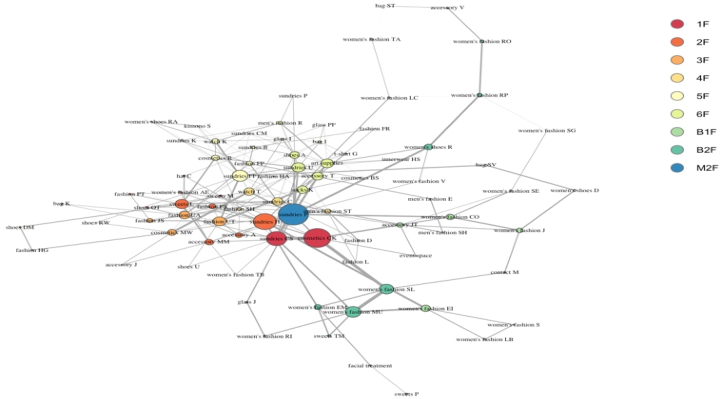
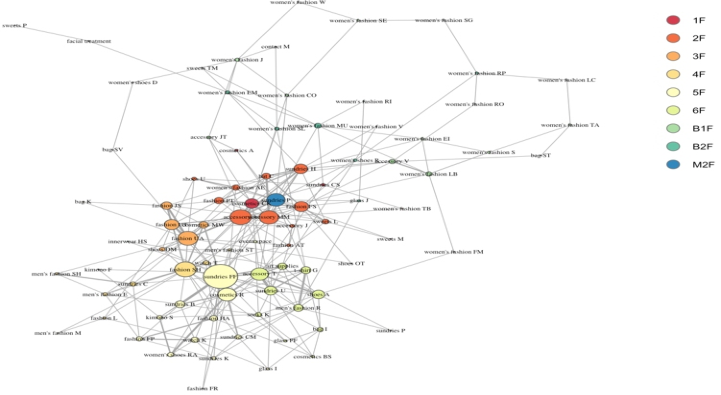
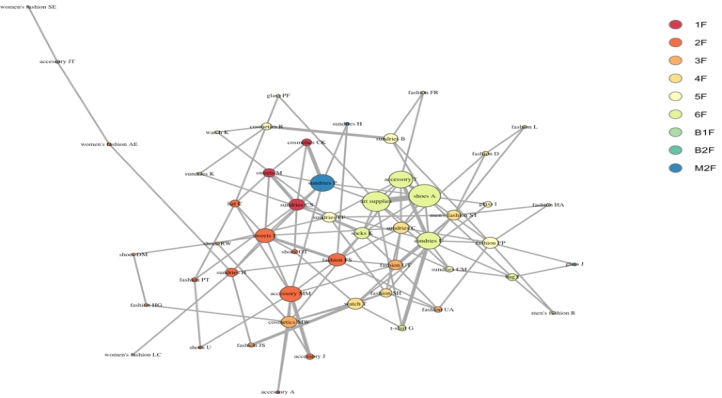
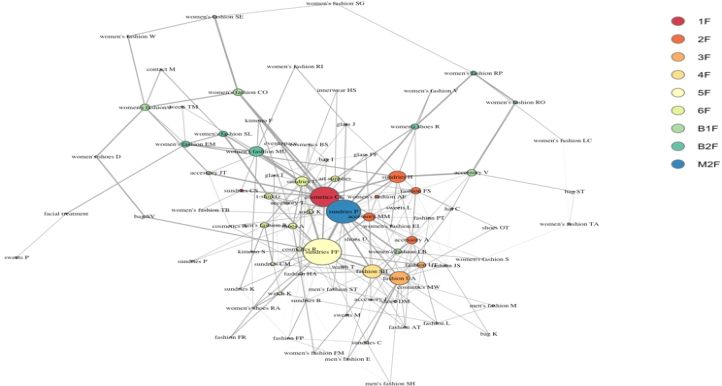
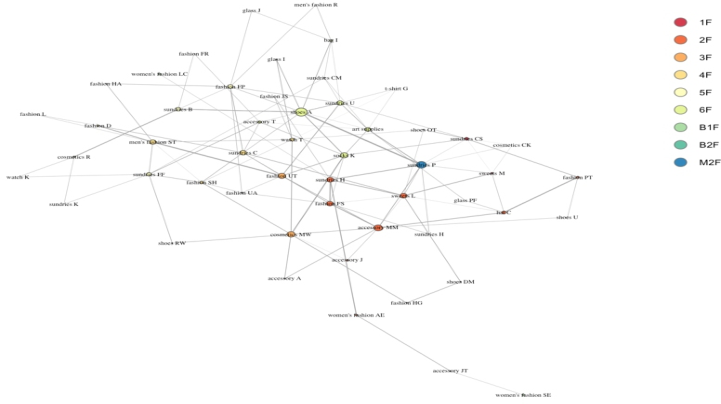
From these result, we evaluate consumers’ migratory behavior. First, we compared the network graphs by the presence or absence of a purchasing objective. A summary of the networks is shown in Table 4. We show the network graphs based on degree centrality in Figures 1 and 2, and the network graphs based on betweenness centrality in Figures 3 and 4.
From Figures 1 and 2, a network comparison of degree centrality in the presence and absence of purchasing purposes, we infer the following.
Node size with purpose is larger overall, whereas node size without purpose is smaller overall.
With a purpose, the node size is particularly large for stores on the 2F, such as accessories MM (2F, accessories) and fashion FS (2F, women’s and men’s), while without a purpose, the node size is particularly large for
Table 3. Example of edge list.
Table available in the original PDF paper.
From To Weight 1F_01 1F_02 1 1F_02 1F_03 1 1F_03 1F_04 1
The Influence of Purchase Purpose and Customer Loyalty on Purchase Behavior 349
Table 4. Overview of network graphs - whether or not the purpose of purchase.
Table available in the original PDF paper.
Group Number of subjects
Number of nodes
Average number of moves purchasing purpose 15 63 12.9 no purchasing purpose 23 84 14.6
Figure 1: Network analysis results with purchase purpose – degree centrality.Figure 2: Network analysis results with no purchasing objective – degree centrality.
stores on the 5th and 6Fs, such as sundries FF (5F, sundries) and accessories T (6F, accessories).
350 Nakashima and Otake
Figure 3: Network analysis results with purchase purpose – betweenness centrality.Figure 4: Network analysis results with no purchasing objective – betweenness centrality.
The following observations can be inferred from Figures 3 and 4 as a network comparison of betweenness centrality.
Compared to those with a purpose group, those without a purpose have larger node sizes, and stores evaluated as relay points, such as cosmetics CK (1F cosmetics) and sundries P (M2F sundries), are more prominent.
These results indicate that group with a purchase purpose tend to make more limited and concentrated trips to stores. As for the stores they visited
The Influence of Purchase Purpose and Customer Loyalty on Purchase Behavior 351
at, not only sundries stores that anyone can enjoy looking at, but also acces- sory and fashion-related stores stood out. In the graph of the group with no purchase purpose, many of the stores were evaluated as relay points, indi- cating that they were window-shopping-like shoppers with a wider range of shopping trips. Many of the respondents visited sundries stores. Many of the respondents visited at sundries stores. Table 4 shows that the number of store visits with no purchase purpose group was higher than those with purchase purpose group, which confirms these facts.
Next, we compared the network graphs by the presence or absence of a favorite store. A summary of the networks is shown in Table 5. We show the network graphs based on degree centrality in Figures 5 and 6, and the network graphs based on the betweenness centrality in Figures 7 and 8.
The following is inferred from Figures 5 and 6 as a network comparison of degree centrality in the presence/absence of favorite stores.
With favorite group, the respondents visited by sundries and accessories stores such as sundries FF (5F) and accessories A (2F), as well as fashion stores such as fashion UA (3F, women’s and men’s) and fashion SH (4F, women’s and men’s). (2F accessories), as well as fashion stores such as fashion UA (3F ladies’ and men’s) and fashion SH (4F ladies’ and men’s), while those with no favorite often visited by sundries stores.
Table 5. Overview of network graphs - whether or not the favorite store.
Table available in the original PDF paper.
Group Number of subjects
Number of nodes
Average number of moves favorite store 25 87 14.6 no favorite store 11 52 12.5
Figure 5: Network analysis results with favorite store – degree centrality.
352 Nakashima and Otake
Figure 6: Network analysis results with favorite store – degree centrality.
With favorite group visited by stores on many floors, while the without favorite group visited by stores on the 6F, such as shoes A (6F shoes) and art supplies (6F art supplies). The node sizes of the stores on the 6F were particularly large and the edge connections were thicker.
The following was inferred from Figures 7 and 8 as a comparison of the network of betweenness centrality.
Compared to those with no favorites group, those with favorites have extremely large node sizes for stores such as cosmetics CK (1F cosmetics),
Figure 7: Network analysis results with no favorite store – betweenness centrality.
The Influence of Purchase Purpose and Customer Loyalty on Purchase Behavior 353
Figure 8: Network analysis results with no favorite store – betweenness centrality.
sundries P (M2F sundries), and sundries FF (5F sundries), which are highly evaluated as relay points.
These results suggest that the group with a favorite store has a wider migratory behavior, as many of them stopped at stores that sell sundries and accessories, as well as fashion-related stores, and stores that play a role as relay points were also apparent. In contrast, the group without a favorite store tended to stop at sundries stores and to visit stores on the same floor, suggesting that they were window-shopping or passing the time. Table 5 shows that the number of trips between stores is higher for those with a pre- ferred store, suggesting that they stop at various stores and enjoy shopping while making exploratory trips around the department.
Store Layout Proposal From the network graph obtained by the analysis, focusing on the store layouts on the 2nd, 5th, and 6th floors, which were the floors with the most active migratory behavior, we observed the following characteristics.
Stores with a large sales floor area and stores with ambiguous boundaries with neighboring stores tend to have a wider frontage, making it easier for customers to visit by and stay.
Compared to other floors, many stores offer a variety of product catego- ries such as sundries, accessories, and cosmetics.
These stores also play an important role as relay points (key tenants) between stores.
Based on these results, we propose the following measures to promote migratory behavior and purchasing behavior within the building.
354 Nakashima and Otake
In particular, the B2F, which has few connections to other stores and pro- duct categories are uniform, should be arranged to serve as a relay point for sundries, accessories, cosmetics, and other stores to encourage people to visit by.
By placing sundries, accessories, and cosmetics stores on the 3F, the store can serve as a relay point for fashion-related stores where people are likely to stay.
On the 5th and 6th floors, fashion stores with a large sales floor area will be placed to take advantage of the connection from the sundries and cosmetics stores, which tend to attract customers to stay.
CONCLUSION
In this study, we conducted an experiment using an eye tracking device to observe the flow of consumers in a large department store with multiple flo- ors, in response to the increasing importance of the experience value in actual stores. Using the data obtained from experiments, we evaluated migratory behavior and proposed measures for store layouts. Visualization of migra- tory behavior by network analysis showed that consumers with a purchase purpose or with a favorite store tended to migrate to a limited number of stores. On the other hands, without a purchase purpose or without a favorite store tended to migrate to a wider area, as if they were window shopping. In addition, we proposed a store layout around key tenants that are likely to be visited to promote migratory behavior.
The migratory behavior of consumers was evaluated from the viewpoints of whether or not they have a purchase purpose and whether or not they have a favorite store. It is necessary to verify migratory behavior by assu- ming various types of consumers, taking into account their usual purchasing situations and relationships with the target stores. In our future works, we intend to clarify these issues through other experiments.
ACKNOWLEDGMENT
This work was supported by JSPS KAKENHI Grant Number 21K13385.
REFERENCES
Dentsu Digital Inc., Retail DX Survey (December 2021), https://www.dentsudigital.
co.jp/knowledge-charge/articles/2021/1203-stores#h01 M. E. Newman, (2004). Analysis of weighted networks, vol. 70, No. 5, p. 056131. Nagai, R., Onzo, N., & Ohshima, T. (2016). Shouhisha no kaimawari koudou to kanjyo: Minamimachida grandberry mall niokeru GPS chousa wo tuujite. Japan Marketing Journal, Vol. 35 No. 4, pp. 90–104. Shimizu, A. (2020). The New of Shopping Path Research, Vol. 40 No. 2, pp. 7–17. Shinoda, K., Matsuo, Y., & Nakashima, H. (2008). Network generation model
based on multiple centralities. Journal of the Japanese Society for Fuzzy Intelligent Informatics, Vol. 20, No. 3, pp. 410–422. Shiozaki, K., Asami, Y., Sadahiro, Y., & Usui, H. (2021). Analisis on the Evaluation of Shopper Circulation in Commercial Areas around Railway Stations. – Focusing
The Influence of Purchase Purpose and Customer Loyalty on Purchase Behavior 355
on Store Arrangemnt –, Journal of the Planning Institute of Japan, Vol. 56, No. 3, pp. 1152–1159. XYMAX Corporation, Commercial premises in the coronavirus era. (December 2021), https://soken.xymax.co.jp/wp-content/uploads/2021/12/2112-future _retail2_3.pdf
LISTED IN THE AHFE DIGITAL BOOKSTORE CATALOGUE
Explore the complete digital volume
Human Factors, Business Management and Society
Read this individual research paper free through the original publisher, or explore the full digital proceedings book.
ISBN 978-1-958651-73-5
Explore this ISBN in the AHFE Bookstore ↗Listed in the July 2026 bookstore catalogue; search by ISBN to confirm current availability · Digital book purchase optional