Catalina Astudillo-Rodriguez, Juan Calle, Esteban Crespo-Martínez, Gabriela Chica-Contreras, Julio Mosquera (2023). Controlled experimentation to improve the usability of business management systems: UDA-ERP case. In: Usability and User Experience. AHFE Open Access, vol. 110, pp. 144–157. https://doi.org/10.54941/ahfe1003186
An ERP enterprise resource planning system is software that allows managing the tasks involving an organisation’s processes. Usability within this system plays a vital role in users’ performance, facilitating interaction in an enterprise resource planning (ERP) system and boosting performance in terms of efficiency and effectiveness, which is why it is essential to perform usability tests. The UDA-ERP software developed by the Universidad del Azuay is a business management system whose objective is to improve the production processes of manufacturing companies in the MIPYME sector in Cuenca, Ecuador. This motivated us to evaluate the degree of user perception of the system’s usability. The present work evaluates the usability of the UDA-ERP software by applying a controlled experiment based on the Wholin methodology. This experiment was used for five experimental groups, including experienced users and users without experience in these systems. Controlled experimentation evaluated the performance of the selected study subjects regarding task completion time and completed tasks. This way, a comparison of the results was obtained, contrasting the results between the different experimental groups. The results show that each group completes the tasks with short time differences; In terms of usability, the UDA-ERP software is correct and does not require modification. In conclusion, usability is a relevant feature to consider in an enterprise resource planning system; hence, it is recommended to apply usability evaluations with some frequency.
Several studies refer to the use of Enterprise Resource Planning Systems (ERP) and their impact on organisations (Xu, Ou and Fan, 2017). An ERP is a software tool that offers an integrated solution to organisations; it is a plat- form that unites all the geographically dispersed departments and units of the company to improve their efficiency and optimise their processes (Singh and Wesson, 2009). By integrating information and business processes, ERP systems provide significant value to organisations; their ability to optimise business resources is essential to guarantee the success and competitiveness
Controlled Experimentation to Improve the Usability of Business Management Systems 145
of any organisation (Subba Rao, 2000). The successful adoption of ERP systems in organisations requires a deep understanding by the users who manage them; with a proper understanding, it is easier to take full advan- tage of the capabilities of these systems and achieve optimal performance (Astudillo, Maldonado and Crespo, 2020). Due to the complexity of this type of system, its use can make it difficult for end users, causing an adverse effect than desired (Yassien et al., 2017). Therefore, it is essential to know the user’s perspective when using ERP systems, where usability plays an impor- tant role. According to Koohang (2004), usability measures the ability of a product to allow the user to achieve their established objectives. In terms of functionality, it offers the necessary features for efficient and effective use by a particular group of users. Ease refers to a specific level of subjective evalu- ation, while effectiveness refers to a particular level of human performance (Shackel, 2009).
Regarding usability in ERP systems, this factor has become a subject of study in recent years due to the complexity of these systems. Although usability problems do not directly cause large-scale errors within organisa- tions, they can interfere with an individual’s or workgroup’s productivity, making it difficult to achieve objectives with the desired efficiency and effe- ctiveness (Topi, Lucas and Babaian, 2005). This study originated from the importance of usability and its direct relationship with the complexity of ERP systems. For this, the main objective is to identify possible difficulties that users may experience when using critical processes in the UDA softw- are modules. -ERP was developed as a research and linkage project by the University of Azuay. For this, the researchers applied an empirical method of controlled experimentation to validate the technological tools and pro- pose possible improvements. It should be noted that experimentation is an essential part of the research process in software engineering. Since it allows for validating hypotheses and obtaining precise and objective information on how software systems behave in different situations Genero, Cruz and Piattini (2015), experimentation has proven to be effective in providing information and expanding the domain of knowledge about the software product being evaluated (Basili, 1996).
This research aims to evaluate the user experience and collect feedback to improve the usability of the UDA-ERP software to facilitate end-user inte- raction and increase its effectiveness. An empirical method of controlled experimentation was used to achieve this goal. As a result, aspects were iden- tified that must be considered for future software improvements and can be generalised to other ERP systems. The main recommendation is to carry out periodic evaluations to maintain a continuous update and optimisation of the system. For future research, it is proposed to carry out a long-term follow-up and compare the results with the initial feedback. This document is orga- nised as follows: the second section presents the related works; the third section details the design of the experiment based on Wohlin’s methodology; and finally, the results obtained in each group identified for the experiment are reported.
RELATED WORK
Usability within ERP systems has become a study objective in recent years due to the significant impact that usability has on the quality of ERP software and its main sub-attributes, which are: (1) accessibility, (2) understandability, (3) complexity, (4) learnability, (5) operability, (6) user interface aesthetics, and (7) protection against user error (Alanazi et al., 2019; Peters and Aggrey, 2020). Asif, AlFrraj and Alshamari (2022) developed a checklist to iden- tify usability problems in ERP using the Dirichlet Latent Assignment (LDA) theme modelling technique, they present six themes related to usability pro- blems, and that can be generalised for different ERP systems; as a result of the research, the authors provide a detailed list of usability problems in ERP and recommendations to avoid them based on Nielsen’s ten heuristics, Schneiderman’s eight golden rules and usability principles. Choma, Zaina and da Silva (2016) apply an experimental study to inspect five applicati- ons using heuristic evaluation in the evaluation phase. On the other side, Mittelstädt et al. (2015) carried out a multifactorial experiment in which they examined the adverse effects produced by the complexity and presen- tation of the information, amount of data and complexity of the task in the users of ERP systems, considering the graphical interface as a critical aspect of the usability of these systems. In their job, Nugra, Wiyarta and Kurniawan (2018) evaluate the inventory management module of an enterprise planning system (ERP) through an experiment based on a case study; the objective of the investigation is to ensure that the system options work and are used appropriately, and meet the user’s expectations to improve the company’s productivity and efficiency.
For the design of this experiment, we applied the proposal of (Wohlin et al., 2012), the same one that deals with a rigorous and systematic methodo- logy to carry out experiments in the field of software engineering, which allows obtaining reliable and justified results for decision-making. Woh- lin’s method focuses on four stages: (1) scope definition, (2) planning, (3) design, execution, and (4) analysis and interpretation of results. This meth- odology is designed to help researchers and developers assess the impact of different variables and factors on the performance and effectiveness of software systems. The objective of this study was to “Analyse the usabi- lity in the aspects of efficiency and effectiveness of the UDA-ERP system by applying surveys to identify possible difficulties concerning the graph- ical user interface of processes called critical from the point of view of potential users in the context of teachers and students at the University of Azuay”. The experiment was developed in the facilities of the University of Azuay.
DESIGN OF THE EXPERIMENTS Experiment Definition and Context
For the selection of the context, the four dimensions proposed by Wohlin et al. (2012); In this way, the context of the experiment was defined as online software implemented in an actual situation in SMEs in the city of
Controlled Experimentation to Improve the Usability of Business Management Systems 147
Table 1. Independent variable and tasks to be carried out in the experimentation.
Table available in the original PDF paper.
Module Task 1 Task 2 Accounting Create a financial account Create a financial transaction Inventories Create an inventory product Create an inventory transaction Purchasing Create a new supplier Register a purchase invoice Sales Create a new customer Register a sales invoice Production Create a new product structure
Cuenca-Ecuador. The participants were students of the accounting and audi- ting career of the University of Azuay, expert teaching staff in the accounting area who work at the University of Azuay, and staff who work in SMEs where the software is in operation. Finally, the experiment refers to a specific context since it focuses on evaluating the usability of the UDA-ERP softw- are. Table 1 details the nine tasks selected for the experiment taken from the UDA-ERP software.
The experiment is applied to five groups of subjects classified as follows: (1) Group 1: formed by 22 students from the Faculty of Administration Sciences of the University of Azuay, of which 5 belong to the first cycle of the Accounting I subject, and the remaining 17 belong to the second cycle of the Accounting II subject. The subjects were selected by applying the convenie- nce method, including all students enrolled in the Accounting I and II subjects of the March-July 2022 academic period. This group previously interacted with the application. (2) Group 2: comprises 36 students from the Faculty of Administration Sciences of the University of Azuay in the subject of Cost Management for the academic period September-February 2023. This group had no previous experience with the application. (3) Group 3: formed by 10 students from the Faculty of Administration Sciences in the seventh seme- ster of the Higher Accounting career at the University of Azuay. The subjects that make up the third experimental group were selected for convenience. The selection criteria were passing more than 50% of the degree and carrying out pre-professional practices in business environments in Cuenca-Ecuador. This group had previous contact with the application. (4) Group 4: consisting of 4 professors from the Faculty of Administration Sciences of the University of Azuay, considered experts in business management. The fourth experimental group was selected for convenience. This group had no previous contact with the application; and (5) Group 5: formed by personnel who work in MSMEs in the city of Cuenca-Ecuador and who currently use the UDA-ERP software to develop their activities. These personnel have been selected for convenience seeking feedback from users who have already used the UDA-ERP software for a considerable period.
Design Election and Instrumentation The design contemplates a total of 9 treatments evaluated to obtain the expe- rimentation results. A balanced intra-subjects design is chosen, where each treatment is assigned to all the subjects of the experimental groups. That is, all the subjects must perform the same tasks. The choice of the within-subjects
design allows us to compare the level of usability of the UDA-ERP software in the different groups for which it has been designed. In this way, it is pos- sible to contrast the level of perception of previously trained beginner users, beginner users without training, users with an educational level that allows them to use the software without training, expert users without training and expert users with prior training. Study subjects are selected for convenience to contrast the experience of new users in business management systems with users considered experts.
For the execution of each task, the technical sheet was prepared in printed format to be delivered to each subject, detailing the steps to follow. Each subject is provided with personalised information for entering the appli- cation, indicating that the time to complete all the tasks is 120 minutes. Also, two questionnaires, the pre-experiment questionnaire and the post- experiment questionnaire, were designed. The first collected demographic information from users such as gender, age range, and educational level of individuals. Likewise, the user’s perspective is obtained regarding their kno- wledge in the field of information technology, the type of software they use, the time, and the use of technological tools in their daily actions rea- son. Finally, information technologies addressed to business management, experience with business software, and the productive and economic sector where they have been used is addressed. The second questionnaire applies the Usability Scale System, its acronym in English SUS (Nafianto, Puspitasari and Saputra, 2019), which includes ten questions that evaluate the experience regarding usability users.
Experimentation Performing The second questionnaire applies the SUS, which includes ten questions that evaluate users’ experience in terms of usability. Due to availability, the expe- rimentation was carried out on different days and in other spaces at that moment. The first experimental group experimented on the computers of one of the computer laboratories of the University of Azuay, while the second experimental group used their personal computers in one of the classrooms of the same institution. The experiment is supervised by the teacher of the Accounting I and II subjects, two experimenters and a technical expert in the UDA-ERP software. The study subjects are divided into two subgroups according to the subject they are studying at the time of the experiment. On the other hand, in the experimentation of the third and fourth experimen- tal groups, each subject was developed individually in a classroom at the University of Azuay, accompanied by an experimenter. Finally, the fifth expe- rimental group, which corresponds to personnel of the SMEs of the city of Cuenca-Ecuador, was carried out in each of the facilities of each participating company.
All groups follow the steps defined in the preparation of the experiment, which is summarised in the following activities: (1) General indications were exposed, providing the necessary links to complete the experiment: i) link to the pre-experiment questionnaire, ii) link to the UDA-ERP software web- site and iii) link to the post-experiment questionnaire; (2) The study subjects
Controlled Experimentation to Improve the Usability of Business Management Systems 149
were asked to answer the pre-experiment questionnaire; (3) The printed expe- riment was handed out on sheets of paper to each of the participants. At this point, the importance of completing the start time and end time of each task is indicated. In the end, the subjects handed over the material to the experi- menters; and (4) the study subjects were asked to answer the post-experiment questionnaire.
Hypothesis Formulation H0 = There is difference between the time to perform tasks in UDA-ERP software by groups with and without previous interaction with it. H1 = There is no difference between the time to perform tasks in UDA-ERP software by groups with and without previous interaction with it.
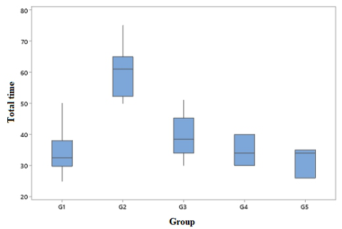
ANALYSIS AND DISCUSSION OF THE RESULTS Total time used to understand the activities: Figure 1 shows the distribu- tion of the times used to complete all the activities within each group. To compare whether the times used by each group are statistically different, a one-way ANOVA test was performed where the p-value obtained was 0.000, indicating that at least one of the groups presented different times (adju- sted Rˆ2 = 73%). A Tukey test was performed to determine the group or groups with different times (see Table 2). The grouping by the Tukey method (Table 2) indicates that the values of the means that do not share the same letter are different, in this case, group 2.
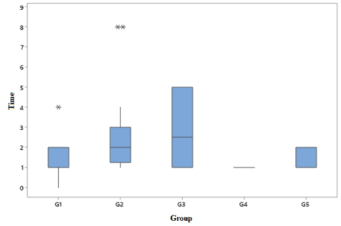
Time used to create a financial account: Figure 2 shows the distribution of the times used to create an accounting account within each group. To com- pare whether the times used by each group are statistically equal, an ANOVA
Figure 1: Boxplot of the total time of each group.Table 2. Grouping by the tukey method.
Table available in the original PDF paper.
Group N Mean Cluster G2 20 59,85 A G3 10 39,80 B G4 3 34,67 B G1 22 34,41 B G5 3 31,67 B
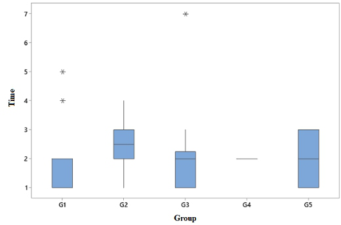
Figure 2: Boxplot of time to create a financial account.
test of a factor was performed where the p-value obtained was 0.039, indi- cating that at least one of the groups presented different times. However, due to the lack of dispersion in group 4, the ANOVA result is not very adequ- ate. A Tukey test was performed (see Table 3) to contrast these results, which indicated that there is no difference between the groups.
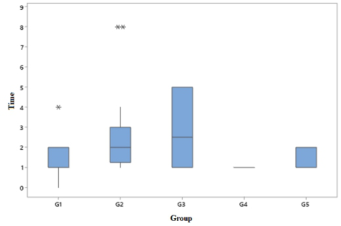
Time used to create a financial account: Figure 3 shows the distribution of the times used to create an accounting entry within each group. To compare whether the times used by each group are statistically different, an ANOVA test of one factor was performed where the p-value obtained was 0.000, indicating that at least one of the groups presented different times (adju- sted Rˆ2 = 39%). A Tukey test was performed (see Table 4) to determine the group or groups at different times.
Table 3. Grouping by the tukey method for the creation of a financial account.
Table available in the original PDF paper.
Group N Mean Cluster G3 10 2,880 A G2 20 2,700 A G5 3 1,667 A G1 22 1,500 A G4 3 1,000 A
Figure 3: Boxplot of time to create a financial transaction.
Controlled Experimentation to Improve the Usability of Business Management Systems 151
Table 4. Grouping by the tukey method for the creation of a financial transaction.
Table available in the original PDF paper.
Group N Mean Cluster G3 10 2,880 A G2 20 2,700 A G5 3 1,667 A G1 22 1,500 A G4 3 1,000 A
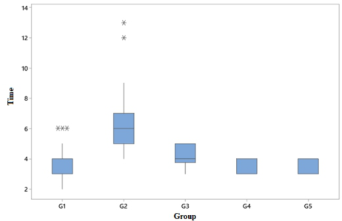
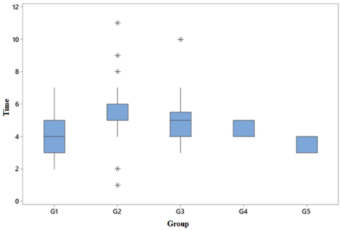
Time used to create a product: Figure 4 shows the distribution of the times used to create an item within each group. To compare whether the times used by each group are statistically different, an ANOVA test of one factor was performed where the p-value obtained was 0.000, indicating that at least one of the groups presented different times (adjusted Rˆ2 = 40%). A Tukey test was performed to determine the group or groups with different times (see Table 5).
Time used to create an inventory transaction: Figure 5 shows the distribu- tion of the times used to create a warehouse movement within each group. To compare whether the times used by each group are statistically different, a one-factor ANOVA test was performed where the p-value obtained was 0.27, indicating that all groups used similar times, also evidenced in the Tukey test (see Table 6).
Time used to create a new supplier: Figure 6 shows the distribution of the times used to create a new provider within each group. To compare whether the times used by each group are statistically different, an ANOVA test of one
Figure 4: Boxplot of time to create a n accounting entry.Table 5. Grouping by the tukey method for the creation of an item.
Table available in the original PDF paper.
Group N Mean Cluster G2 20 6,550 A G3 10 4,100 B G4 3 3,667 A B G1 22 3,455 B G5 3 3,333 B
Figure 5: Boxplot of time to create an inventory transaction.Table 6. Grouping by the tukey method for the creation of an inventory transaction.
Table available in the original PDF paper.
Group N Mean Cluster G2 20 2,550 A G3 10 2,200 B G5 3 2,000 A B G4 3 2,000 B G5 22 1,681 B
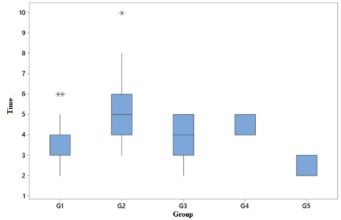
Figure 6: Boxplot of time to create a new supplier.
factor was performed where the p-value obtained was 0.000, indicating that at least one of the groups presented different times (adjusted Rˆ2 = 28%). A Tukey test was performed (see Table 7) to determine the group or groups at different times.
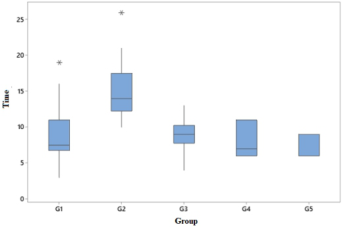
Time used to register a purchase invoice: Figure 7 shows the distribution of the times used to register a purchase within each group. To compare whether the times used by each group are statistically different, an ANOVA test of one factor was performed where the p-value obtained was 0.000, indicating that at least one of the groups presented different times (adjusted Rˆ2 = 42%). A Tukey test was performed to determine the group or groups with different times (see Table 8).
Time used to enter a customer: Figure 8 shows the distribution of the times used to enter a customer. To compare whether the times used by each group are statistically different, an ANOVA test of one factor was performed where
Controlled Experimentation to Improve the Usability of Business Management Systems 153
Table 7. Grouping by the tukey method for the creation of a supplier.
Table available in the original PDF paper.
Group N Mean Cluster G2 20 5,450 A G4 3 4,667 A B G3 10 4,000 A B G1 22 3,636 B G5 3 2,333 B
Figure 7: Boxplot of time to record a purchase invoice.Table 8. Grouping by the tukey method to record a purchase invoice.
Table available in the original PDF paper.
Group N Mean Cluster G2 20 15,250 A G3 10 8,900 B G1 22 8,818 B G5 3 8,00 B G4 3 8,00 B
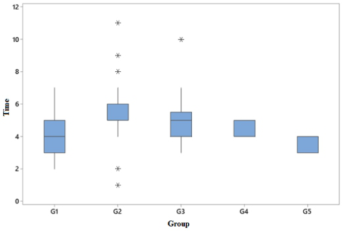
Figure 8: Boxplot of the time to enter a customer.
the p-value obtained was 0.026, indicating that at least one of the groups presented different times (adjusted Rˆ2 = 14%). A Tukey test was performed to determine the group or groups with different times (see Table 9).
Figure 9: Boxplot of the time to enter a customer.
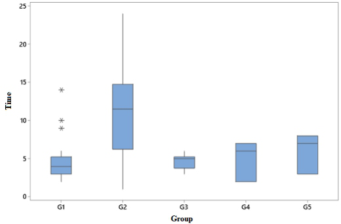
Time used to register a sale invoice: Figure 9 shows the distribution of the times used to enter a sale. To compare whether the times used by each group are statistically different, an ANOVA test of one factor was performed where the p-value obtained was 0.000, indicating that at least one of the groups presented different times (adjusted Rˆ2 = 35%). A Tukey test was performed (see Table 10) to determine the group or groups with different times.
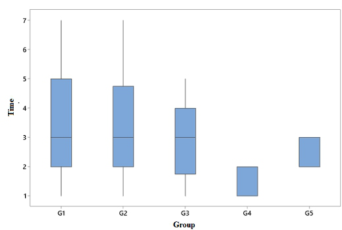
Time used to carry out the product structure: Figure 10 shows the distri- bution of the times used to carry out the structure of an item. To compare whether the times used by each group are statistically different, a one-factor ANOVA test was performed where the p-value obtained was 0.285, indica- ting that all groups used similar times, also evidenced in the Tukey test (see Table 11).
Table 9. Grouping by the Tukey method for the entry of a customer.
Table available in the original PDF paper.
Group N Mean Cluster G2 20 5,750 A G3 10 5,300 A B G4 3 4,667 A B G1 22 4,091 B G5 3 3,333 A B
Figure 10: Boxplot of time to enter a sales invoice.
Controlled Experimentation to Improve the Usability of Business Management Systems 155
Table 10. Grouping by the tukey method for the income of a sales invoice.
Table available in the original PDF paper.
Group N Mean Cluster G2 20 11,45 A G5 3 6,00 A B G4 3 5,00 A B G1 22 4,727 B G3 10 4,600 B
Figure 11: Boxplot of the time to realise the product structure.Table 11. Grouping by the tukey method to realize the product structure.
Table available in the original PDF paper.
Group N Mean Cluster G1 22 3,455 A G2 20 3,450 A G3 10 2,800 A G5 3 2,333 A G4 3 1,667 A
Table 12. Porcentaje de individuos que indicaron que el software no necesita cambios.
Table available in the original PDF paper.
Group Tag semantics Letter size Colour use G1 98.50% 99.50% 95.50% G2 92.25% 92.80% 85.00% G3 100.00% 91.12% 96.70% G4 100.00% 85.20% 100.00% G5 100.00% 100.00% 100.00%
Analysis of Recommendations by Categories
Table 11 shows the percentage of individuals who indicated that the software is correct and does not require any modification.
CONCLUSION
In this article, we present the results of a controlled experiment applied to five groups of subjects. Two groups had prior interaction with the application, and the remaining three were unaware of it; however, all of them were able to complete the requested tasks with a minimal time difference. Likewise, a high percentage of participants indicates that the software does not need changes in its interface; therefore, we conclude that the UDA-ERP software meets the usability criteria necessary to be used by different users. Responding to hypothesis H1, we asserted there is no difference between the time to perform tasks in UDA-ERP software by groups with and without previous interaction.
We recommended that usability is a relevant feature to consider in an enter- prise resource planning system; hence, it is recommended to apply usability evaluations with some frequency.
REFERENCES
Alanazi, S. T. et al. (2019) ‘Enterprise Resource Planning Quality Model ERPQM’, in 2019 First International Conference of Intelligent Computing and Engine- ering (ICOICE). 2019 First International Conference of Intelligent Computing and Engineering (ICOICE), Hadhramout, Yemen: IEEE, pp. 1–5. Available at: https://doi.org/10.1109/ICOICE48418.2019.9035168. Asif, A., AlFrraj, D. and Alshamari, M. A. (2022) ‘A Comprehensive Approach of
Exploring Usability Problems in Enterprise Resource Planning Systems’, Applied Sciences, 12(5), p. 2293. Available at: https://doi.org/10.3390/app12052293. Astudillo, C.V., Maldonado, J.M. and Crespo, P.E. (2020) ‘UDA-ERP: Theory, Development and Conflicts’, in J. I. Kantola and S. Nazir (eds) Advances in Human Factors, Business Management and Leadership. Cham: Springer International Publishing (Advances in Intelligent Systems and Computing), pp. 45–57. Available at: https://doi.org/10.1007/978-3-030-20154-8_5. Basili, V. R. (1996) ‘The Role of Experimentation in Software Engineering: Past,
Current, and Future’, p. 8. Choma, J., Zaina, L. A. M. and da Silva, T. S. (2016) ‘Working beyond technical aspects: an approach for driving the usability inspection adding the perspective of user experience’, in Proceedings of the 34th ACM International Conference on the Design of Communication. SIGDOC ‘16: The 34th ACM International Con- ference on the Design of Communication, Silver Spring MD USA: ACM, pp. 1–10. Available at: https://doi.org/10.1145/2987592.2987607. Genero, M., Cruz, J. and Piattini, M. (2015) Métodos de investigación en ingenieria
del software. Primera. Bogotá: Ediciones de la U. Koohang, A. (2004) ‘Expanding the Concept of Usability’, Informing Science: The International Journal of an Emerging Transdiscipline, 7, pp. 0129–0141. Available at: https://doi.org/10.28945/508. Mittelstädt, V. et al. (2015) ‘On the Visual Design of ERP Systems The – Role of Infor-
mation Complexity, Presentation and Human Factors’, Procedia Manufacturing, 3, pp. 448–455. Available at: https://doi.org/10.1016/j.promfg.2015.07.207. Nafianto, C., Puspitasari, W. and Saputra, M. (2019) ‘Development of Flexible Production Scheduling by Applying Gantt Charts In Manufacturing Module Open Source ERP (Case Study CV. XYZ)’, in 2019 International Conference on Sustainable Engineering and Creative Computing (ICSECC).
Controlled Experimentation to Improve the Usability of Business Management Systems 157
2019 International Conference on Sustainable Engineering and Creative Com- puting (ICSECC), Bandung, Indonesia: IEEE, pp. 182–185. Available at: https://doi.org/10.1109/ICSECC.2019.8907025. Nugra, J., Wiyarta, M. and Kurniawan, Y. (2018) ‘The Evaluation of Inventory Management Module of Enterprise Resource Planning System (A Case Study Approach)’, in Proceedings of the 2018 International Conference on Internet and e-Business - ICIEB ‘18. the 2018 International Conference, Singapore, Singapore: ACM Press, pp. 79–83. Available at: https://doi.org/10.1145/3230348.3230359. Peters, E. and Aggrey, G. K. (2020) ‘An ISO 25010 Based Quality Model for ERP
Systems’, 5(2), p. 6. Shackel, B. (2009) ‘Usability – Context, framework, definition, design and evaluation’, Interacting with Computers, 21(5–6), pp. 339–346. Available at: https://doi.org/10.1016/j.intcom.2009.04.007. Singh, A. and Wesson, J. (2009) ‘Improving The Usability Of ERP Systems Through
The Application Of Adaptative User Interfaces’, p. 7. Subba Rao, S. (2000) ‘Enterprise resource planning: business needs and technologies’, Industrial Management & Data Systems, 100(2), pp. 81–88. Available at: https://doi.org/10.1108/02635570010286078. Topi, H., Lucas, W. and Babaian, T. (2005) ‘Identifying Usability Issues With An ERP
Implementation’, p. 6. Wohlin, C. et al. (2012) Experimentation in Software Engineering. Berlin, Heidelberg: Springer Berlin Heidelberg. Available at: https://doi.org/10.1007/978-3-642- 29044-2. Xu, W., Ou, P. and Fan, W. (2017) ‘Antecedents of ERP assimilation and its impact
on ERP value: A TOE-based model and empirical test’, Information Systems Fron- tiers, 19(1), pp. 13–30. Available at: https://doi.org/10.1007/s10796-015-9583-0. Yassien, E. et al. (2017) ‘The Impact of ERP System’s Usability on Enterprise Resource Planning Project Implementation Success via the Mediating Role of User Satisfaction’, Journal of Management Research, 9(3), p. 49. Available at: https://doi.org/10.5296/jmr.v9i3.11186.
LISTED IN THE AHFE DIGITAL BOOKSTORE CATALOGUE
Explore the complete digital volume
Usability and User Experience
Read this individual research paper free through the original publisher, or explore the full digital proceedings book.
ISBN 978-1-958651-86-5
Explore this ISBN in the AHFE Bookstore ↗Listed in the July 2026 bookstore catalogue; search by ISBN to confirm current availability · Digital book purchase optional