Tiantian Liu (2023). Assessment of visual discomfort during watching 3D and 2D televisions using electroencephalography analysis. In: Human-Centered Design and User Experience. AHFE Open Access, vol. 114, pp. 752–761. https://doi.org/10.54941/ahfe1004460
Three-dimensional (3D) television (TV) is becoming more popular and used for entertainment than the conventional two-dimensional (2D) TV. This study conducted to examine the effect of 3D TV watching on the subjective visual fatigue and EEG data. Thirty male healthy participants (aged 31.4 + 7.1) recruited from the community. We conducted pre- and post- EEG signal collection on participants who watched the same 2D/3D movie content. Additionally, we administered a subjective visual fatigue questionnaire to the participants following the viewing task. The two-way ANOVA was used to verify significant interaction effects of 2D and 3D on before and after watching. A paired-samples t-test was performed for the mean values of subjective questionnaires results to identify significant differences between after watching 2D and 3D movie. Compared with watching 2D TV, 3D TV viewing will cause more fatigue and discomfort. A new evaluation model for 3DTV with beta waveband parameters in seven regions was established, according to the result from EEG data analysis.
Three-dimensional (3D) television (TV) has been increasingly used over the last decades. Research predicts that 3D TV will become more popular used for entertainment than the conventional two-dimensional (2D) TV (Pastoor, 1991). People have become accustomed watching from the plain (2D) image to the more vivid 3D images presented in 3D TVs. The artificial stereoscopic 3D images were projected on a 3D TV to provide people with 3D image experiences that are projected on a flat screen to each eye (Kim et al., 2013). These artificial 3D images are different from the real 3D objects and tradi- tional 2D images, in which our eyes require extensive adaptation and efforts to these artificial 3D images (Yue and Wang, 2019). For this reason, the 3D TV is susceptible to more harmful effects such as visual discomfort than 2D TV (Kim et al., 2013).
The adverse impacts of watching 3D TV have received limited attention in research. Few studies have addressed the association between extended 3D TV viewing and symptoms such as visual fatigue, dizziness, and nausea (Lambooij et al., 2009). The harmful effects may also be detrimental to brain function such as visual image processing, as eyes often interact with cerebral
Assessment of Visual Discomfort During Watching 3D and 2D Televisions 753
cortex and visual cortex that reflect the degree of visual and mental fatigues (e.g., slower choice reaction time) (Jeong et al., 2015). Studying brain activity are thought to be effective to assess mental fatigue and establish objective assessments to understand the underlying mechanism of 3D TV watching.
Visual fatigues are multi-faceted, as it related to alterations in visual func- tions included accommodative and vergence responses, pupillary dynamics, accommodative convergence to accommodation ratio, fusion reserves, visual and stereo acuity, and heterophoria (Blehm et al., 2005). Optometric tech- niques have been applied to determine the amount of change of visual fatigue before and after viewing stereoscopic contents (Emoto et al., 2005; Yano et al., 2002, 2004). These optometric techniques can only be applicable to clinical diagnose of human eyes. However, due to the lack of the sophisti- cated equipment and large laboratory space required, the simple and effective clinical tests are needed to diagnose the degree of visual fatigue. Typically, subjective questionnaires are widely accepted to evaluate the subjective com- fort on stereoscopic/monoscopic contents (Emoto et al., 2005; Speranza et al., 2006; Kooi and Toet, 2004). To develop a valid questionnaire for the degree of visual discomfort related to viewing stereoscopic contents, opinions and feedback from clinical and eye care professionals and end-users are required (Emoto et al., 2004). Sheedy et al. (2003) created a survey to assess the sever- ity of asthenopia, yet it did not specifically target stereoscopic displays or related content (Sheedy and Engle, 2002). Therefore, developing a question- naire specific to stereoscopic displays would be helpful to understanding the effect of stereoscopic contents on visual fatigue.
While subjective perception of visual fatigue is directly related to human mental fatigue, the electroencephalogram (EEG) is considered to be the most significant and reliable physiological signal/indicator to quantify mental and visual fatigues. Earlier research has shown that the four primary brain- waves of EEG signals, specifically alpha (α), beta (β), theta (θ), and delta (δ), are closely linked to brain activity. These studies have indicated that the energy of brain waves fluctuates in accordance with the level of fatigue (Stikic et al., 2014). Belyvin and Wright (1987) demonstrated that increased delta and theta activities, along with decreased beta activity, were linked to mental fatigue (Belyavin and Wright, 1987). Emoto et al. utilized EEG to assess the evoked potentials linked to sensory stimulation of the visual field (Emoto et al., 2005). Given that these evoked cortical potentials reflect the fatigue of the interconnected extraocular muscles, intraocular muscles, and central nerve of the brain, the delays in visual signal transmission measured with EEG seem to be a plausible indicator for visual fatigue (Fan et al., 2015). Other research also applied EEG signals, eye blinking rate, facial temperature, and subjective evaluation score to assess the visual fatigue before and after watching a 3D related content (Bang et al., 2014). They found that watching 3D movies on 3D display screen caused visual fatigue for its higher blink- ing rate and facial temperature. However, other research found that 3D TV watching is suggested as safe as 2D TV watching as indicated by the similar neurophysiological responses and cognitive functioning (Jeong et al., 2015).
To date, it is questionable if there are any differences between watching 3D and 2D movie contents and if there is any evaluation indicator that could objectively assess visual fatigues when watching 3D movie content. Hence,
754 Liu
this study was to examine the effect of 3D TV watching on the subjective visual fatigue and EEG data. We hypothesized that more visual fatigue would be related to watching 3D TV contents than 2D TV contents. We also built a regression model to estimate the visual fatigue level of a subject. The findings of this study can provide insightful information to help establishing testing standards, designing of 3D products (TV contents and TV products) and promoting visual health of 3D consumers.
MATERIALS AND METHODS
Participants Thirty male healthy participants (aged 31.4 + 7.1) were recruited from the community. All participants had normal stereoscopic sensitivity, which confirmed with the standard stereoscopic functional screening test (ITU-R BT.2021, Subjective assessment of stereoscopic 3D TV contents) (Kroupi et al., 2016). The participants provided their written consent with relevant test procedures and possible adverse symptoms prior to the participation. Participants were instructed to abstain from the consumption of alcohol, caffeine-containing substances, and smoking for a period of 24 hours preced- ing the commencement of the study (Fan et al., 2015). To avoid the effects of hypoglycemia on EEG signal, snacks should be prepared for participants to eat 40-min before viewing (Jaušovec and Jaušovec, 2000).
This study was approved by the institutional ethics committee.
Testing Procedures All the experiment in the same laboratory, in which the room temperature and humidity were control at 26.5±1.0 degree and 40-60% (Fan et al., 2015). Participants were instructed to sit comfortably on the single-seat chair which was 3.5 meter away from the TV conditions (3D TV and 2D TV) (Figure 1) (Jaušovec and Jaušovec, 2000). A NeuroScan 64 channel system (SynAmps, USA) with the international 10–20 lead system was used to record the EEG signal be-fore and after the movie watching. The raw EEG signal was amplified by a Syn-amps2/RT amplifier and converted from analog to digital (A/D) to the computer. The EEG signal was characterized across eight brain regions (with electrodes), including the pre-frontal (Fp), inferior frontal (If), frontal (F), temporal (T), central (C), posterior temporal (Pt), parietal (P), and occipital (O) lobes. In addition, Electro-oculography (EOG) channels were recorded to filter out eye-blink artifacts from the raw signals. An average mas- toid reference (M1 and M2) was computed offline and then subtracted from all brain channels to isolate the genuine brain signals (Fan et al., 2015). In order to acquire a reliable EEG signal, the impedance of the chosen channels was reduced to below 5k. The signals were sampled at 500 Hz and filtered using a band-pass filter ranging from 0.05 to 200 Hz (Jung et al., 1997).
Before watching TV, EEG signals were recorded for 5-min in an eye- closed condition. During the recording, the participants were instructed to relax and minimize un-necessary body movements. All body movements including eye blinking, nodding and body movements were recorded with a video (Panasonic HC-V180, Panasonic Corporation, Japan). We turned off the lighting when participant was watching movie con-tents to prevent
Assessment of Visual Discomfort During Watching 3D and 2D Televisions 755
any interference from the background. For each movie session (3D or 2D TV), participants were then watched the same movie content for 45-min. The movie entitled “As The Light Goes Out”(Emperor Entertainment Group Limited, Mandarin, 2014) and was displayed on a 42 inch LED full HD TV (Type 42LW5500-CA, LG Electronics Inc., Korea), with a resolution ratio of 1920 × 1080 and frequency of 100 Hz. The television model was selected as it can project both 2D and 3D movie images. For 3D TV, participants were asked to wear the polarized 3D glasses during watching to create stereoscopic depth (i.e., 3D images). The participants were asked to watch the movie with minimal body movements in both 2D and 3D movie conditions. Immediately after the 45-min movie watching, another 5-min EEG data were collected in same eye-closed state as measured in before watching session. Final-ly, the participants completed a subjective questionnaire (SQ) (Hoffman et al., 2008) which included the symptoms about headache, stinging, bleary, double vison, nausea, dizzy, eyestrain, watery eyes, difficult focusing and vomiting to deter- mine the degree of fatigue (Table 1). After one-week, the participants watched the same movie with identical testing procedures such as EEG, testing pro- cedure and movie content. The 2D and 3D movie-watching sessions were randomized assigned across participants. The process of data acquisition and analysis are shown in Figure 1.
Table 1. Subjective fatigue evaluation.
Table available in the original PDF paper.
Level Fatigue status Symptom Score
2 < Score ≤3
Moderate or less moderate eyestrain, mild stinging and dizziness
1 No Fatigue Without obvious characteristics 0 ≤Score < 1 2 Mild fatigue Mild eye strain and gritty 1 < Score ≤2 3 Less moderate Fatigue 3 < Score ≤4
4 Moderate fatigue
Moderate or less severe eyestrain, moderate or less moderate stinging, mildly bleary, moderately dizzy, mild and less moderate nausea and headache 4 < Score ≤5 5 Severe fatigue Severe eyestrain, severe dizziness, severe or less severe headache, nausea and vomiting
Figure 1: The process of data acquisition and analysis.
Figure available in the original PDF paper.
Data Analysis Since most biological artifacts such as eye blinks, and involuntary move- ments included breathing, heartbeat, and muscle activity were about 50Hz, we applied the low-pass filter of 50 Hz to remove these artifacts from EEG
756 Liu
raw signals (Jung et al., 1997), Subsequently, extended Independent Com- ponent Analysis (ICA) was employed to eliminate artifacts associated with involuntary motion and eye blinks. Furthermore, any noise due to surplus nodding and visible body movements that were identified in video recording, was manually synchronized and removed.
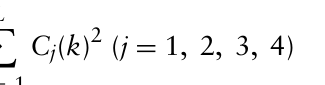
We performed a reconstruction of the wavelet decomposition coefficients and retrieved the data for each frequency waveband. The energy associated with the four waveband frequencies was denoted as Equation (1), where j represents the distinct waveband frequencies (δ, θ, α, and β), C_j signifies the wavelet coefficient contributing to the respective waveband frequency, and L denotes the total count of coefficients.
L X
Equation reproduced from the original PDF.Equation reproduced from the original PDF.
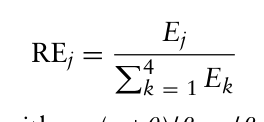
The relative energy (RE) of each waveband frequency can be expressed as Equation.
Equation reproduced from the original PDF.
Finally, four ratio algorithms (α+θ)/β, α/β, (α+θ)/(β+α) and θ/β were calculated for all EEG data epochs.
The two-way ANOVA was used to verify significant interaction effects of 2D and 3D on before and after watching. A paired-samples t-test was performed for the mean values of subjective questionnaires results to iden- tify significant differences between after watching 2D and 3D movie. SPSS software (Vision22.0, USA) was used for this analysis.
RESULTS
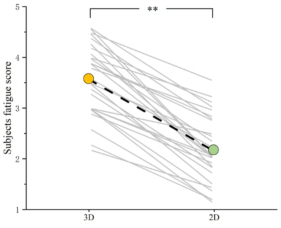
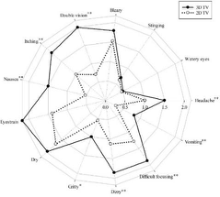
The subjective questionnaires results were shown in Figure 2 and Figure 3. The fatigue score of watching 3D is significantly higher than 2D (p < 0.01). And, almost all the visual fatigue symptom of watching 3D TV were more obvious than watching 2D TV. There are significant increased for the watch- ing 3D TV groups as compared with watching 2D TV groups in visual fatigue symptom about headache, vomiting, difficult focusing, dizzy, gritty, nausea, itching and double vision.
Figure 2: The comparison of subjective fatigue score between 2D and 3D group (**p < 0.01).
Assessment of Visual Discomfort During Watching 3D and 2D Televisions 757
Figure 3: SQ results between watching 3D and 2D TV (*p < 0.05,**p < 0.01).
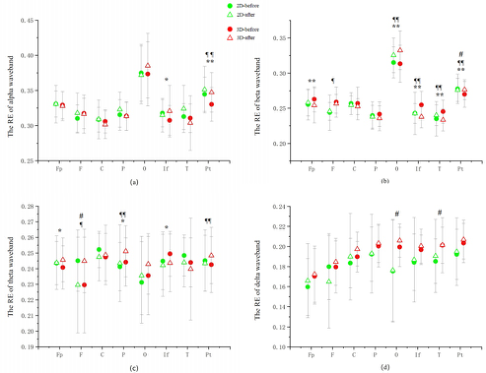
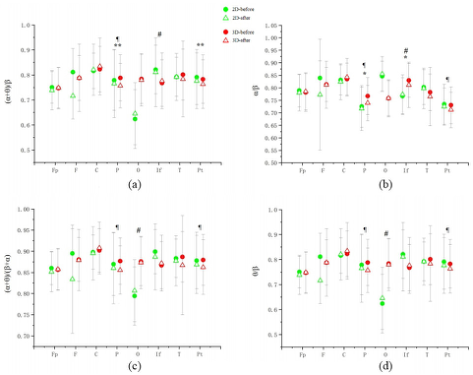
The comparison of 3D and 2D groups are shown in Figure 4 and Figure 5 The electrode positions are depicted on the horizontal axis, while the vertical axis of each graph represents the values of eight EEG parameters both pre- and post watching 3D/2D television content.
According to the two-way ANOVA, we found that there was significant interaction between TV and time on If (alpha, beta and theta), P (theta), O (beta), Fp (beta and theta), T (beta) and Pt (alpha and beta). The main effect of TV indicated that the mean of the relative energy of alpha frequency band of 3D groups has significance increase in pre-frontal, occipital, tempo- ral region. The relative energy of the beta frequency band in the 3D group exhibited a significant decrease (p < 0.05) across all regions, with the excep- tion of the central and temporal regions. Additionally, significant differences (p < 0.05) between watching 2D and 3D were observed for the electrodes Fp (alpha and theta), P (theta), O (alpha), If (alpha), and T (theta). Neverthe- less, no significant difference (p > 0.05) in delta rhythm was noted across all electrodes.
From Figure 4 (b), the RE of beta waveband showed that there is signif- icant difference between 3D-before and 3D-after in almost all the regions except T.
Figure 4: The relative energy results comparison between 3D and 2D groups. # Time ¶TV;* Time*TV# =** difference of change between 2D and 3D at p < 0.01, *p < 0.05; # difference between before watch 2D and after watch 2D at p < 0.05; ¶difference between before watch 2D and after watch 2D at p < 0.05.
758 Liu
Meanwhile, in the 3D group, the value of (α+θ)/β increases significantly in inferior frontal region and decreases significantly (p < 0.01) in frontal region. For the watching 3D TV subjects, the value of α/β in parietal and posterior temporal regions, the value of (α+θ)/(β+α) in frontal, parietal and inferior frontal regions, the value of θ/β in frontal region increases greater (p < 0.01) than watching 2D TV.
Figure 5: The ratio of energy results comparison between 3D and 2D groups.
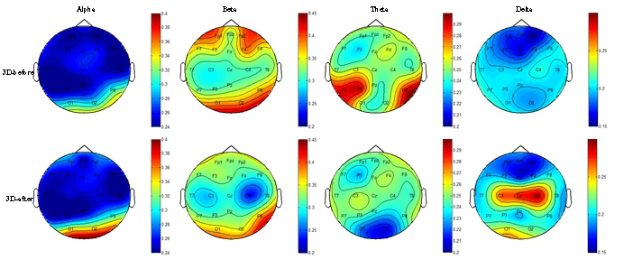
The brain topography of electroencephalogram activity is shown in Figure 6. The alpha, beta, theta and delta wavebands of before watching 3D TV (BW3D) and after watching 3D TV (AW3D) are indicated above and below in Figure 7, respectively. In the wave-band, heightened activity is repre- sented by the color red, while subdued activity is denoted by the color blue. In posterior temporal and occipital regions, especially right parietal, alpha activ- ity increases. Beta activity shows decline in frontal pole, frontal and central regions. Theta activity also shows decline in posterior temporal and occipi- tal regions. At last, according to the delta activity, increased in central and occipital regions.
Figure 6: Brain topography of electroencephalogram activity between 3D-before and 3D-after.
Assessment of Visual Discomfort During Watching 3D and 2D Televisions 759
Compare to the 3D-befroe, the mean value of RE in alpha waveband has a significantly increased in Fp, F, O and T regions after watching 3D. Con- versely, the beta activity significantly decreases in all the regions except T region. RE of theta waveband (P, O and Pt regions) and delta waveband (C and O regions) increased significantly. The ratio of (α+θ)/β (O regions), α/β (F, O and Pt regions) and (α+θ)/(β+α) (P regions) increased significantly. Meanwhile, (α+θ)/β (Pt regions), (α+θ)/(β+α) (Pt regions) and θ/β (O and Pt regions) decreased significantly.
Prior research has indicated that individuals viewing 3D television have reported increased visual discomfort (Kim et al., 2013; Hoffman et al., 2008; Zhang et al., 2013). Our findings similarly revealed a higher incidence of visual fatigue symptoms among participants who watched 3D television in comparison to those viewing 2D television.
Repeated EEG measurements have been consistently cited as a dependable approach for assessing mental fatigue. In our present investigation, analy- sis of the RE and RE ratio of the EEG signal demonstrated a noteworthy augmentation in alpha activity within the pre-frontal, frontal, temporal, and occipital regions. At the conclusion of the extended 3D TV viewing, a reduc- tion in beta activity was observed in the pre-frontal, inferior frontal, frontal, posterior temporal, parietal, central, and occipital regions. Similarly, prior research has demonstrated a rise in alpha activity and a decline in beta activity under conditions of fatigue (Kecklund and Ã…kerstedt, 1993). Belyavin and Wright (1987) emphasized that the most informative marker of diminished vigilance was the evident reduction in beta activity, whereas Lal and Craig (2001) suggested that the increase in alpha activity served as the most sensi- tive indicator of fatigue. In a prior investigation conducted by Zhang et al. (2009), it was revealed that beta activity exhibits a close association with the phenomenon of mental fatigue. Subsequently, a significant decline in the relative energy of the beta frequency band was observed across the frontal, central, and parietal electrode locations following prolonged experimental durations. In addition, Lal and Craig (2002) reported an increase in delta and theta brainwave activities during fatigue, while our study found increased delta and theta activities post-viewing. Discrepancies may arise due to differ- ent frequency band definitions or milder fatigue induction in our study. EEG component changes might also be obscured by subjects’ movements, such as head motions, while combating fatigue.
In general, the decrease of beta activities can indicate fatigue in the almost all the regions of the brain. Hence, the beta frequency wave was used to establish an evaluation criterion to indicate the 3DTV fatigue in this study.
CONCLUSION
Extended exposure to 3D TV yields notable psychological and physiologi- cal effects, impacting subjective fatigue and the central nervous system. This study focuses on utilizing EEG data to gauge fatigue levels. In contrast to 2D TV, 3D TV viewing induces heightened fatigue and discomfort. EEG data analysis indicates a significant reduction in beta waveband energy in most regions, except the temporal (T) regions. This led to the development of a new evaluation model utilizing beta waveband parameters from seven regions,
760 Liu
which can aid in establishing health standards for 3D TV and provide vital physiological insights for its adoption.
While the current findings are valuable, there remain certain potential limitations within this study. Firstly, the study does not delve into the spe- cific mechanisms underlying visual fatigue induced by 3D viewing. Multiple factors affecting visual fatigue during 3D viewing, such as depth of field, 3D proportion, the use of 3D glasses, and viewing duration, have not been addressed. Secondly, given the complexity of brain activities, future research endeavors should aim to develop a comprehensive model that incorporates other modal signals, including functional magnetic resonance imaging (fMRI) and near-infrared (NIR), to enhance the evaluation model. It is imperative to take these limitations into account in future investigations pertaining to visual fatigue.
ACKNOWLEDGMENT
The authors would like to acknowledge the support of the participants helped in this study.
REFERENCES
Bang, J.; Heo, H.; Choi, J. S.; Park, K. (2014) Assessment of Eye Fatigue Caused by 3D Displays Based on Multimodal Measurements, Sensors. Belyavin, A.; Wright, N. A. (1987) Changes in electrical activity of the brain with
vigilance, Electroencephalography Clinical Neurophysiology. Blehm, C.; Seema Vishnu, F.; Khattak, A.; Mitra, S.; Yee, R. W. (2005) Computer Vision Syndrome: A Review, Survey of Ophthalmology. Emoto, M.; Niida, T.; Okano, F. (2005) Repeated Vergence Adaptation Causes
the Decline of Visual Functions in Watching Stereoscopic Television, Journal of Display Technology. Emoto, M.; Nojiri, Y.; Okano, F. (2004) Changes in fusional vergence limit and its hysteresis after viewing stereoscopic TV, Displays. Fan, X.; Zhou, Q.; Liu, Z.; Xie, F.; Liu, F.; Lee, D. H.; Lagoa, R.; Kumar, S. (2015)
Electroencephalogram assessment of mental fatigue in visual search, Biomedical Materials Engineering. Hoffman, D. M.; Girshick, A. R.; Akeley, K.; Banks, M. S. (2008) Vergenceaccommodation conflicts hinder visual performance and cause visual fatigue, Journal of Vision. Jaušovec, N.; Jaušovec, K. (2000) EEG activity during the performance of complex
mental problems, International Journal of Psychophysiology. Jeong, H. G.; Ko, Y. H.; Han, C.; Oh, S. Y.; Park, W. K. (2015) The impact of 3D and 2D TV watching on neurophysiological re-sponses and cognitive functioning in adults. European Journal of Public Health. Jung, T. P.; Makeig, S.; Stensmo, M.; Sejnowski, T. J. (1997) Estimating alertness
from the EEG power spectrum, IEEE Transactions on Biomedical Engineering. Kecklund, G.; Åkerstedt, T. (1993) Sleepiness in long distance truck driving: an ambulatory EEG study of night driving, Ergonomic. Kim, C.; Park, S.; Won, M.; Whang, M.; Lee, E. (2013) Autonomic Nervous System
Responses Can Reveal Visual Fatigue Induced by 3D Displays, Sensors. Kim, S. H.; Suh, Y. W.; Yun, C. M.; Yoo, E. J.; Yeom, J. H. (2013) 3D Asthenopia in Horizontal Deviation, Current Eye Research.
Assessment of Visual Discomfort During Watching 3D and 2D Televisions 761
Kim, S.-H.; Suh, Y.-W.; Yun, C.-M.; Yoo, E.-J.; Yeom, J.-H.; Cho, Y. A. (2013) 3D asthenopia in horizontal deviation, Current Eye Research. Kooi, F. L.; Toet, A. (2004) Visual comfort of binocular and 3D displays, Displays. Kroupi, E.; Hanhart, P.; Lee, J. S.; Rerabek, M.; Ebrahimi, T. (2016) Modeling
immersive media experiences by sensing impact on subjects, Multimedia Tools Applications. Lal, S. K.; Craig, A. (2002) Driver fatigue: electroencephalography and psychological assessment, Psychophysiology. Lal, S. K. L.; Craig, A. (2001) Electroencephalography Activity Associated with
Driver Fatigue: Implications for a Fatigue Countermeasure Device, Journal of Psychophysiology. Lambooij, M.; Fortuin, M. F.; Ijsselsteijn, W. A.; Heynderickx, I. (2012) Reading performance as screening tool for visual com-plaints from stereoscopic content, Displays. Lambooij, M.; Ijsselsteijn, W.; Fortuin, M.; Heynderickx, I. (2009) Visual Discomfort
and Visual Fatigue of Stereoscopic Displays: A Review, Journal of Imaging Science Technology. Pastoor, S. (1991) 3D-television: a survey of recent research results on subjective requirements, Signal Processing Image Communication. Sheedy, J. E.; Engle, J. (2002) Is All Asthenopia the Same? Optometry Vision Science. Speranza, F.; Tam, W. J.; Hur, N. (2006) Effect of disparity and motion on visual
comfort of stereoscopic images, Proc SPIE. Stikic, M.; Johnson, R. R.; Tan, V.; Berka, C. (2014) EEG-based classification of positive and negative affective states, Brain-Computer Interfaces. Yano, S.; Emoto, M.; Mitsuhashi, T. (2004) Two factors in visual fatigue caused by
stereoscopic HDTV images, Displays. Yano, S.; Ide, S.; Mitsuhashi, T.; Thwaites, H. (2002) A study of visual fatigue and visual comfort for 3D HDTV/HDTV images, Displays. Yue, K.; Wang, D. (2019) EEG-Based 3D Visual Fatigue Evaluation Using CNN,
Electronics. Zhang, C.; Zheng, C. X.; Yu, X. L. (2009) Automatic recognition of cognitive fatigue from physiological indices by using wavelet packet transform and kernel learning algorithms, Expert Systems With Applications. Zhang, L.; Zhang, Y. Q.; Zhang, J. S.; Xu, L.; Jonas, J. B. (2013) Visual fatigue and
discomfort after stereoscopic display viewing, Acta Ophthalmologica.
LISTED IN THE AHFE DIGITAL BOOKSTORE CATALOGUE
Explore the complete digital volume
Human-Centered Design and User Experience
Read this individual research paper free through the original publisher, or explore the full digital proceedings book.
ISBN 978-1-958651-90-2
Explore this ISBN in the AHFE Bookstore ↗Listed in the July 2026 bookstore catalogue; search by ISBN to confirm current availability · Digital book purchase optional