Mengmeng Jin, Jiatao Wang, Ying Yin, Zhongqi Liu, Qianxiang Zhou, Yingwei Li (2026). The PSO-SVM Recognition Model for Brain Alertness Based on EEG. In: Neuroergonomics and Cognitive Engineering. AHFE Open Access, vol. 207, pp. 140–150. https://doi.org/10.54941/ahfe1007403
Continuous monitoring of both electrical and mechanical cardiac activity is essential for early detection and management of cardiovascular diseases in real-life environments. This paper presents the design and preliminary evaluation of a chest-worn, Holter-like device that enables 24-hour quad-modal cardiac monitoring by synchronously acquiring electrocardiogram (ECG), phonocardiogram (PCG), seismocardiogram (SCG), and gyrocardiogram (GCG) signals. The main unit is attached to the chest and integrates a heart sound sensor, a 6-axis inertial measurement unit (IMU), data acquisition and storage circuits, and a battery into a single compact housing, while four limb leads (RA, RL, LA, LL) are extended from the device to record ECG. All cardiac signals are sampled at 10 kHz under a shared hardware clock, ensuring absolute temporal synchronization across modalities. Building on the IMU, SCG (chest wall micro-acceleration) and GCG (chest wall micro-rotation) are treated not only as auxiliary motion references, but also as cardio-mechanical signals that are jointly analyzed with ECG. A cross-modal motion artifact suppression framework is proposed, in which ECG, SCG, and GCG mutually constrain each other: motion-dominated components are identified via their inconsistent morphology across modalities, while cardiac components exhibit stable beat-synchronous patterns. The denoised ECG then serves as a temporal reference to perform ECG-guided heart sound segmentation on the PCG, enabling robust extraction of the first to fourth heart sounds (S1–S4). A custom desktop software platform supports synchronized visualization, beat-level quality assessment, and batch analysis of 24-hour recordings. Preliminary tests on healthy subjects during daily activities (resting, walking, posture changes) show that the proposed quad-modal system effectively reduces motion-induced artifacts, improves the morphological consistency of ECG, SCG, and GCG, and achieves reliable multi–heart sound segmentation under ambulatory conditions.The chest-worn, integrated design and cross-modal processing pipeline demonstrate strong potential as a user-friendly and low-cost solution for continuous, multi-dimensional cardiovascular monitoring in clinical and home settings.
Alertness refers to an individual’s sensitivity to external stimuli and the degree of attention allocated to tasks, serving as a core component of human cognition and behavior (Warm et al., 2008). During long-term space missions, astronauts’ alertness level is critical for task performance and personnel safety, yet it is susceptible to influences from the environment, workload, and sleep quality. Previous studies have shown that reduced alertness in space environments can lead to diminished cognitive function, increased decision-making errors, decreased work performance, and even impact physiological health (Nasrini et al., 2020). Therefore, it is particularly urgent to accurately identify the alertness level for understanding the mechanisms underlying alertness decline and its potential risks.
Alertness is a complex physiological process. Researchers commonly construct acute sleep deprivation experiments to simulate a decline in alertness caused by prolonged work hours in real-world settings. The advantage lies in observing individuals’ alertness level at different time points under controlled conditions, thereby capturing subtle changes over time. Characteristics of varying alertness levels manifest across multiple electrophysiological signals, including electrocardiogram (ECG), electrooculogram (EOG), and electroencephalogram (EEG) (Hoedlmoser et al., 2011). Among these, EEG records the spatiotemporal dynamics of brain activity, providing precise and direct data for research on alertness. EEG analysis methods, such as event-related potentials (ERPs) and power spectral density (PSD), have become essential tools for investigating alertness (Elmenhorst et al., 2008). By analyzing the time–frequency characteristics of EEG signals, researchers have examined the mechanisms by which alertness influences cognitive functions such as work performance, fatigue, and attention. Trujillo et al. observed that after 24 hours of sleep deprivation, ERP analyses related to attention networks showed an increased P2 amplitude and a reduced P3 amplitude, which significantly affected subjects’ reaction time and accuracy rate. Ferreira et al. used PSD analysis to reveal that partial or complete sleep deprivation leads to degradation in cognitive functions such as alertness, manifested in specific frequency bands across multiple brain regions, including the prefrontal and occipital cortices.
In recent years, with the advancement of machine learning methods, classification and recognition research based on EEG signals have achieved substantial technical progress and have been widely applied in cognitive domains, including the assessment of cognitive abilities such as fatigue and alertness. Zhang Peng et al. induced a state of fatigue through sleep deprivation (Zhang et al., 2023). By deeply analyzing EEG signals, they identified sensitive leads and features, constructing a random forest regression
model to classify fatigue levels, thereby enhancing the portability of mental fatigue detection for space station astronauts. Guo Zizheng et al. used driving performance as an objective evaluation metric, selected spectral amplitude and composite indicators from the EEG frequency bands of drivers as feature indicators (Guo et al., 2016). By combining PSO with SVM, they constructed an algorithm for identifying sustained attention levels during driving.
In summary, this study recruited 30 male subjects to conduct a 36-hour complete sleep deprivation (SD) experiment. Using EEG signals as feature indicators, we implemented a combined particle swarm optimisation (PSO) and support vector machine (SVM) approach to classify and identify different levels of alertness. This provides support for improving astronauts’ work performance and health status, and offers a theoretical basis for developing portable alertness level recognition and monitoring systems.
METHODS
Thirty healthy young male volunteers participated in the experiment, aged 20–27 years (mean age 22.79 ± 2.27 years). Recruitment advertisements were posted on social media platforms, and all participants underwent screening. Subjects had no history of neuropsychiatric disorders, no recent acute infections, and no medication history. Based on the Pittsburgh Sleep Quality Index, all participants had good sleep habits and normal sleep–wake rhythms. Prior to the experiment, subjects were informed about the sleep deprivation process and potential risks. All participants voluntarily agreed to participate and signed informed consent forms.
Table 1: Demographic information of participants.
Table available in the original PDF paper.
Demographic Variables Data Number Thirty
Gender Male BMI / (kg·m-2) 20.20 ± 1.15 Habitual sleep time 7.27 ± 0.74
Years of education 14.90 ± 1.77
The experiment employed a self-controlled design, requiring subjects to fully participate in one complete sleep deprivation trial. Subjects arrived at the laboratory one day prior to testing and slept at the laboratory that night, ensuring 8 hours of sleep. Sleep deprivation began at 8:00 AM on the second day. Resting-state EEG data were first recorded, followed by the first psychomotor alertness task, which was defined as the baseline measurement (Baseline). The second and third psychomotor alertness tasks were completed after 24 hours of deprivation (designated as 24 h-SD) and 36 hours of deprivation (designated as 36 h-SD), respectively, with EEG recorded concurrently. Sleep deprivation concluded at 8:00 PM on the third day. Throughout the entire trial, ensure that the principal investigator and medical staff are present at all times to supervise the subjects and prevent them from sleeping (including dozing off), while also preventing any unexpected incidents.
EXPERIMENT TASK First, the test employed the Stanford Sleepiness Scale (SSS). Previous studies have demonstrated that sleep circadian rhythm disorders can increase sleepiness and decrease alertness. This study utilized this scale to assess participants’ alertness levels before and after sleep deprivation.
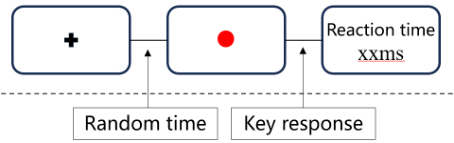
The Psychomotor Vigilance Task (PVT) was then administered. During the eyes-open resting period, subjects focused their gaze on a fixed crosshair centered on the screen. In the PVT task, the screen initially displayed a crosshair fixed at the center. After a random interval of 2 to 10 seconds, it transitioned to a red dot. Subjects were instructed to press the spacebar as quickly as possible with their right index finger. Following the key press, the reaction time was displayed on the screen, after which the display immediately reverted to the crosshair, as shown in Figure 1.
Figure 1: Mental alertness task diagram.
EEG recordings were conducted in a dimly lit, soundproof, and electronically shielded EEG laboratory. A 21-inch monitor was positioned 75 cm in front of the subject to present visual stimuli. The subject’s visual center aligned with the monitor center. The PVT task was programmed and presented using E-prime 2.0, with EEG data acquired and analyzed using the Scan 4.3 (Neuroscan Products) 32-channel EEG recording system. Electrodes were placed according to the international 10–20 system. Horizontal and vertical electrooculography (EOG) signals were recorded during data acquisition, with bilateral mastoid electrodes serving as reference. EEG sampling frequency was set at 1000Hz, and electrode impedance was maintained below 5kΩ.
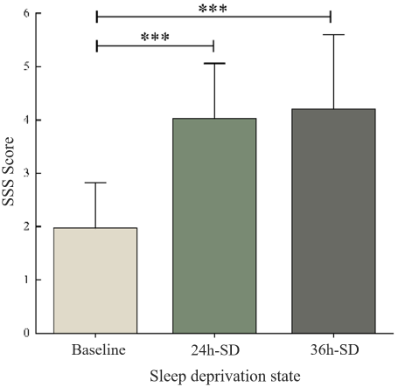
DATA ANALYSIS AND FEATURE SELECTION Behavioural data were analysed using SPSS 22.0 software with one-way repeated measures analysis of variance to test the main effect of time (Baseline, 24 h-SD, and 36 h-SD). When the sphericity assumption was violated, the Greenhouse–Geisser correction was applied. A significance level of P < 0.05 was adopted. Statistical analysis was conducted on the SSS questionnaire scores for each subject before and after sleep deprivation. As shown in Fig. 2, the main effect of time was significant (p < 0.001). Post hoc comparisons indicated that compared to baseline, subjective sleepiness increased markedly after 24-hour and 36-hour total sleep deprivation (both p < 0.001), whereas sleepiness did not differ significantly between the 24 h-SD and 36 h-SD conditions.
Figure 2: Sleepiness scores of subjects at different time points.
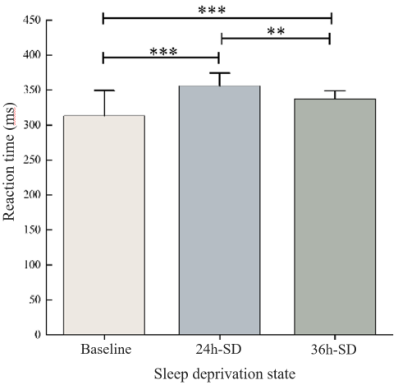
Statistical analysis was conducted on the mean reaction times for the PVT task completed by each subject before and after sleep deprivation, with results shown in Figure 3. The results revealed a significant main effect of time (P < 0.001). Post hoc comparisons revealed that compared to baseline, mean reaction times significantly increased after 24h total sleep deprivation (P < 0.001) and after 36h total sleep deprivation (P < 0.001). Mean reaction time at 24 h-SD was significantly longer than at 36 h-SD (P = 0.007).
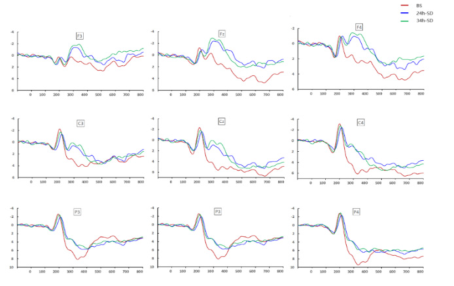
Figure 3: PVT task response before and after sleep deprivation.Figure 4: EEG waveforms showing the impact of different durations of sleep deprivation on brain alertness.
ERP data were preprocessed and analyzed using Scan 4.3 software. After a preview of the raw EEG, regression analysis was applied to remove eye movement artifacts. After filtering (bandpass filtered at 0.05–17 Hz), EEG segmentation (ERP analysis window set to 900 ms, with the pre-stimulus 100 ms used for baseline correction), and balanced baseline adjustment, all correct response-evoked potentials were averaged using a superimposed averaging method. Nine electrode sites (F3, Fz, F4, C3, Cz, C4, P3, Pz, and P4) were selected to extract the amplitude and latency of the P2 and P3 components. EEG waveform diagrams were plotted as shown in Figure 4.
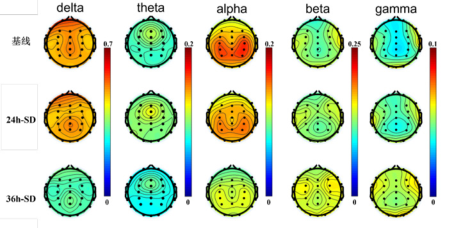
Preprocessing and relative power calculations were performed using the EEGLAB toolbox in MATLAB. To enhance the signal-to-noise ratio, a non-recursive FIR bandpass filter with a bandwidth of 0.1–40 Hz was applied, and the data were segmented into 2-second time intervals for analysis. Bilateral mastoids sates TP9 and TP10 were selected as reference electrodes. Abnormal data segments and anomalous lead signals were manually removed, followed by Independent Component Analysis (ICA) to correct for blink or motion drift segments. To prevent signal attenuation and distortion, power spectrum estimation based on the Welch algorithm was performed using a 50% overlapping Hamming window function for each segment. Relative power was calculated for each frequency band, and a topographic map was generated, as shown in Figure 5.
Figure 5: Topographic maps of relative power in different EEG frequency bands after various durations of sleep deprivation.
Regarding ERP-related temporal domain characteristics, the results of one-way ANOVA revealed significant differences in P2 amplitude (F = 5.23, P < 0.01) and P3 latency (F = 3.43, P < 0.05). Further post-hoc analysis indicated significant differences in P2 amplitude between baseline and 24 h-SD (P < 0.01) and in P3 latency between baseline and 36 h-SD (P < 0.05). Accordingly, P2 amplitude and P3 latency were selected as the time-domain sensitive indicators for feature fusion.
Table 2: Results of single-factor ANOVA of EEG time domain features.
Table available in the original PDF paper.
ERP Features Lead Link F Crit P-Value P2 amplitude Pz 5.23 0.007
P3 latency P3 3.43 0.037
Table 3: Results of single-factor ANOVA of EEG frequency domain features.
Table available in the original PDF paper.
Frequency Band Lead Link F Crit P-Value F3 4.82 0.01
Fz 6.57 0.002 F4 9.88 <0.001
C3 7.66 0.01 θ Cz 16.15 <0.001 C4 9.47 <0.001
P3 16.08 <0.001 Pz 10.02 <0.001 P4 7.19 0.01
Fz 4.11 0.02 F4 4.55 0.01
Cz 3.97 0.022
α Pz 4.47 0.014 P4 3.90 0.024
Previous studies have indicated that the θ and α frequency bands in EEG signals are the primary frequency ranges for investigating alertness. The results of one-way ANOVA on the relative power spectra across frequency bands show that θ and α frequencies reflect differences in varying levels of alertness, with the θ band exhibiting the most significant variability. In particular, the θ band at Cz, P3, and Pz electrodes is the most ideal feature selection for three-class classification (p < 0.01). From a frequency band perspective, the θ band demonstrated significance across all nine selected electrodes (p < 0.01), making it the optimal feature band. The α band followed, exhibiting significance across five electrodes (p < 0.05). Therefore, the nine θ band electrodes and five α band electrodes were selected as frequency- domain sensitive indicators for feature screening.
The PSO-SVM Recognition Model for Brain Alertness Based on EEG 147 THE PSO-SVM RECOGNITION MODEL FOR BRAIN ALERTNESS
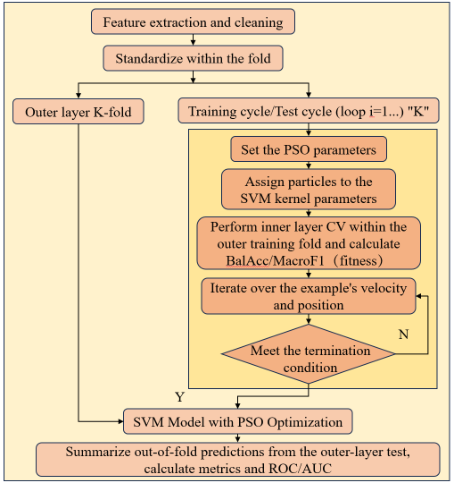
This paper employs a particle swarm optimization algorithm to automatically optimize the hyperparameters of radial basis function support vector machines, thereby enhancing the discrimination performance of alertness states. The model employs RBF-SVM as the base classifier, with optimization targets including the penalty coefficient C and kernel scale parameter KernelScale. Considering the parameters’ multi-scale variation characteristics, the search is conducted in the logarithmic domain. Specifically, log10C and log10KernelScale serve as particle position variables, undergoing continuous updates within preset boundaries. The specific process is shown in Figure 6.
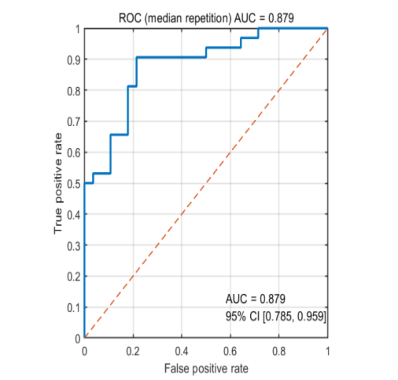
Figure 6: PSO-SVM classification flow chart.Figure 7: ROC curve of the PSO–SVM model (median repeat; AUC with 95% confidence interval).
To focus on changes in alertness, this study combined the 24-hour and 36-hour SD samples into a single model, using the relative change from baseline during the deprivation phase to reflect the degree of alertness deviation. Model performance was estimated using repeated nested cross-validation. The outer layer uses 5-fold cross-validation, where each fold reserves approximately one-fifth of the data as the test fold and the remainder as the training fold. The inner layer further performs 5-fold cross-validation within the training folds of the outer layer to determine the optimal combination of the PSO search penalty coefficient C and the kernel scale parameter KernelScale. The prediction results from the outer-layer test fold serve as an objective measure of the model’s generalization capability. Based on these results, a ROC curve is plotted, as shown in Figure 7, and performance metrics are calculated, as shown in Table 4.
Table 4: Classification results of alertness by the PSO-SVM model.
Table available in the original PDF paper.
Indicator M ± SD 95% CI Acc 0.800 ± 0.039 0.750–0.833 Macro F1 0.799 ± 0.038 0.750–0.832
Table 5: Pairwise differences in classification accuracy among models.
Table available in the original PDF paper.
Model ANN SVM PSO-SVM KNN 0.099 0.177 0.244
ANN 0.078 0.145 SVM 0.067
Note: Values represent the difference in classification accuracy between the column model and the row model, calculated as Accuracy (column model) − Accuracy (row model). Positive values indicate that the column model outperformed the row model.
The results of Table 4 demonstrate that PSO-SVM exhibits strong discrimination capabilities across subjects’ alertness states. The AUC remained at a high level, with relatively converged standard deviation and 95% CI, indicating stable classification performance across different replicate partitions. The model achieves an overall accuracy of approximately 0.80, reflecting high-level overall performance.
To compare the recognition performance of different classifiers, this paper also constructed classification models using K-Nearest Neighbor (KNN), Artificial Neural Network (ANN), and Support Vector Machine (SVM), as
The PSO-SVM Recognition Model for Brain Alertness Based on EEG 149 shown in Table 5. Comparative analysis of the recognition results in Table 5 reveals that, compared to relatively simple classifiers such as KNN, ANN, and SVM, the classifier integrating PSO with SVM is more suitable for constructing an alertness recognition model. It achieved an average classification accuracy rate of 80%, demonstrating superior alertness recognition performance.
DISCUSSION
This study employed simple alertness tasks, which encompass a series of psychological mechanisms, including early perception, alertness, attention, and responsiveness. Behavioral performance results indicated that following sleep deprivation, subjects exhibited significantly increased levels of drowsiness and markedly slower reaction times across tasks, demonstrating that sleep deprivation impairs individual alertness. The ERP results showed a significant increase in P2 amplitude after 24 h-SD in all participants. This pattern suggests slower discrimination and processing of stimulus information after sleep loss, along with weaker selection of relevant information, reduced attentional engagement, and diminished resistance to interference.
Spectral analysis results indicate that changes in θ and α waves reflect the impact of sleep deprivation on alertness. Twenty-four -SD elevates overall resting-state theta power, most notably in the frontal region. Alertness negatively correlates with θ power, decreasing with prolonged wakefulness. However, at 36 h-SD, θ power had already declined compared to the 24-hour mark. α waves, associated with relaxation and rest, decrease in tandem with reduced alertness. Following sleep deprivation, especially after 30 hours of wakefulness, α wave power associated with attentional vigilance shows a slight decrease. This study found that spontaneous α activity in the brain significantly decreased after 36 h-SD, whereas no significant difference was observed after 24 h-SD.
The present study combined a sleep-deprivation paradigm with simple alertness tasks, subjective sleepiness ratings, ERP measures and resting-state EEG spectral analysis to characterize alertness changes across behavioral and electrophysiological levels. Future work should extend this framework using time–frequency analysis, functional connectivity and machine-learning- based feature integration to strengthen both mechanistic interpretation and individualized identification of alertness states. Several findings merit further study, particularly whether the increase in P2 amplitude after 24 h of sleep deprivation serves as an early electrophysiological marker of alertness decline, and whether the distinct theta and alpha changes observed across prolonged wakefulness reflect stage-dependent neural dynamics. Greater emphasis should also be placed on temporal trajectories, individual vulnerability to sleep loss and the robustness of these findings under more naturalistic conditions.
This study offers a new perspective for the accurate identification and deeper understanding of brain alertness. However, certain limitations remain, such as the relatively small sample size, necessitating validation in larger populations. Future research aims to further expand this field to enhance the model’s performance and applicability.
CONCLUSION
SSS scale scores and PVT reaction time both showed significant differences (p < 0.05), indicating that the sleep deprivation experiment successfully distinguished varying levels of alertness, providing research evidence for model construction. At the neural representation level, significant differences were observed in ERP time-domain features, specifically in P2 amplitude and P3 latency, while frequency-domain features of relative power most effectively characterized alertness differences at θ and α frequencies, with the θ band being the most sensitive. The PSO-SVM model constructed based on these features achieved stable and high classification performance, with an average accuracy of 80.0%, a recall of 79.9%, and a specificity of 79.3%. It outperformed traditional single classifiers in comparative evaluations, further supporting the effectiveness of this method for alertness recognition.
ACKNOWLEDGMENT
This work was supported by the National Key R&D Program of China (Grant No. 2023YFF0615904). The authors would like to thank this supporter and all participants for their cooperation in the experiments.
REFERENCES
Elmenhorst, E.-M., Elmenhorst, D., Luks, N., Maass, H., Vejvoda, M., & Samel, A.
(2008). Partial sleep deprivation: Impact on the architecture and quality of sleep. Sleep Medicine, 9(8), 840–850. Ferreira, C., Deslandes, A., Moraes, H., Cagy, M., Pompeu, F., Basile, L. F., Piedade, R., & Ribeiro, P. (2006). Electroencephalographic changes after one night of sleep deprivation. Arquivos de Neuro-Psiquiatria, 64(2b), 388–393. Guo Z., Zhimin W., Yufan P., et al. (2016). PSO-SVM ldentification Model for
Driving SustainedAttention Level Based on EEG, Journal of Beijing University of Technology, 42(03), 427–432. Hoedlmoser K., Griessenberger H., Fellinger R., et al. (2010). Event-related activity and phase locking during a psychomotor vigilance task over the course of sleep deprivation. Journal of Sleep Research, 20(3), 377–385. Nasrini, J., Hermosillo, E., Dinges, D. F., Moore, T. M., Gur, R. C., & Basner, M.
(2020). Cognitive Performance During Confinement and Sleep Restriction in NASA’s Human Exploration Research Analog (HERA). Frontiers in Physiology, 11, 394. Trujillo, L. T., Kornguth, S., & Schnyer, D. M. (2009). An ERP Examination of the Different Effects of Sleep Deprivation on Exogenously Cued and Endogenously Cued Attention. Sleep, 32(10), 1285–1297. Warm, J. S., Parasuraman, R., & Matthews, G. (2008). Vigilance Requires Hard
Mental Work and Is Stressful. Human Factors: The Journal of the Human Factors and Ergonomics Society, 50(3), 433–441. Zhang P., Qianxiang Z., Hongqiang Yu., et al. (2023). Fast detection method of mental fatigue based on EEG signalcharacteristics. Journal of Beijing University of Aeronautics and Astronautics, 49(01), 145–154.
LISTED IN THE AHFE DIGITAL BOOKSTORE CATALOGUE
Explore the complete digital volume
Neuroergonomics and Cognitive Engineering
Read this individual research paper free through the original publisher, or explore the full digital proceedings book.
ISBN 978-1-964867-83-0
Explore this ISBN in the AHFE Bookstore ↗Listed in the July 2026 bookstore catalogue; search by ISBN to confirm current availability · Digital book purchase optional