Zhongqi Liu, Ran Cheng, Qianxiang Zhou (2026). Visual Load Evaluation Model of Multi-view Monitoring Task Operator. In: Neuroergonomics and Cognitive Engineering. AHFE Open Access, vol. 207, pp. 118–128. https://doi.org/10.54941/ahfe1007401
To explore an effective evaluation method for operators' visual workload in multi-view monitoring tasks, this study conducted a visual workload evaluation experiment consisting of a pre-experiment and a formal experiment. In the pre-experiment, tasks with 1 to 8 visual search areas (View 1 to View 8) were designed to represent different visual workload levels. Combined with the analysis of participants' behavioural performance and the NASA-TLX task workload scale, View 1, View 4 and View 6 were determined to correspond to low, medium and high visual workload tasks, respectively. In the formal experiment, target search tests were carried out on the three types of views, and electroencephalogram (EEG) and eye movement data of 30 participants were collected. Data analysis showed that 7 EEG indicators (including N1 amplitude at Cz/Pz leads within 100–180ms, P2 amplitude at Pz/Oz leads within 180–260ms, θ wave power and θ/β ratio) and 6 eye movement indicators were all sensitive to visual workload changes, with significant differences between low workload and medium/high workload (P<0.05). Based on these 13 indicators, evaluation models were constructed using the particle swarm optimization (PSO) algorithm combined with machine learning algorithms such as SVM and KNN. The results demonstrated that the PSO-KNN model integrating EEG and eye movement features achieved the optimal performance.
Multi-view monitoring systems are widely applied in complex fields such as aerospace, where the number of views is a key factor influencing operators’ visual workload. Studies have shown that an increase in the number of views significantly elevates visual workload by expanding the search scope and increasing the volume of information processing (Doyon et al., 2014, Innes et al., 2021). In the study on remote tower operations, researchers also found that the parallel monitoring of multiple airport views cause controllers to switch their gaze frequently and results in scattered fixations, thereby further increasing visual load (Friedrich et al., 2020).
Current research methods for visual load mainly include the subjective evaluation method, performance evaluation method, and physiological evaluation method. Among them, the subjective evaluation method is simple to operate and easy to implement, and it can reflect operators’ overall subjective experience, but it is highly susceptible to individual subjective
Visual Load Evaluation Model of Multi-View Monitoring Task Operator 119 factors, leading to inconsistent evaluation criteria. The performance evaluation method measures visual load based on operators’ task performance indicators; however, these indicators are prone to interference from multiple factors such as task difficulty and operators’ skill levels.
Physiological measurement utilizes physiological indicators to reflect operator visual load, offering three key advantages: objectivity, real-time capability, and sensitivity. Currently, many studies measure visual load by recording eye-tracking data. For example, it was found that pupil diameter significantly increased with rising task complexity in multi-task monitoring scenarios (Kim and Yang, 2017). Other parameters, such as fixation duration, saccade count, and blink frequency, can also reflect visual workload (Van et al., 2001, Jessee, 2010). Prolonged fixation on a single area or frequent saccades may indicate increased visual load. Blink frequency is closely related to fatigue, with lower blink rates suggesting higher visual load. Average saccade velocity reflects the speed of information processing during the previous fixation and the search for the next target, indicating the intensity of visual information processing.
This study designed target-search experiments simulating multi-view monitoring tasks with low, medium, and high visual load levels. EEG and eye-tracking data were recorded during the experiments. Integrating subjective ratings and behavioural performance, changes of physiological signals were investigated across different visual workload levels. Using the particle swarm optimization algorithm and machine learning algorithm, a model capable of evaluating three levels of visual load (low, medium and high) was established.
EXPERIMENTAL DESIGN Participants
This study recruited 30 participants aged between 23 and 30 years. All participants had normal or corrected-to-normal vision and were free of strabismus, astigmatism, amblyopia, or other ocular pathologies. They were all right-handed and had no history of neurological diseases, intellectual impairments, or other major physical illnesses.
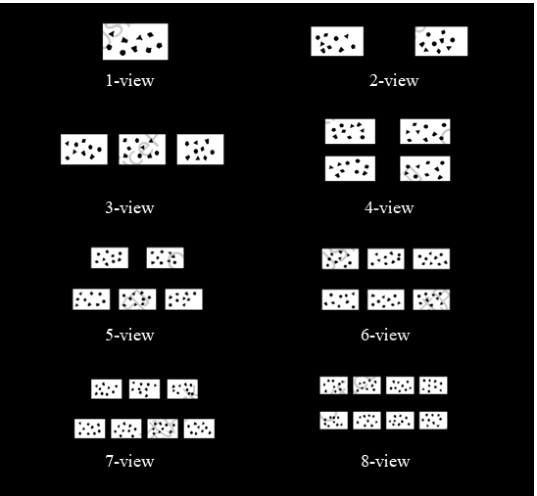
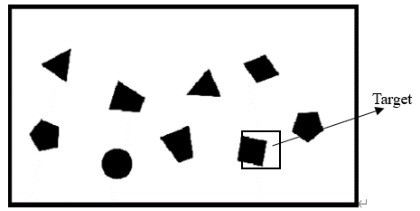
Experimental Task The target search task was adopted to explore visual load characteristics. The search target was a rectangle, with distractors divided into two categories: similar ones (rhombuses) and dissimilar ones (circles, trapezoids, pentagons, triangles). Visual load was gradient-manipulated via 1–8 visual search areas (View 1–View 8), all identical in size and equally spaced (see Fig. 1–Fig. 8). Each area contained 9 figures; in target-present trials, 1 rectangular target was paired with 8 distractors. Two conditions were set for the multi-view task: (1) the target existed only in one area and was absent from others; (2) no target appeared in any area. Prior to stimulus presentation, a fixation cross “+” was displayed at the screen centre for 1s to guide participants’ attention. The search task lasted 5s, during which participants pressed the “J” key if they identified the target, and the “L” key if no target was detected.
Figure 1: Visual search areas from 1 to 8 views.Figure 2: Visual search task.
Determination of Viewport Numbers for Three Visual Workload Levels To establish the number of viewports representing low, medium, and high visual workload levels, a pilot study was conducted with eight participants. Their ages ranged from 23 to 29 years (mean = 25 years, SD = 1.8 years). All other recruitment criteria were identical to those specified in Section 2.1.
Each participant was required to complete experiments ranging from one- view to eight-view tasks. In each view task, a total of 100 trials of stimuli were presented, with 50 trials containing the search target and the remaining 50 trials having no search target. The order of views was randomized, and between each task block, participants took a rest break of 5 to 10 minutes. Upon completion of each view task, participants were required to fill out the NASA Task Load Index (NASA-TLX) questionnaire.
Visual Load Evaluation Model of Multi-View Monitoring Task Operator 121 The NASA Task Load Index scores, accuracy rates, and reaction times for the one-view through eight-view tasks are detailed in Table 1. For the formal analysis, only view tasks with an accuracy rate exceeding 70% were retained; therefore, the 7-view and 8-view conditions were excluded.
Table 1: Subjective scales and behavioural performance (mean ± standard deviation).
One-way ANOVA revealed significant differences (p < 0.05) in the NASA- TLX scores, accuracy rates, and reaction times among the remaining six viewport conditions. Subsequent multiple comparisons indicated that all three of these metrics were significantly different (p < 0.05) between the 1-view, 4-view, and 6-view conditions in a pairwise manner. Therefore, the 1-view, 4-view, and 6-view conditions were selected to represent low, medium, and high visual load levels, respectively.
Experimental Apparatus The experiment utilized EEG acquisition equipment, eye-tracking apparatus, a computer for EEG data collection, and a computer for stimulus presentation.
The EEG data were recorded using a 32-channel Brain Products system. Electrode placement followed the international 10–20 system, with a sampling rate of 1000 Hz. The amplifier filter was set to a bandpass of 0.1Hz to 100Hz, and the Fz electrode served as the reference.
Eye movements were recorded using an SMI RED eye tracker (SensoMotoric Instruments, Germany) with a sampling rate of 120Hz, a tracking resolution of 0.03°, and a gaze position accuracy of 0.4°.
Experimental Procedure All participants completed the experiment according to the following procedure.
(1) Participants signed the informed consent form. (2) They practiced the target search tasks under three levels of visual load until they were proficient. (3) Put on the electroencephalogram (EEG) cap and collected 3-minute
resting-state EEG signals. (4) Performed eye-tracker calibration.
(5) Participants completed the target search tasks of three load level. After completing the tasks of each load level, another 3 minutes of resting- state EEG signals were recorded, followed by participants filling out the NASA-TLX scale.
RESULT AND DISCUSSION
EEG Data A high-pass filter (0.1 Hz cutoff frequency) and a low-pass filter (30Hz cutoff frequency) were applied to eliminate frequency bands outside the research range, while a band-pass filter (48–52Hz) was used to remove 50Hz power-line interference. Damaged electrodes were repaired using the spherical interpolation algorithm. Independent component analysis (ICA) was performed to remove artifacts such as eye blinks, eye movements, and electrocardiographic signals, and extreme values exceeding ± 100μV were excluded. Data were segmented into 6s epochs (including 1s pre-stimulus and 5s post-stimulus) based on stimulus presentation markers, and baseline correction was conducted.
The N1 and P2 components were selected to investigate ERP differences across the low, medium, and high visual load levels. The pre-processed data were re-segmented into epochs from 100ms pre-stimulus to 500ms post-stimulus, with the 100ms pre-stimulus interval serving as the baseline for correction. The mean amplitude of the N1 component was calculated within the 100–180ms window, and the P2 component within the 180–260ms window.
A one-way ANOVA on the mean amplitudes revealed a significant main effect of visual load on the N1 amplitude at the Cz and Pz electrodes (p < 0.05). Subsequent multiple comparisons indicated that at the Cz electrode, the N1 amplitude was significantly different between the low and medium workload conditions and between the low and high workload conditions (p < 0.05), but not between the medium and high workload conditions (p > 0.05). At the Pz electrode, the N1 amplitude showed no significant difference between low and medium workload (p > 0.05), but a significant difference between low and high workload (p < 0.05). The difference between medium and high workload was again insignificant (p > 0.05). At the Fz electrode, N1 amplitude showed significant differences between low and medium workload and between low and high workload (p < 0.05). No significant effect was found at the Oz electrode.
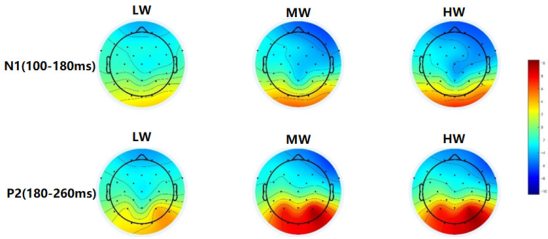
Figure 3: Topographic maps of N1 and P2 components under different workload conditions.
Visual Load Evaluation Model of Multi-View Monitoring Task Operator 123 The mean amplitude of the P2 component showed a significant main effect at the Pz and Oz electrodes (p < 0.05). Further multiple comparisons showed that at the Pz electrode, the P2 amplitude was significantly different between low and medium workload and between low and high workload (p < 0.05), but not between medium and high workload (p > 0.05). At the Oz electrode, the P2 amplitude was also significantly different between low and medium workload and between low and high workload (p < 0.05), with no significant difference between medium and high workload (p > 0.05). The topographic maps (Figure 3) indicate that the reduction in N1 amplitude was primarily concentrated over the frontal and central regions, while the occipital region showed a tendency towards increased amplitude. The increase in P2 amplitude was mainly observed in the occipital region.
A time-frequency analysis was performed on the pre-processed EEG data. The data were segmented into epochs from –1000ms to 2000ms relative to stimulus onset. A Short-Time Fourier Transform (STFT) was applied to these epochs using a 400ms Hanning window to obtain time-frequency representations.
The regions of interest (ROIs) for specific frequency bands were defined as follows: the delta band (0–4Hz) from 300 to 400ms, the theta band (4-8Hz) from 100 to 200ms, the alpha band (8–12 Hz) from 300 to 500ms, and the beta band (13–30Hz) from 300 to 500ms. Figure 3 illustrated the time- frequency representations and the temporal ROIs for the three workload levels at the Oz electrode.
Spatial ROIs for averaging spectral power were also defined. The delta band included electrodes Fp1, Fp2, F3, Fz, F4; the theta band included Cp1, Cp2, P3, Pz, P4, O1, O2, Oz; the alpha band included Fp1, Fp2, Fz, Fc1, Fc2, Cz, Pz; and the beta band included Fz, Cz, Pz, and Oz. The spectral power for each band was calculated by averaging across the respective temporal and spatial ROIs.
Table 2 presented the spectral power data for the delta, theta, alpha, and beta bands, as well as the power ratios (θ + α)/β, α/β, θ/β, and (θ + α)/(α + β) under the different workload conditions.
Table 2: Power and ratios (mean ± standard deviation) of different workloads in temporal regions of interest and spatial location regions.
Table available in the original PDF paper.
Frequency Low Workload Medium Workload High Workload δ (μV2/Hz) − 0.46 ± 0.91 − 0.51 ± 0.95 − 0.79 ± 1.09
The delta power showed a gradually decreasing trend across the low, medium, and high visual load conditions, primarily over the prefrontal and frontal regions, but this difference was not statistically significant (p > 0.05). In contrast, theta power demonstrated a gradually increasing trend, which reached statistical significance (p < 0.05), concentrated mainly over the parietal and occipital regions. Alpha power exhibited a decreasing trend over the prefrontal, central, and parietal regions, but again, this was not statistically significant (p > 0.05). Regarding the power ratios, θ/β and (θ + α)/(α + β) showed significant differences across the load levels (p < 0.05).
Subsequent multiple comparisons revealed that theta power, the θ/β ratio, and the (θ + α)/(α + β) ratio were all significantly different between the low and medium workload conditions and between the low and high workload conditions (all p < 0.05). However, no significant differences were observed between the medium and high workload conditions for any of these measures (p > 0.05).
Eye-Tracking Feature Analysis Statistical results of the eye-tracking data were presented in Table 3. As shown, fixation count, fixation frequency, saccade count, and saccade frequency all increased with rising visual load. Blink count was lowest under low workload and highest under medium workload, whereas blink frequency decreased as visual load increased. ANOVA confirmed that all six eye-tracking metrics differed significantly across the workload conditions (p < 0.05). Subsequent post-hoc comparisons revealed that for all six metrics, values in both the medium and high workload conditions were significantly different from those in the low workload condition (p < 0.05), but no significant differences were found between the medium and high workload conditions (p > 0.05).
Table 3: Means and standard deviations of eye - movement indicators.
Study revealed the load-dependent effects of visual load on electroencephalographic (EEG) activity through event-related potential (ERP) analysis: the average amplitude of the N1 component (100–180 ms) decreased with increasing load, consistent with previous studies (Allison and Polich, 2008, Horat et al., 2016). This decrease was concentrated in the frontal region, while an increase was observed in the occipital visual cortex. Physiologically, the N1 component is associated with primary visual processing and attention shifting/
Visual Load Evaluation Model of Multi-View Monitoring Task Operator 125 allocation. The increased N1 amplitude in the occipital region may reflect EEG activity related to frequent attention shifts when participants completed the target search task, confirming its sensitivity to visual cognitive load.
The amplitude changes of the P2 component (180–260ms) exhibited task specificity: the amplitude at Cz and Pz electrodes increased with increasing load, concentrated in the parieto-occipital region. The difference from previous studies using auditory tasks to induce load (where P2 amplitude decreased (Takeda et al., 2016)) indicated that the change pattern of P2 amplitude is related to the sensory modality of the load. It may serve as a key ERP component to distinguish between visual and auditory loads, providing a reference for research on the neural mechanisms of cross-modal load. Physiologically, the P2 component is involved in decision-making processes after visual stimulation; the increased P2 amplitude in the parieto-occipital region may reflect that participants need more refined comparison and judgment between stimuli and targets under high load, leading to enhanced EEG activity related to decision-making.
The N1 amplitude at Cz and Pz leads and the P2 amplitude at Pz and Oz leads were significantly different under different visual load conditions (P < 0.05), which could stably capture load-related EEG differences and provide comprehensive ERP evidence for the physiological characterization of visual load. In conclusion, the N1 amplitude at Cz/Pz leads and P2 amplitude at Pz/Oz leads can be used as effective ERP indicators reflecting changes in visual load.
EEG characteristic indicators showed regular changes with increasing visual load. Physiologically, increased θ wave power corresponds to attention distraction, which is consistent with the task scenario in this study where participants needed to frequently allocate and shift attention to complete the target search task, verifying the consistency between the experimental design and physiological indicator responses. Statistics indicated that θ wave power, θ/β and (θ + α)/(α + β) ratio were significantly different between low vs. medium and low vs. high load groups (P < 0.05), highly sensitive to changes in visual load, and capable of clearly distinguishing EEG differences under different loads.
Blink-related indicators showed special changes: blink count peaked at medium load (first increasing and then decreasing), while blink frequency decreased continuously with increasing load. The difference from the previous conclusion that “blink frequency increases under high cognitive load”(Peng et al., 2006) is presumably due to the different task paradigms. In the visual search task of this study, under high load, the search time increased, and participants tended to blink after target localization (i.e., “target-oriented blinking”), resulting in a decrease in blink frequency per unit time. This suggests that changes in blink frequency have task modality specificity and may serve as a key eye movement indicator to distinguish between cognitive and visual loads, providing a new perspective for the objective identification of different types of loads.
Analysis of variance (ANOVA) showed that all six eye movement indicators (fixation count, fixation frequency, saccade count, saccade frequency, blink count, blink frequency) were significantly different between low vs. medium
and low vs. high load groups (P < 0.05), but no significant difference was found between medium and high load groups. From the perspective of human load tolerance mechanism, medium load may be close to the load threshold of the visual cognitive system; at this point, the system is already in a high activation state, and the physiological regulation space for further increasing the load is reduced, hence the non-significant difference. This provided a reference for the classification of visual load: medium load may serve as a “critical reference point”, beyond which human sensitivity to load changes may decrease.
The findings of this study not only corroborated existing theoretical frameworks but also extended them by providing empirical evidence specific to multi-view visual search tasks. Consistent with previous claims that increased view numbers elevated visual workload (Doyon et al., 2014; Innes et al., 2021), our results provided physiological evidence—such as increased theta power and θ/β ratio—reflecting heightened attentional demand. Moreover, the observed decrease in blink frequency with increasing load supported the task-modality specificity of physiological responses (Peng et al., 2006). This study thus contributeed a novel, multi-dimensional physiological characterization of visual workload by systematically linking graded load levels to both EEG and eye movement features.
VISUAL WORKLOAD EVALUATION MODEL The PSO algorithm was integrated with four machine learning classifiers—Support Vector Machine (SVM), k-Nearest Neighbor (KNN), Decision Tree (DT), and Random Forest (RF)—to optimize their parameters and identify the best-performing model. This process led to the development of three distinct evaluation models: one based solely on EEG features, one on eye-tracking features, and one on the fusion of both EEG and eye- tracking features. The seven EEG input indicators and six eye-tracking input indicators for these models were listed in Table 4.
Table 4: Performance of five machine-learning models of mental fatigue classification.
Table available in the original PDF paper.
Physiological Signals Feature Feature Average amplitude of N1 at Cz electrode EEG signals
Average amplitude of N1 at Pz electrode Average amplitude of P2 at Pz electrode
Average amplitude of P2 at Oz electrode Frequency domain θ, θ/β, θ + α/α + β in time-of-interest and spatial-location regions
Eye-movement signals Saccades number, Fixations number, Blinks number, Saccade frequency, Fixation frequency, Blink frequency Data from 30 participants were collected. Valid EEG data were obtained from 27 participants and valid eye-tracking data from 25 participants. To ensure a balanced dataset for model development, the EEG data corresponding to the two participants with missing eye-tracking data were
Visual Load Evaluation Model of Multi-View Monitoring Task Operator 127 removed. Consequently, the final model dataset comprised 75 samples (25 for low, 25 for medium, and 25 for high workload). The dataset was split, with 80% used for model training and 20% held out for testing. Within the training set, 20% was further allocated for validation during training. A 10-fold cross-validation strategy was employed: the dataset was partitioned into 10 roughly equal subsets, and 10 rounds of training and validation were performed. In each round, 9 subsets formed the training set and 1 subset the validation set. The performance metrics from these 10 rounds were averaged to provide a robust evaluation of each model’s performance.
The accuracy, macro-average precision, macro-average recall, and macro- average F1-score were calculated for each model. The results showed that the optimal model based on EEG data alone was the PSO-RF model (number of trees = 100, max depth = 5), achieving an accuracy of 73.3%, with macro-average precision, recall, and F1-score all at 73.33%. The best model based on eye-tracking data was the PSO-SVM model, reaching the highest accuracy of 80%, a macro-average precision of 87.50%, a macro-average recall of 80%, and a macro-average F1-score of 78.02%. Its kernel function was the Radial Basis Function (RBF), with C = 0.2766 and gamma = 6.237. The optimal model based on the fusion of EEG and eye-tracking features was the PSO-KNN model. It achieved the highest accuracy of 86.7%, a macro-average precision of 90.48%, a macro-average recall of 86.67%, and a macro-average F1-score of 86.11%, with the optimal parameter K = 6. Therefore, the PSO-KNN algorithm utilizing fused EEG and eye-tracking features demonstrated the best visual workload evaluation performance in this study.
CONCLUSION
The main conclusions of this study were follows: (1) EEG indicators were sensitive to changes in visual load. The N1 amplitude
(100–180 ms) at Cz/Pz leads, P2 amplitude (180–260ms) at Pz/Oz leads, theta wave power, θ/β, and (θ + α)/(α + β) showed significant differences between low vs. medium and low vs. high load conditions, which can serve as effective physiological markers for distinguishing visual load levels. (2) Eye movement indicators could effectively characterize the gradient changes of visual load. Six eye movement indicators including fixation count and fixation frequency showed significant differences between low vs. medium and low vs. high load conditions; combined with the 7 sensitive EEG indicators, these 13 physiological indicators work synergistically to provide multi-dimensional physiological basis for the quantitative evaluation of visual load. (3) The PSO-KNN model integrating EEG and eye movement features
achieved the optimal visual load evaluation effect.
REFERENCES
Allison, BZ., Polich, J. (2008). Workload Assessment of Computer Gaming Using a Single-stimulus Event-related Potential Paradigm, Biological Psychology, Volume 77, No. 3. Doyon, PP., Ouellette, B., Robert, JM. (2014). Effects of Visual Clutter on Pilot
Workload, Flight Performance and Gaze Pattern, ACM. Friedrich, M., Hamann, A., Jakobi, J. (2020). An Eye Catcher in the ATC Domain: Influence of Multiple Remote Tower Operations on Distribution of Eye Movements, Engineering Psychology and Cognitive Ergonomics (HCII 2020), Volume 12187. Horat, SK., Herrmann, FR., Favre, G., et al. (2016). Assessment of Mental Workload:
A new Electrophysiological Method Based on Intra-block Averaging of ERP Amplitudes, Neuropsychologia, Volume 82. Innes, RJ., Howard, ZL., Thorpe, A. et al. (2021). The Effects of Increased Visual Information on Cognitive Workload in a Helicopter Simulator, Hum Factors, Volume 63, No. 5. Jessee, MS. (2010). Ocular Activity as a Measure of Mental and Visual Workload,
Human Factors & Ergonomics Society Annual Meeting Proceedings, Volume 54, No. 18. Kim, JH., Yang, X. (2017). Applying Fractal Analysis to Pupil Dilation for Measuring Complexity in a Process Monitoring task, Applied Ergonomics, Volume 65. Peng, XW., He, QC., Ji, T. et al. (2006). Mental Workload for Mental Arithmetic
on Visual Display Terminal, Zhonghua Lao Dong Wei Sheng Zhi Ye Bing Za Zhi, Volume 24, No. 12. Takeda, Y., Inoue, K., Kimura, M., et al. (2016). Electrophysiological Assessment of Driving Pleasure and Difficulty Using a Task-irrelevant Probe Technique, Biological Psychology, Volume 120. Van, OKF., Limbert, W., Makeig, S. et al. (2001). Eye Activity Correlates of Workload
During a Visuospatial Memory Task, Hum Factors, Volume 43, No. 1.
LISTED IN THE AHFE DIGITAL BOOKSTORE CATALOGUE
Explore the complete digital volume
Neuroergonomics and Cognitive Engineering
Read this individual research paper free through the original publisher, or explore the full digital proceedings book.
ISBN 978-1-964867-83-0
Explore this ISBN in the AHFE Bookstore ↗Listed in the July 2026 bookstore catalogue; search by ISBN to confirm current availability · Digital book purchase optional