Henri Chajmowicz, Pierre Van Elslande, Laura Bigi, Philippe Lesire, Jean Baptiste Haué, Cyril Chauvel, Stéphane Buffat (2024). Human Drivers and Automated Vehicles team up for the better and the worse: a framework for the analysis of future accidents. In: Human Interaction and Emerging Technologies (IHIET-AI 2024): Artificial Intelligence and Future Applications. AHFE Open Access, vol. 120, pp. 391–402. https://doi.org/10.54941/ahfe1004590
By and large, the so-called “Human Error” is considered as the main cause of traffic crashes – proportions of “more than 90%” of crashes “caused” by human errors are often mentioned in the press, in the political debate, even in scientific literature. By gradually removing the influence of human factors, the introduction of Automated Vehicles (AV) would then allegedly hugely benefit road safety. However, these analyses leave aside a few hard facts: human factors are often found in combination with other types of factors (e.g. environmental, traffic or vehicular) as generators of road crashes. Indeed, some studies suggest that it is only in about half of the fatal road crashes that human factors are the sole contributors – and can hence be labelled as “sole causers”. Confusions often arise because only the main or the final failure leading to the crash is mentioned by e.g., police forces collecting accident data. Moreover, precise analyses of crash-producing mechanisms highlight human factors relating to failures in the driving functions (e.g., perception failure, lack of anticipation, wrong decision) and human factors explaining these driving failures (e.g., low alertness or attention). AV will remain prone to the former type of failure and will avoid the latter to replace them with entirely new types of failures (e.g., inability to properly identify and classify an obstacle, to assess the intentions of other road users in mixed traffic). All these issues require new analysis models for retrieving the relevant information when collecting accident or safety critical event data and suggesting new road safety measures. Having recently published an entirely new Automated Driver Functional Failures (ADFF) model and an updated taxonomy for Human Functional Failures (HFF) leading to road crashes in the context of shared or delegated driving tasks between human and automated drivers, the authors propose to address, in the present paper, the Explanatory Factors for both types of failures. The analysis of traffic crashes shows that automated drivers didn’t perform as well as human drivers when confronted with conditions impairing their perception system or when driving in a complex environment. Most worrying would be that this complexity could result from failure to identify other road users or obstacles. Finally, although the introduction of AV could suppress some accident-causing human failures, e.g., willful violations of road rules, new features explaining human failures would appear, of which overtrust in AV out of ignorance of the automation’s limits would be an example.
In the field of road accidents, studies often tend to confuse the analysis of causes with the search for responsibility. Such confusion leads authors to
incriminate “human error” or “the human factor”, with no clear distinction between these notions, as the major cause of accidents in proportions ranging from 70% to over 90% (e.g., Medina et al., 2004; Karacasu and Er, 2011). In the final analysis, this amounts to stigmatizing road system users as the culprits behind most of its malfunctions. The disadvantage of a generalizing approach of this kind is that it fails to take into account the finesse and com- plexity of the processes and factors at play in accident dynamics. The result is to considerably limit the means of preventing their production. Scientific work using in-depth analysis of traffic accidents shows the need to develop appropriate analysis models to better characterize the difficulties and factors facing users of the driving system at the various stages of the process lead- ing up to a collision (e.g., Ljung, 2017; Van Elslande and Fouquet, 2017). In particular, these models make it possible to distinguish, within the human component of the system, between the malfunctioning factors, on the one hand, and what constitutes the result of this malfunctioning on the driver’s activity, on the other. This ultimately boils down to distinguishing between (human) causes and their effects (on human activity). And such a distinc- tion is essential, as shown below, in view of the development of autonomous vehicles and the sharing of driving tasks between the human operator and the driving automaton.
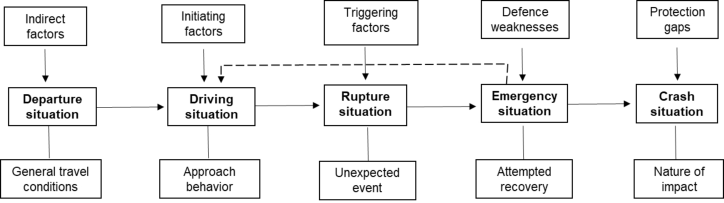
A Sequential and Systemic Analysis of Accident Process The fundamentally dynamic nature of driving activity means that the acci- dents that occur during it are events that unfold in space and time, according to a progression that it is useful to apprehend in order to understand the mechanisms by which they are produced. The first step in accident analy- sis is to reconstruct the kinematics of the sequence of events. Each accident can thus be modelled as a series of chronologically linked sequences (Girard, 1993; Guyonvarch et al., 2019). The sequential analysis model shown in Figure 1 sets out the key stages in the accident process and the differentiated influence of the factors involved at each sequential stage. The characteriza- tion of these “situations” enables to break down the various chronological stages of the accident in a consistent way, and to facilitate a systematic anal- ysis. For each of these situations, once described from a sequential point of view, the functional analysis described below will enable the explana- tory mechanisms to be identified. With particular reference to the study of “human factors” within the accident process, this functional analysis will enable to identify 1) the failures in driver activity, and 2) the elements explaining these driver failures.
Moreover, contemporary research defends the need to rely on systemic models to understand the complex nature of accidents, and particularly to account for the role played by the human component in the genesis of dys- functions (Hollnagel, 2004; Dekker, 2004; Reason et al., 2006; Rasmussen, 1990). According to this approach, an accident is part of a socio-technical sys- tem. It is the result of the complex combination of different orders of factors which have a more or less direct influence on malfunctions. From this point of view, the unsafe acts of operators (human errors) are not considered as
Human Drivers and Automated Vehicles Team Up for the Better and the Worse 393
the cause of the deterioration of situations, but as the consequence of a set of failing material and/or organizational conditions, which the accident reveals. Nevertheless, these human errors mark a key stage in the process, a breaking point between a situation that has been satisfactorily mastered up to now and a situation that has deteriorated to the point of requiring an attempt at recovery in the form of an emergency maneuvers (Figure 1). These are there- fore essential to identify in order to fully understand the precise nature of the difficulties encountered by the drivers, which they were unable to control adequately and in a timely manner. But human errors also need to be clearly distinguished from the factors that led to them, whether human, technical or organizational, so as not to confuse causes and effects. And this becomes all the more important when thinking to analyze the potential problems linked to the development of autonomous vehicles, to the extent that these vehi- cles, even if they will not be subject to the human factors, could be likely to produce functional failures (driving errors) when confronted to some critical situations (Chajmowicz et al., 2023).
Figure 1: Sequential accident analysis model (adapted from Van Elslande, 2023).
Functional Failures and Factors of Failures A crucial point in distinguishing between human error and human factors is to clearly differentiate between 1) a failure of any of the functions that road users put forward to perform their driving task, and 2) the human factors that contribute to the failure of these operational functions. Indeed, it is important to bear in mind that, at least so far, the road user is both a component of the driving system and the regulator of that system in the end.
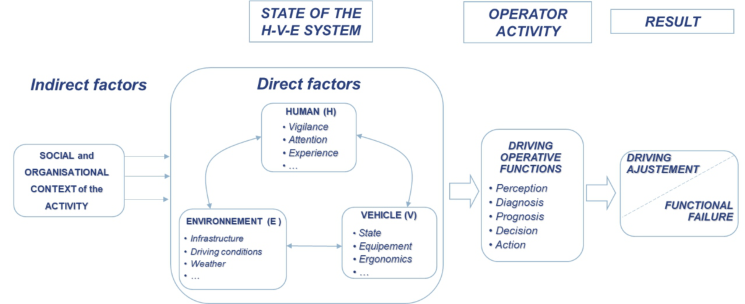
As a component, the human part is characterized, like other components, by a number of variables which are in a more or less positive state for the proper functioning of the system as a whole. These human factors include vigilance, attention, motivation, etc. (Figure 2). And as the system’s final reg- ulator, he/she is in charge of the driving task, which he/she carries out by implementing a number of operating functions, ranging from perception to action, via cognitive functions such as comprehension, anticipation, decision making, etc. And the result of these operating functions is - most of the time – a correct adaptation to the driving situation. But there may be times when the system’s condition is too degraded for the driving functions to adapt. When this happens, it can lead to the failure of one or more of these opera- tional functions. As the incriminated functions fail to adapt to the situation,
the result is what is generally referred to as a “human error”, and which has been systematized in previous research works (e.g., Van Elslande, 1997; Van Elslande and Fouquet, 2007) under the label “functional failure”. An advantage of this terminology is that it highlights the fact that these are the same functions that allow the driver to adapt to the situation and which can sometimes fail if the conditions for carrying out the task are too imperfect. Another advantage is that it can be applied to both the human driver and the automated vehicle in the sense that these two entities must have access to the same functions, even if they use different tools, to perform the driving task.
Figure 2: Road user as a component and a regulator of the driving system (adapted from Van Elslande and Fouquet, 2007).
The in-depth analysis of hundreds of accidents has led to the definition of analysis grids that can account for the functional failures to which road users are subject in traffic accidents. In line with what has been defined above, a first grid reports functional failures produced at the different stages of infor- mation processing and execution of action, and a second grid accounts for the factors of these functional failures, including the human factors corre- sponding to the state of the driver in terms of psychophysiological condition, experience, attention, motivation, etc. The aim of these grids is to highlight the mechanisms that explain the production of the different kinds of driving errors committed by road users, in relation to the driving context in which they occur, and the different orders of factors that have more or less directly contributed to them. Numerous research studies using these analysis models have been carried out during the last decades, enabling us to characterize the specific nature of the problems encountered by different driver populations (e.g., elderly rivers, powered two wheelers, etc.) and the critical influence of typical factor such as vigilance, alcohol, cannabis, inattention, etc. (e.g., Van Elslande et al., 2008; 2012; Van Elslande and Fleury, 2000; Hoel et al., 2011). However, the application of these grids to the analysis of accidents or near-accidents involving automated vehicles requires a number of adjust- ments, both in terms of the potential failures of the vehicle itself, and those of the drivers who share their driving task with the automated functions
Human Drivers and Automated Vehicles Team Up for the Better and the Worse 395
of their vehicle, a task-sharing that can lead to new kinds of errors (e.g., misunderstanding of the activation state of the autopilot, overreliance in its capacity, etc.). The development of these new grids of analysis is the subject of a multi-disciplinary collaborative work between LAB and Gustave Eiffel University.
In order to explain the usage of the functional failure and their explana- tory factors, the authors provide use cases to detail the correct attribution of these factors. The next sections contain descriptions of road crashes involv- ing conventional and automated vehicles as well descriptions of a corpus of near-crashes.
A Typical Example Involving Only Human Drivers (No Automation) Description: At an intersection, a vehicle slowly turned right, the following two vehicles consequently reduced their speed to a complete stop. Coming from behind, the driver of vehicle A did not notice that the traffic ahead had stopped. He braked and changed line to the left, accelerating and flashing headlights in the hope that the oncoming vehicle B would slow down. That didn’t occur and a small overlap frontal impact resulted.
Human Failures, Explanatory Elements: The driver of the vehicle A tardily detected the stopped vehicles ahead. Explanatory elements are speeding, dis- regard for risks associated with the spot (that he routinely travelled through) and overconfidence in his own driving abilities and signals sent to/by other road users.
The vehicle B driver didn’t know how to react in this encounter of unusual traffic circumstances. Explanatory elements for this are that he was confi- dent that his vehicle had been seen and anticipated that the oncoming vehicle would yield.
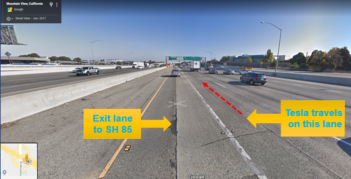
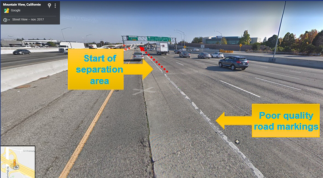
A TYPICAL EXAMPLE INVOLVING HUMAN AND AUTOMATED DRIVER Information in this section was retrieved from the 2020 NTSB Highway Accident Report on the fatal crash in Mountain View, California, March 23, 2018. Description: The Tesla was travelling on the left lane of the highway, with autopilot cruise control set on a head vehicle travelling in the same lane (Figure 4).
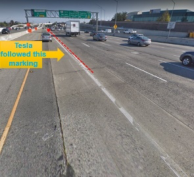
Because of the low quality of the road marking (Figure 5), the Tesla’s lane keeping feature mistook the left-hand side marking of a gore highway sepa- ration zone for the actual left lane marking and steered the vehicle left, with a new constant heading of a few degrees more than the original safe heading. In doing so, cruise control lost the head vehicle and had the Tesla accelerate over the highway separation gore area (Figure 6) and approach the highways lane separator at great speed (est. 114 km/h).
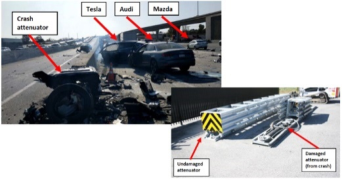
Finally, the Tesla crashed into the separator that had been damaged from a previous crash weeks before (Figure 7). Two other vehicles were involved in a secondary collision with the Tesla, whose driver died at the hospital.
Figure 4: Crash area approach #1.Figure 5: Crash area approach #2.
Failures and their explanatory elements: Failures leading to the crash can be attributed to both the Tesla’s automated driver and human driver, as they shared the driving task.
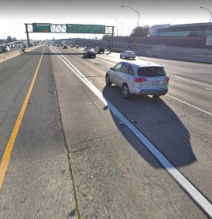
The Tesla’s automated driver failed to plan a safe trajectory for the vehicle. Explanatory element is the poor quality of the road markings, that were last painted anew years before crash and repainted post-crash (Figure 8).
Human Drivers and Automated Vehicles Team Up for the Better and the Worse 397
Figure 6: Crash area approach #3.Figure 7: Crash scene.Figure 8: A few months after crash.
We may notice that the automated driver underperformed as compared to the thousands of human drivers travelling through the place daily.
In the instants preceding the crash, the Tesla’s human driver was hands off the wheel. He made no effort to avoid the crash when he had 7 sec- onds to react to the vehicle leaving its intended course. This is a new kind of human driver failure. Explanatory factor is overtrust in the automated driver, a consequence of routine usage by this seasoned human driver.
LESSONS FROM PRESENT DAY SAE LEVEL 4 AUTOMATED VEHICLES TESTS We chose to analyze the year 2022 disengagement reports dataset of the Department of Motor Vehicles (DMV) in California. Autonomous vehicle manufacturers that are testing vehicles in the Autonomous Vehicle Tester (AVT) Program and AVT Driverless Program are required to submit annual reports to share how often their vehicles disengaged from autonomous mode during tests on open roads. This dataset contains details on automated
drivers’ failures and their explanatory elements. It is larger than its counter- part on collisions reports. As an example, in 2022, there were less than 150 collisions reported but more than 8000 disengagements. Upon analyzing the latter, we found a wide array of text verbatims of incidents, as all operators have their own ways of describing issues. After solving this, we found that explanatory factors belonged to a handful of categories:
Present in nearly 25% of disengagement cases were the hardware and software malfunctions explanatory elements.
The second type of explanatory factors (present in about 20% of cases) was bad assessment of either the behavior of other road users or the environment (includes road and signals layouts)
The third type consisted in identification errors: obstacles, road edges, other road users were not identified or not as interfering with the auto- mated driver’s path, so safety drivers intervened.
The fourth type of explanatory factors were decision or attitude issues with road rules. Automated drivers were found aggressive or exceedingly careful, even blocking traffic to avoid a slight road rule infringement.
Other explanatory elements consisted of cartography discrepancies, detec- tion failures due to poor perception systems or hampering by e.g., poor weather and execution errors such as going too fast in sharp bends.
TOWARDS A COMPREHENSIVE LIST OF EXPLANATORY FACTORS Bearing the analyses hereabove in mind, also willing to elaborate a simplified version of earlier preliminary works (Alvarez, 2017) for practical use in the field, we suggested grids for human and automated drivers’ failures in crashes and near crashes (Chajmowicz et al., 2023). From this study, the main Auto- mated Driver (AD)-related headers in the Human Driver (HD) Functional Failure grid were:
Table 1. Headers in the HD Functional Failure grid concerning AD.
Table available in the original PDF paper.
Domains Type of failure Code SAE Perception No or careless monitoring of AD by HD A4:5 L2:4 Diagnosis HD not aware of AD status as seen through HMI B5 L1 Prediction HD expects AD to perform tasks it cannot perform C4 L1 Decision HD disconnects AD or ignores its warnings D4 L1 Decision HD tricks AD to be able to engage in secondary task D5 L2 Execution HD cannot handle when requested to take over by AD E1:2.10 L1:4
and the main headers in the Automated (AD) Functional Failure grid were:
Table 2. Main headers in the AD Functional Failure grid.
Table available in the original PDF paper.
Domains Type of failure Code SAE Detection No or only partial detection by AD sensors A1:4 L1 Diagnosis Poor assessment of road layout by AD B1 L1 Diagnosis Poor assessment by AD of HD status or action B2 L1
Continued
Human Drivers and Automated Vehicles Team Up for the Better and the Worse 399
Table 2. Continued Domains Type of failure Code SAE
Table available in the original PDF paper.
Diagnosis Poor assessment of vehicle environment by AD B3 L1 Diagnosis Poor identification of other road user or obstacle by AD B4 L1 Diagnosis Poor understanding by AD of other road user’s behavior B5 L2 Prediction Poor reaction of AD to unexpected maneuver by other C1 L2 Prediction Poor reaction of AD to no correction by other road user C2 L2 Execution AD disregards safety rule (e.g., speed limit) by mistake D1 L1 Execution Inappropriate AD action when faced with hazard D2 L1 Execution AD is unable to perform the driving task F1:2 L2 Homicide Offensive remote take-over of AD H1 L2 None No failure Z L1
In Tables 1 and 2, SAE refers (unless stated otherwise) to the minimal automation level of the AD-equipped vehicle, with reference to the SAE grid (SAE, 2021). For instance, only vehicles with SAE level L2 and above would be prone to types of failures tagged “L2”. “Code” refers to the reference numbering in our grids.
Only for SAE L5 vehicles are AD failures the sole causers of crashes. In all other cases, the HD should supervise the AD: not doing so is an HD failure that can lead to a crash if the AD also fails.
For all those failures, we could identify explanatory factors. Tables 3 and 4 list factors concerning the direct interactions between HD and AD. Of course, many more explanatory factors concerning indirect interactions exist and are also part of our coding tables: for instance, Human Drivers’ attention may be drawn away from the task of supervising AD by any kind of in- vehicle (e.g., mobile phone) distractor. HD-like, AD’s perception might be hampered by bad road or lighting conditions. We chose to concentrate on direct interactions, for the sake of brevity.
Table 3. Explanatory factors for AD-related HD Functional Failures.
Table available in the original PDF paper.
Experience U.X.1.3.5 Poor experience of interactions with AD U.X.1.3.8 Poor understanding of AD’s HMI U.X.2.3.1 Overconfidence in AD capabilities U.X.2.3.2 Overconfidence in V2X Communication Attention U.A.1.1.2.18 HD distracted by one or more signals from AD U.A.1.2.2.4 HD’s attention drawn by AD audio signal while driving U.A.1.3.2.4 HD’s attention drawn by AD visual signal while driving U.A.1.3.2.4 HD’s attention drawn by AD haptic signal while driving U.A.2.2.1 The HD was in a phase of supervision (without action) of driving delegated to the AD
Table 4. Explanatory factors for AD Functional Failures (Part 1).
Table available in the original PDF paper.
Malfunctions AD.U.E.1.1 In-vehicle perception sensor malfunction (e.g., broken, scratched, flooded, mudded, ill-maintained) AD.U.E.1.2 In-vehicle actuator malfunction (e.g., broken, ill-maintained) AD.U.E.1.3 Poor transmission of information between sensors and actuators AD.U.E.1.4 Poor transmission of information from sensor to HMI / HD AD.U.E.1.5 In-vehicle V2X transmitter/receiver malfunction AD.U.E.1.6 External HMI malfunction Defects AD.U.E.2.1 Software (e.g., planning own or others’ trajectory) error, timeout AD.U.E.2.2 Misleading or no information from sensor to -HMI / HD AD.U.E.2.3 Misleading or no information from V2X receiver to HMI / HD AD.U.E.2.4 Defective or obsolete internal map of driving environment AD.U.E.2.5 Defective learning database for other users or environment identification AD.U.E.2.6 Defective prediction algorithm for other users’ intents AD.U.E.2.7 Defective prediction algorithm for hazards / dangers
Compliance with road rules
AD.U.E.3.1 Strong identification with priority status AD.U.E.3.2 Strong identification with non-priority status AD.U.E.3.3 Strict compliance to road rules resulting in no possible path for progression AD.U.E.3.4 Strict compliance to road rules regardless of surrounding traffic flow
EXAMPLES Concerning the no automation crash described in this paper, the vehicle A driver tardily detected the stopped vehicles ahead (HD.A5.1). Explanatory elements are speeding (U.E.4.1.1) and overconfidence (U.E.3.2.1). The vehi- cle B driver expected vehicle A to yield (HD.C2.3). Explanatory elements for this are that he was confident that his vehicle had been seen (U.E.3.6.1).
Concerning the Tesla accident, the AD failed by poorly assessing the road layout (AD.B1). The most obvious explanatory factor for this is the poor quality of road markings (E.S.2.3), poor cartography (AD.U.E.2.4) may have played a part. The HD failed in monitoring the AD (HD.A5.6), explana- tory factors are overtrust in AD capacities (U.X.2.3.1) and engaging in a secondary task (U.A.1.1.2.9).
Concerning the California disengagement dataset, all HD supervisors are flawless (HD.Z). AD mostly had AD.F1:2-type of failures, with explanatory factors mostly AD.U.E.1.1, AD.U.E.1.2 and AD.U.E.2.1.
Human Drivers and Automated Vehicles Team Up for the Better and the Worse 401
CONCLUSION
Departing from the previous analysis grids of road crashes that only take into account human drivers’ failures, we set up new grids encompassing human and automated drivers’ failures and their explanatory elements. These can now help researchers to analyse crashes and near crashes in the whole array of delegated driving modes (from SAE levels L1 through L5).
REFERENCES
Alvarez, S. (2017). Safety benefit assessment, vehicle trial safety and crash analysis of automated driving: a Systems Theoretic approach. PhD Thesis, Paris Sciences et Lettres (PSL) Research University. Chajmowicz, H., Bigi, L., Lesire, P., Chauvel, C., Haué, J-B., Buffat, S., Van Elslande,
P. (2023). From human driving errors to automated vehicle functional failures: theoretical and methodological issues. 35 ICTCT Conference, Catania, Italy. 27– 28 October. Department of Motor Vehicles – State of California. Disengagement Reports 2022 from the Autonomous Vehicle Tester (AVT) Program and AVT Driverless Program. Website: https://www.dmv.ca.gov/portal/vehicle-industry-services/autonomous-v ehicles/disengagement-reports/ (consulted Dec. 1st, 2023). Girard, Y. (1993). In-depth investigation of accidents: the experience of INRETS at
Salon-de-Provence. International Congress on Safety Evaluation of Traffic Sys- tems, Traffic Conflicts and other Measures. ICTC Congress, Salzburg, October 1993. L. Guyonvarch, et al., (2019) “Data Driven Scenarios for AD/ADAS Validation”, TRB 2020, Washington DC. Hoel J., Jaffard M., Boujon C., Van Elslande P. (2011). Different forms of attentional
disturbances involved in driving accidents. IET Intelligent Transport Systems, 5, 120–126. Karacasu, M., Er, A. (2011). An analysis on distribution of traffic faults in accidents based on driver’s age and gender: Eskisehir case. Proc. Soc. Behav. Sci., 20, 776–785. Ljung, M. (2007). Manual for SafetyNet accident causation (5.2). European Safe-
tyNet project. Medina, A. L., Lee, S. E., Wierwille, W. W., Hanowski, R. J. (2004). Relationship between infrastructure, driver error, and critical incidents. In: Proceedings of the Human Factors and Ergonomics Society 48th Annual Meeting, pp. 2075–2080. NTSB Highway Accident Report “Collision Between a Sport Utility Vehicle Oper-
ating With Partial Driving Automation and a Crash Attenuator Mountain View, California March 23, 2018” (2020). Website (consulted Dec. 1st, 2023): https://www.ntsb.gov/investigations/AccidentReports/Reports/HAR2001.pdf. SAE Standard J3016_202104 (2021). Taxonomy and Definitions for Terms Related to Driving Automation Systems for On-Road Motor Vehicles. Van Elslande, P. (1997). Classifying “human errors” in road accidents. In T. Seppälä,
T. Luopajärvi, C.-H. Nygård et M. Mattila (Eds.), From experience to innovation. Helsinky: Finish Institute of Occupational Health. Van Elslande, P., Elvik, R. (2012). Powered two-wheelers within the traffic system.
Accident Analysis and Prevention, 49, 1–4. Van Elslande, P., Fleury D. (2000). Elderly drivers: what errors do they commit on the road? In: “Ergonomics for the new millennium”, 14th IEA congress, San Diego, USA, 3, 259–262.
Van Elslande, P., Fouquet, K., (2007). Analyzing ‘human functional failures’ in road accidents. Final report. Deliverable D5.1, WP5 “Human factors”. European TRACE project. Van Elslande P., Fournier, J-Y., Jaffard M. (2012). “Influence of Cannabis on Fatal
Traffic Crashes: Detailed Analysis”. Transportation Research Records, 2281, 43–50. Van Elslande, P., Jaffard, M, Fouquet, K, Vatonne, V. (2008). Variety of attentional failures in traffic accidents. European Conference on Cognitive Ergonomics 2008 (ECCE2008). Madeira, Portugal, 16–19 September. Van Elslande, P., Jalais, C., Rodon, C., Parraud, C. (2023). Guide pour la prise
en compte des facteurs humains dans les analyses des accidents du transport terrestre. Rapport final du projet MACH-BEA-TT, Convention de subvention n
RP1-F21189. 103 p.
LISTED IN THE AHFE DIGITAL BOOKSTORE CATALOGUE
Explore the complete digital volume
Human Interaction and Emerging Technologies (IHIET-AI 2024): Artificial Intelligence and Future Applications
Read this individual research paper free through the original publisher, or explore the full digital proceedings book.
ISBN 978-1-958651-96-4
Explore this ISBN in the AHFE Bookstore ↗Listed in the July 2026 bookstore catalogue; search by ISBN to confirm current availability · Digital book purchase optional