Karan Shah, Lars Weber, Andreas Luedtke (2026). Empirical Validation of Human-Centered Driving Style Parameterization in Highly Automated Vehicles. In: Human Interaction and Emerging Technologies (IHIET-AI 2026): Artificial Intelligence and Future Applications. AHFE Open Access, vol. 201, pp. 179–189. https://doi.org/10.54941/ahfe1007172
Trust and acceptance of highly automated vehicles (HAVs) are strongly influenced by how automated driving behavior aligns with user expectations and perceived driving styles. Prior work has shown that users can meaningfully interact with parameterized driving styles for automated vehicles and converge on stable preferences when supported by intuitive human-machine interfaces (HMIs) (Forster et al., 2019, Bellem et al., 2016). However, it remains unclear whether these preferences correspond to users’ natural manual driving behavior at the level of executed vehicle dynamics. This paper builds on earlier work (Trende et al., 2019) that defined semantic automated driving styles for highway scenarios by presenting a validation study and a behavioral comparison between manual and automated driving. Fourteen participants completed a driving simulator experiment consisting of a combination of manual and automated driving sessions in which they adjusted driving style parameters using a graphical HMI. Objective vehicle performance data were recorded in both conditions and driving style features capturing speed, smoothness, lane positioning and time headway were extracted. Clustering analysis revealed distinct driving style groups for both manual and automated driving. Participant wise similarity analysis, however, showed that preferred automated driving behavior often differed from participants’ manual driving behavior. Automated driving was consistently characterized by lower speeds, smoother acceleration, more centered lane positioning and larger following distances. These findings indicate that while users can converge on stable automated driving style preferences, such preferences do not necessarily reflect imitation of their own driving behavior. Instead, users appear to favor automated behavior that emphasizes comfort and perceived safety. The results highlight the importance of combining predefined driving style presets with flexible personalization mechanisms when designing user-centered automated driving systems.
As automated driving technologies advance, understanding how users perceive and evaluate automated vehicle behavior has become a central concern in human factors research. Beyond technical performance and objective safety, the way an automated vehicle drives, its speed selection,
smoothness, lane positioning and interaction with surrounding traffic plays a critical role in shaping user comfort, trust and acceptance (Lee & See, 2004; Bengler et al., 2014). These aspects are commonly summarized under the notion of ‘driving style’, which captures qualitative differences in vehicle behavior that are readily perceived by human users.
In manual driving, individual driving styles emerge from a combination of experience, personality, risk tolerance and situational context. Research has shown that drivers are sensitive to differences in longitudinal and lateral behavior and that these differences influence subjective evaluations of comfort and safety (de Winter, 2014). In automated driving, similar sensitivities have been observed, with trust and acceptance depending not only on system reliability but also on whether automated behavior is perceived as appropriate and predictable (Beggiato & Krems, 2013). To address these challenges, recent research has explored personalization of automated driving behavior. In particular, parameterized and semantically labeled driving styles have been proposed as a means of enabling users to understand and influence automated vehicle behavior. When combined with intuitive HMIs, such approaches can increase transparency and perceived control, both of which are important antecedents of trust (Bengler et al., 2014, Endsley, 1995). However, a key assumption underlying many personalization approaches is that automated driving behavior should resemble an individual’s natural manual driving style. While this assumption is intuitive, it has rarely been tested directly at the level of executed driving behavior. This paper addresses this gap by examining the relationship between manual driving behavior and preferred automated driving styles using objective performance data. The work presented here should be understood as a direct extension of earlier research on semantic automated driving styles. Rather than re-evaluating the parameterization itself, the present study builds on this foundation to examine how automated driving preferences relate to users’ natural manual driving behaviour.
BACKGROUND AND PRIOR WORK Driving style has been studied extensively in the context of manual driving (Sagberg et al., 2015), where it has been linked to safety outcomes, comfort and driver workload. In automated driving, driving style has gained renewed attention as a design variable that can influence user acceptance and trust. Studies have shown that automated systems perceived as overly aggressive or overly cautious can reduce comfort and increase dissatisfaction, even when safety margins are maintained (Gold et al., 2015). Human–machine interfaces play a crucial role in shaping how users experience automated driving. Interfaces that expose driving style parameters allow users to form more accurate mental models of system behavior and to adjust automation to their preferences. Prior work suggests that simple, interpretable interfaces are particularly effective in supporting user engagement and reducing cognitive effort (Martens & Jenssen, 2012).
Empirical Validation of Human-Centered Driving Style Parameterization 181 Within this context, earlier work by the authors’ research group proposed a human-centered parameterization of automated highway driving styles. By systematically varying longitudinal and lateral control parameters, three semantic driving styles: defensive, relaxed and sporty were defined. A subsequent validation study demonstrated that users could meaningfully interact with these parameters through an HMI and often converged on stable preferred configurations (Trende et al., 2019). While these results support the feasibility of semantic driving style personalization, they do not clarify how such preferences relate to users’ natural driving behavior.
In the earlier study, automated highway driving behavior was parameterized using interpretable control parameters related to speed selection, time headway, lateral acceleration and merging distance. Parameter ranges were derived across common highway driving scenarios, including car-following, lane changes and curve negotiation. Based on these parameters, three baseline semantic driving styles were defined. The defensive style emphasized large following distances and conservative accelerations, the relaxed style represented a balanced configuration aimed at maximizing comfort and the sporty style allowed more dynamic longitudinal and lateral behavior while remaining within safety constraints.
A validation experiment showed that participants could understand and adjust these parameters effectively using a graphical HMI. Most participants converged on a stable parameter set and predefined style presets were frequently selected, highlighting the usefulness of semantic labels. Clustering analysis further suggested alignment between user selections and established psychological profiles of driver behavior. However, this study did not directly compare automated driving behavior to participants’ manual driving behavior at the level of vehicle dynamics.
STUDY DESIGN AND METHODOLOGY The study employed a within-subjects design consisting of two main experimental conditions:
1. Manual Driving Condition: Participants manually drove the simulated vehicle along a highway route. They were instructed to drive as they normally would, obeying traffic rules and maintaining safe behavior.
2. Automated Driving Condition: Participants experienced automated highway driving and were provided with a human–machine interface (HMI) that allowed them to adjust key driving style parameters. These parameters influenced the automated vehicle’s behavior in terms of speed selection, acceleration characteristics, lane-changing behavior, following distance, and curve handling.
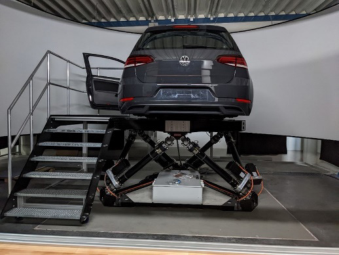
Figure 1: VW Golf 7–based driving simulator mounted on a 6-DOF Moog hexapod with a 210° projected field of view and integrated mirror and cockpit displays.
The order of conditions was kept consistent to ensure that all participants had prior exposure to the driving environment before interacting with the automated system. This approach reduced confounding effects related to unfamiliarity with the simulator.
The simulator consisted of a VW Golf 7 cabin mounted on a 6degree-of- freedom hexapod motion system by Moog. The main visualization consisted of 3 Barco FL40 4K projectors and covered 210 degrees front / side view. All three mirror views (2 exterior and 1 interior) were available via displays in / at the original mirror cover locations and there was a cockpit display, too. The application that the participants used to adjust the automation system parameters was shown on the upper centre stack display. The traffic scenario, all road and environment models were created with the commercially available driving simulation software SILAB v7.11. This software came with an ego-vehicle dynamics module which was coupled to the motion system of the simulator. The automation systems are a continuous and ongoing development by DLR-SE for about 10 years already and they are implemented in C++ modules loaded by SILAB.
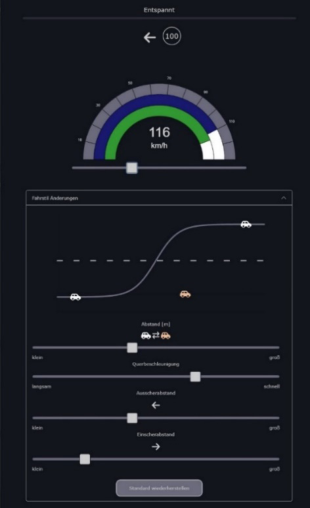
The HMI was designed to allow participants to intuitively modify automated driving behavior along several dimensions commonly associated with driving style. Participants could adjust parameters related to speed consistency, acceleration aggressiveness, lane-changing behavior, overtaking behavior and following distance. During the automated driving condition, participants were encouraged to explore different settings and select parameter values that they felt resulted in a comfortable and acceptable automated driving experience. The HMI adjustments directly influenced the vehicle’s control algorithms, enabling participants to experience the effects of their choices in real time.
1https://wivw.de/en/silab-2/
Figure 2: The HMI gave the users the possibility to change the THW for initiating the overtaking maneuver, the lateral acceleration and the distance for initiating a lane- change to complete the overtaking maneuver.
DATA COLLECTION AND FEATURE EXTRACTION For both manual and automated driving conditions, objective vehicle performance data were collected continuously. From these time-series data, a set of summarized driving style features was extracted for each participant and condition. These features were selected to capture key aspects of longitudinal and lateral driving behavior relevant to comfort and perceived safety:
1. Mean speed 2. Mean absolute jerk (as a measure of smoothness) 3. Mean absolute lateral position deviation (as a measure of lane centering) 4. Mean time headway to leading vehicles These features were computed per participant for both manual driving and automated driving configuration selected via the HMI.
Driving style features were analyzed using unsupervised learning techniques to identify characteristic driving style clusters for manual and automated driving separately. K-means clustering was applied to standardized feature sets and principal component analysis (PCA) was used for dimensionality reduction and visualization. To assess the relationship between manual driving behavior and automated driving preferences at the individual level, a participant-wise similarity analysis was performed. For each participant, standardized feature vectors representing manual and automated driving
were compared using Euclidean distance and cosine similarity metrics. In addition, raw feature differences (“automated minus manual”) were computed to quantify systematic behavioral shifts between conditions.
RESULTS
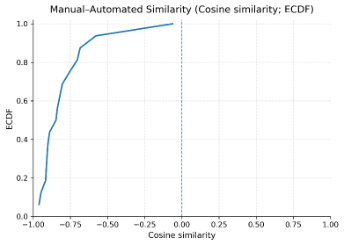
Clustering analysis revealed distinct driving style clusters in both manual and automated driving conditions. The clusters differed primarily along dimensions related to speed, smoothness, lane-keeping behavior and following distance. In the automated driving condition, clusters reflected varying preferences for conservative versus more dynamic driving behavior. Some participants preferred slower speeds, smoother acceleration and larger following distances, while others selected comparatively more assertive automated behavior. Manual driving clusters similarly captured differences in natural driving behavior, though the participant-wise similarity analysis revealed that manual driving behavior and preferred automated driving styles were generally not closely aligned. Euclidean distances between manual and automated driving feature vectors ranged from low to moderate values, indicating varying degrees of similarity across participants. Cosine similarity values were predominantly negative, suggesting that the direction of automated driving preferences was often inversely related to participants’ natural manual driving behavior. This indicates that participants tended to select automated driving styles that differed systematically from how they drove manually. Across all participants, consistent trends were observed in the feature-level differences between conditions. Automated driving was characterized by lower mean speeds, smoother acceleration profiles (lower jerk), more centered lane positioning and larger time headways compared to manual driving. These patterns were observed regardless of participants’ manual driving style cluster.
Figure 4a and 4b: The difference in the mean jerk values and mean deviation from lateral position between manual and automated driving (clusters indicated with respective colors).
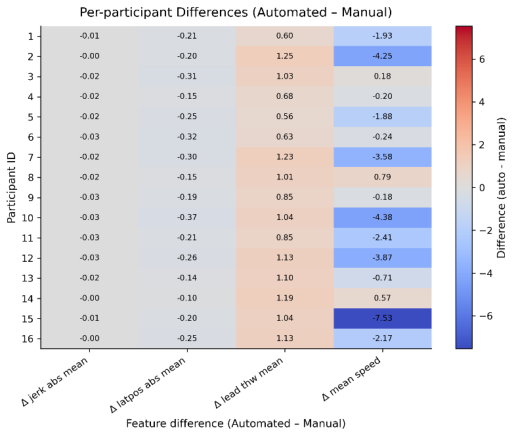
Figure 5: Heatmap showing feature differences between manual and automated driving.
Similarity visualizations further illustrated these findings. Participant-wise bar plots of Euclidean distance highlighted individuals whose automated preferences closely matched or diverged strongly from their manual behavior. Two-dimensional similarity maps combining Euclidean distance and cosine similarity revealed clear separation between participants with relatively aligned versus highly divergent driving styles. Heatmaps of feature differences showed consistent directional shifts across participants, with automated driving favoring smoother, slower and more conservative behavior. Cluster- based analyses indicated that similarity patterns were more strongly associated with automated driving clusters than with manual driving clusters.
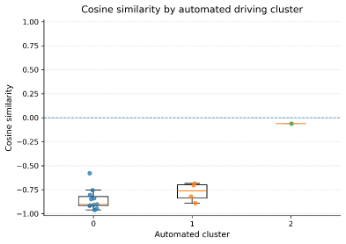
Figure 6: The cosine similarity between automated driving clusters and the respective manual driving clusters.Figure 7: An empirical cumulative distribution function plot of cosine similarity between manual and automated driving.
The results of the clustering analysis, as visualized in Figures 3a and 3b through Principal Component Analysis (PCA) projections, identified three distinct driving style clusters: conservative, standard, and aggressive, for both manual and automated driving conditions. While participants were grouped into these clusters, the participant-wise similarity analysis revealed a lack of alignment between an individual’s manual driving behaviour and their preferred automated driving style. This divergence is further illustrated in Figures 4a and 4b, which highlight consistent shifts toward smoother acceleration (lower jerk) and more centered lane positioning during automated driving regardless of the participant’s manual cluster. These behavioral differences are quantified in the heatmap in Figure 5, showing systematic reductions in mean speed and increases in time headway when participants transitioned from manual to automated control. Furthermore, Figure 6 displays a negative cosine similarity between manual and automated driving clusters for most participants, suggesting that automated preferences are often inversely related to natural manual behavior. This trend is corroborated by the Empirical Cumulative Distribution Function (ECDF) plot in Figure 7, which underscores that the majority of participants favored automated driving characteristics that emphasize comfort and safety over the imitation of their own manual driving styles.
DISCUSSION
The results of this study provide important clarification regarding the relationship between manual driving behavior and preferred automated driving styles. While earlier validation work demonstrated that users can meaningfully personalize automated driving parameters and often converge on stable driving style configurations, the present findings indicate that such convergence does not necessarily imply behavioral equivalence between manual and automated driving.
Participant-wise similarity analysis revealed that automated driving behavior was systematically more conservative than manual driving across all examined features, including speed, smoothness, lane positioning and following distance. Negative cosine similarity values further indicated that, at the feature level, automated driving preferences were often inversely related to participants’ natural manual driving behavior. These results suggest that when users relinquish control to an automated system, they may prioritize comfort, predictability and perceived safety over replicating their own driving behavior (Lee & See, 2004; de Winter & Hancock, 2021).
This apparent discrepancy between parameter-level convergence observed in prior work and behavioral divergence observed in the present study highlights the importance of distinguishing between conceptual driving style preferences and executed driving behavior. Users may select automated driving styles that align with their self-perception or driving identity at a semantic level, while simultaneously expecting automated vehicles to behave in a more cautious and stable manner during actual operation.
The observed inverse relationship between manual and automated driving styles suggests that user preferences for automation may be shaped by psychological factors such as trust, perceived risk and comfort. Automated driving may be viewed as a safety-critical system, leading users to favor conservative behavior even if they do not adopt such behavior themselves when driving manually. The findings also highlight the importance of adjustable HMIs in automated vehicles. Providing users with the ability to tune driving style parameters allows them to express preferences that may not be directly inferable from observed manual behavior alone. Adaptive systems that rely solely on behavioral imitation may therefore fail to meet user expectations (Schwarting et al., 2019).
CONCLUSION
This study investigated the relationship between manual driving behavior and preferred automated driving styles using a driving simulator and a configurable HMI. While distinct driving style clusters were identified for both manual and automated driving, participant-wise similarity analysis revealed that automated driving preferences were often inversely related to natural manual driving behavior.
Participants consistently favored automated driving that was slower, smoother, more centrally positioned within the lane and more conservative in following distance than their own manual driving. These findings suggest
that effective personalization of automated vehicles should account for users’ psychological preferences and expectations rather than relying solely on behavioral imitation. Future work should explore larger and more diverse participant samples, examine longitudinal adaptation of preferences over time and integrate subjective measures such as trust and perceived safety. The results of this study contribute to the human factors understanding of automated driving and support the development of adaptive HMIs that enable comfortable, trustworthy and user-centered autonomous driving experiences.
ACKNOWLEDGMENT
The author gratefully acknowledges the Deutsches Zentrum für Luft- und Raumfahrt (DLR) for providing infrastructure, supervision and technical support for this research. Special thanks are extended to the study participants in Oldenburg, Germany for their time and cooperation. This work benefited from valuable feedback provided by other project colleagues and reviewers within the DLR.
REFERENCES
Beggiato, M., & Krems, J. F. (2013). The evolution of mental model, trust and acceptance of adaptive cruise control in relation to initial information. Transportation Research Part F: Traffic Psychology and Behaviour, 18, 47–57. Bellem, H., Schönenberg, T., Schrauf, M., & Krems, J. F. (2016). Objective metrics of
comfort: Developing a driving style for highly automated vehicles. Transportation Research Part F: Traffic Psychology and Behaviour, 41(Part A), 45–54. https:// doi.org/10.1016/j.trf.2016.05.005 Bengler, K., Rettenmaier, M., Fritz, N., & Feierle, A. (2014). From HMI to HMIs: Towards an HMI framework for highly automated vehicles. Information Technology, 56(1), 61–67. de Winter, J. C. F., & Hancock, P. A. (2021). Human factors methods for automated
driving research. Applied Ergonomics, 92, 103334. de Winter, J. C. F., Happee, R., Martens, M. H., & Stanton, N. A. (2014). Effects of adaptive cruise control and highly automated driving on workload and situation awareness: A review of the empirical evidence. Transportation Research Part F, 27, 196–217. Endsley, M. R. (1995). Toward a theory of situation awareness in dynamic systems.
Human Factors, 37(1), 32–64. Forster, Y., Hergeth, S., Naujoks, F., Krems, J. F., & Keinath, A. (2019). User Education in Automated Driving: Owner’s Manual and Interactive Tutorial Support Mental Model Formation and Human–Automation Interaction. Information, 10(4), 143. https://doi.org/10.3390/info10040143 Gold, C., Damböck, D., Lorenz, L., & Bengler, K. (2015). “Take over!” How long
does it take to get the driver back into the loop? Proceedings of the Human Factors and Ergonomics Society Annual Meeting, 57(1), 1938–1942. Lee, J. D., & See, K. A. (2004). Trust in automation: Designing for appropriate reliance. Human Factors, 46(1), 50–80.
Empirical Validation of Human-Centered Driving Style Parameterization 189 Markkula, G., Engström, J., Lodin, J., Bärgman, J., & Victor, T. (2012). A farewell to
brake reaction times? Kinematics-dependent brake response in naturalistic rear- end emergencies. Accident Analysis & Prevention, 44(1), 211–221. Martens, M. H., & Jenssen, G. D. (2012). Behavioral adaptation and acceptance. In Handbook of Traffic Psychology (pp. 117–138). Elsevier. Sagberg, F., Selpi, B., Piccinini, G. F. B., & Engström, J. (2015). A review of research
on driving styles and road safety. Human Factors, 57(7), 1248–1275. Schwarting, W., Alonso-Mora, J., & Rus, D. (2019). Planning and decision-making for autonomous vehicles. Annual Review of Control, Robotics, and Autonomous Systems, 2, 187–210. Trende, A., Weber, L., Lüdke, A., & Bengler, K. (2019). Human-centered
parameterization and evaluation of automated driving styles on highways. Transportation Research Part F, 62, 279–297. Waytz, A., Heafner, J., & Epley, N. (2014). The mind in the machine: Anthropomorphism increases trust in an autonomous vehicle. Journal of Experimental Social Psychology, 52, 113–117.
LISTED IN THE AHFE DIGITAL BOOKSTORE CATALOGUE
Explore the complete digital volume
Human Interaction and Emerging Technologies (IHIET-AI 2026): Artificial Intelligence and Future Applications
Read this individual research paper free through the original publisher, or explore the full digital proceedings book.
ISBN 978-1-964867-77-9
Explore this ISBN in the AHFE Bookstore ↗Listed in the July 2026 bookstore catalogue; search by ISBN to confirm current availability · Digital book purchase optional