Mohammad Jeelani, Jose Muniz, Shaun Marsh (2024). A comparative analysis of AR controller tracking technologies. In: Accessibility, Assistive Technology and Digital Environments. AHFE Open Access, vol. 121, pp. 191–199. https://doi.org/10.54941/ahfe1004627
Augmented Reality (AR) and Virtual Reality (VR) controllers utilize a combination of different tracking technologies to determine spatial orientation and position. These tracking technologies include IR/LED tracking, IMU (inertial measurement unit) tracking, and VIO (visual-inertial odometry) tracking. The IR/LED system utilizes infrared sensors and LED constellations for precision tracking, the IMU system relies on accelerometers for responsive mobility, and the VIO system combines cameras and inertial measurements for a balanced solution in dynamic environments. These technologies play a critical role in enabling seamless interactions within virtual environments by providing real-time data on user movement.The most sophisticated AR/VR controllers utilize a combination of these three technologies. While utilizing all three technologies together maximizes controller tracking` performance, it also increases production costs while introducing constraints to the form and design of the controller. For controllers used with AR systems intended for enterprise use, it is hypothesized that controllers that feature all three tracking technologies may be over-engineered as enterprise use does not typically involve the dynamic movements required for consumer use such as gaming.This study presents findings from a series of user studies that evaluates the strengths and differences among these tracking technologies when performing different types of controller interactions. The user studies focused on quantitative user performance differences between controllers with different combinations of tracking technologies enabled as well as differences in user perception for performance and comfort. Among the key findings that will be presented are a breakdown of the types of interactions that rely on VIO tracking and how user performance and perception is affected by not having VIO tracking enabled.
Motion controllers play an important role in enhancing user interaction for Augmented Reality (AR) and Virtual Reality (VR) systems, offering a distinct
advantage over gestures by providing precise spatial positioning, enabling intricate interaction with digital objects (Microsoft Learn, 2022). This effec- tiveness is further heightened through inside-out tracking for AR/VR con- trollers, which utilizes embedded sensors within the controllers to capture and analyze the controller’s position and movement relative to the user’s sur- roundings (Pimax, 2023). Many AR/VR controllers utilize a combination of IR/LED tracking and Inertial Measurement Unit (IMU) systems to pro- vide inside-out tracking, where the headset’s cameras continuously capture images of infrared LEDs on the controller for triangulating the controller’s position while motion gyro sensors predict controller movements (Gajsek, 2022). To further improve the effectiveness of inside-out tracking, outward facing camera sensors on the controller can also be employed to provide on-board inside-out tracking and mitigate the effects of IR/LED occlusion (Lang, 2022). This type of tracking, also known as Visual-Inertial Odometry (VIO) tracking, is most beneficial in dynamic settings. Each tracking tech- nology brings unique strengths to the table while also imposing their own design constraints. While the simultaneous utilization of IR/LED tracking, IMU systems, and VIO tracking optimizes controller tracking performance, it inevitably escalates production costs and imposes constraints on controller form design.
For enterprise-focused AR applications, it is hypothesized that the same level of controller tracking capabilities are not required as consumer facing applications such as gaming. In particular, the question of whether users of AR based enterprise solutions benefit from VIO tracking, which is critical for tracking controller movements outside of the field of view of the head- set’s real-world cameras, warrants investigation since these types of dynamic controller movements are less common for enterprise-focused applications.
This study investigated the implications of removing the VIO cameras from the controller of a commercially available AR system intended for enterprise use. These implications include user perception and performance when performing common interactions found in AR enterprise applications. The findings from this study are valuable for informing decisions on which controller tracking technologies are necessary for enterprise-focused AR systems.
METHODOLOGY
To quantify the implications of removing VIO cameras from an AR controller, two phases of user testing were conducted where participants performed a series of tasks with the controller’s VIO cameras exposed as well as with the controller’s VIO cameras covered. The first phase focused on basic interac- tions such as those required for operating system navigation and basic object manipulation. The second phase involved testing interactions that resemble those found in AR enterprise solutions.
Phase 1: Basic Interactions For the first phase of user testing, a between-subjects study design was utilized where a group of 28 participants performed a series of tasks involv- ing basic controller interactions with the controller’s VIO cameras exposed
A Comparative Analysis of AR Controller Tracking Technologies 193
while a separate group of 31 participants performed the same tasks with the VIO cameras physically occluded. Participants were screened for having experience with AR or VR and/or being technically proficient.
A unity-based user test application was developed for this phase of testing where participants were guided through performing a total of 9 tasks. Both direct and indirect controller interactions were tested, with direct interactions encompassing those that utilize a virtual stick extending from the head of the controller to perform interactions and indirect interactions including those that utilize the controller’s virtual ray from a distance. For this study, inter- actions utilizing the controller’s touchpad were also considered to be direct interactions. Prior to beginning the test, a proctor demonstrated how to use the controller and the participant was provided with the opportunity to prac- tice using the controller in a separate application that featured all the same interactions that are included in the test. The recorded test did not begin until the proctor verified that the participant demonstrated competency with performing all necessary interactions. To begin each task, the participant would select a “start” button which would initiate a hidden task timer. Upon satisfying the requirements for each task, the user test application automat- ically ends the task and stops the task timer. The completion time for the task is automatically recorded into a cloud-based spreadsheet. The tasks participants performed for this phase were as follows:
Button selection with stick.
Button selection with ray.
Button press with stick.
Adjust slider with ray.
Scale object with ray.
Rotate object with ray.
Move object with ray.
Scroll page with touchpad.
Scroll page with ray.
After completing each task, participants were asked about their percep- tion for comfort and accuracy while performing that task within the user test application. For comfort perception, the 5-point Likert scale shown in Figure 1 was used. For this phase of the study, a rating of 3 or above is considered to be a passing rating.
For accuracy perception, the 5-point Likert scale shown in Figure 2 was used. As with the rating scale for comfort perception, a rating of 3 or above is considered to be a passing rating. Participant responses for comfort and accu- racy perception were recorded in the same spreadsheet as task completion times.
Upon completing the final task, participants were asked to rate their over- all perception for their experience with the controller for all tasks combined as well as their perceived comfort, accuracy, speed, hand/wrist fatigue and arm/shoulder fatigue using 5-point Likert scales.
Figure 1: Comfort perception rating scale.
Figure available in the original PDF paper.
Figure 2: Accuracy perception rating scale.
Figure available in the original PDF paper.
Phase 2: Extended Use Cases Phase 2 of this study followed a similar methodology as Phase 1, how- ever, Phase 2 utilized a repeated measures sample with 32 participants and utilized a separate user test application featuring a different set of tasks representing specific enterprise use cases. One task (manipulate 3D object) utilized direct interaction, where object transformations required perceived contact between the controller and the object, while the remaining tasks involved indirect interactions that utilize the controller’s virtual ray from a distance. In addition to capturing user perception and task completion times, Phase 2 involved capturing additional quantitative metrics including frequency of positional tracking loss, duration between losing and recovering positional tracking, attempts necessary to complete each task, time-on-task for each task, and error between completed state and intended goal. With Phase 2 being a repeated measures study where participants were exposed to both conditions (with and without VIO cameras exposed), exposure to each condition was randomized. The tasks included in Phase 2 are as follows:
Manipulate 3D object (8 trials) with direct interaction.
Reciprocal tapping (“Multidirectional Fitts’ Task”) targeting and selection (5 trials) with ray.
Slider manipulation (6 trials) with ray.
Path tracing (9 trials) with ray.
Following the completion of each task module, four user perception ques- tions were asked on-device using a 5-point Likert scale: perceived comfort, perceived accuracy, perceived hand/wrist fatigue and perceived arm/shoul- der fatigue. While a rating of 3 or above was considered to be a passing rating for Phase 1, the criteria for a passing rating was changed to a 4 for Phase 2 in order to focus more on positive perception rather than positive and neutral perception. After completing all four modules for each of the two controller states, participants were asked to rate their perceived comfort, perceived hand/wrist fatigue, perceived arm/shoulder fatigue, and perceived overall experience using the same 5-point Likert scale.
A Comparative Analysis of AR Controller Tracking Technologies 195
RESULTS
Phase 1: Basic Interactions The percent of participants providing a passing rating (3 or above) for comfort and accuracy perception for each task as well as the median times on task can be found in Table 1. These results show that perfor- mance (median time-on-task) for most tasks was negatively affected for the controller condition with occluded VIO cameras while comfort and accuracy perception was similar. Direct button selection and button press appeared to be the most negatively affected for the controller condition with occluded VIO cameras for both median time-on-task and comfort/accuracy perception.
Table 1. Summary of user perception and performance for Phase 1 task modules.
Table available in the original PDF paper.
Median Time on Task - Controller w/o VIO
Median Time on Task - Controller w/ VIO
Perceived Accuracy Pass Rate - Controller w/o VIO
Perceived Accuracy Pass Rate - Controller w/ VIO
Perceived Comfort Pass Rate - Controller w/o VIO
Perceived Comfort Pass Rate - Controller w/ VIO
Button Selection with Stick 85.71% 77.78% 96.43% 66.67% 17.5s 38s Button Selection with Ray 96.43% 100.00% 100.00% 100.00% 14a 14s Button Press with Stick 96.43% 87.50% 92.86% 75% 12.5s 22.0s Adjustsliders with Ray 89.29% 91.30% 78.57% 86.96% 16.5s 25.0s Scale Object with Ray 100.00% 100.00% 100.00% 100.00% 8.5s 10.0s Rotate Object with Ray 100.00% 100.00% 100.00% 100.00% 8.0s 12.5s Move Object with Ray 96.30% 100.00% 100.00% 100.00% 10.0s 11.5s Scroll with Touchpad 96.43% 100.00% 100.00% 100.00% 10.0s 11.5s Scroll with Ray 89.29% 100.00% 100.00% 100.00% 10.0s 11.5s
The percent of participants providing a passing rating (3 or above) for the questions related to overall perception following the completion of each controller condition can be found in Table 2. These results indicate a minimal difference in perception for each controller condition.
Table 2. Summary of overall perception responses for each Phase 1 controller condition.
Table available in the original PDF paper.
Perceived Experience
Perceived Comfort
Perceived Accuracy
Perceived Speed
Perceived Hand/Wrist Fatigue
Perceived Arm/Shoulder Fatigue
96.4% 100% 100% 100% 96.4% 96.4%
Pass rate - Controller w/ VIO
96.4% 100% 100% 100% 96.4% 96.4%
Pass rate - Controller w/o VIO
Phase 2: Extended Use Cases The percent of participants providing a passing rating (4 or above) for the user perception questions for each task can be found in Table 3. These results indicate a slight degradation in user perception when the VIO cameras are occluded for all task modules.
Table 3. Summary of user perception responses for Phase 2 task modules.
Table available in the original PDF paper.
Perceived Arm/Shoul- der Fatigue Pass Rate - Controller w/o VIO
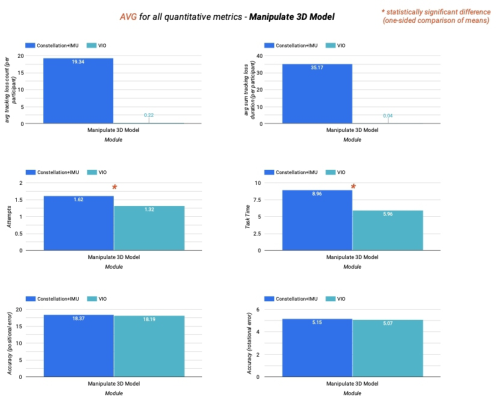
Figure 3 displays the average for all quantitative metrics for the Phase 2 Manipulate 3D Model module. These results indicate that controller tracking loss was significant for the occluded VIO camera controller condition while it was essentially non-existent when the VIO cameras were exposed. Positional error appeared to be similar for both conditions while the number of attempts to complete the task and time-on-task were adversely affected by the lack of VIO cameras.
Figure 3: Average for all quantitative metrics for manipulate 3D model module.
A Comparative Analysis of AR Controller Tracking Technologies 197
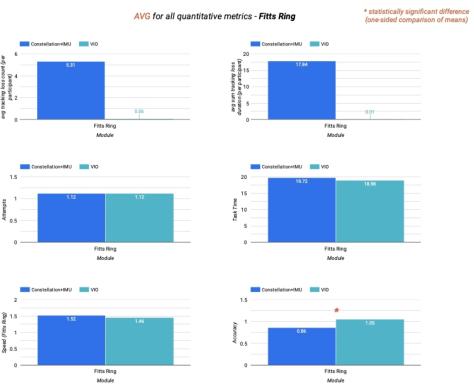
Figure 4 displays the average for all quantitative metrics for the Phase 2 Reciprocal Tapping Targeting and Selection (“Multidirectional Fitts’ Task”) module. As with the Manipulate 3D Model, these results indicate a similar difference in tracking loss between both conditions. The number of attempts necessary to complete the task, task time, and speed appeared to be very sim- ilar between both conditions while accuracy appeared to be more adversely affected when the VIO cameras were occluded.
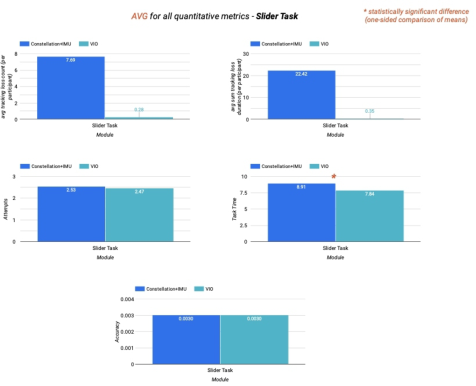
Figure 4: Average for all quantitative metrics for reciprocal tapping targeting and selection (“Multidirectional Fitts’ task”) module.Figure 5: Average for all quantitative metrics for slider task module.
Figure 5 displays the average for all quantitative metrics for the Phase 2 Slider Task module. As with the previous modules, these results indicate a similar difference in tracking loss between both conditions. The differences
between the two conditions for the remaining quantitative metrics appear to be minimal.
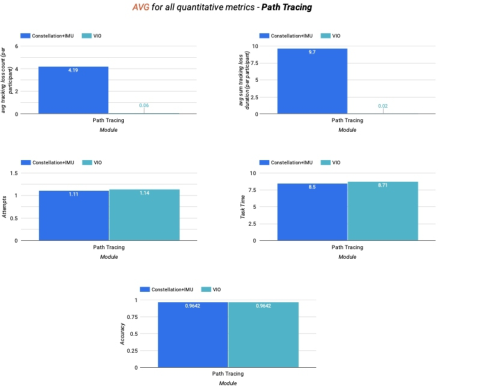
Figure 6 displays the average for all quantitative metrics for the Phase 2 Path Tracing module. As with the previous modules, these results indicate a similar difference in tracking loss between both conditions. The differences between the two conditions for the remaining quantitative metrics appear to be minimal.
Figure 6: Average for all quantitative metrics for path tracing module.
The percent of participants providing a passing rating (4 or above) for the questions related to overall perception following the completion of each con- troller condition can be found in Table 3. These results indicate a noticeable degradation in perception for comfort and fatigue when VIO cameras are occluded.
Table 4. Summary of overall perception responses for each Phase 2 controller condition.
Table available in the original PDF paper.
Perceived Comfort
Perceived Experience
Perceived Hand/Wrist Fatigue
Perceived Arm/Shoulder Fatigue
84.38% 78.13% 71.88% 90.63%
Pass rate - Controller w/ VIO
75.00% 71.88% 62.50% 93.75%
Pass rate - Controller w/o VIO
A Comparative Analysis of AR Controller Tracking Technologies 199
CONCLUSION
The findings of this study indicate that while user perception differences are minimal when VIO cameras are occluded when performing basic interac- tions, there is a significant degradation in median time-on-task, especially when performing direct interactions. Since these types of interactions are less common in AR applications, it can be concluded that the adverse effects due to the lack of VIO cameras is negligible for basic interactions mostly asso- ciated with menu navigation type activities. For more dynamic interactions that are found in AR enterprise applications, the effects of not having VIO cameras appears to be more profound due to prolonged tracking loss which results in longer task completion times. Accuracy and fatigue also seemed to be adversely affected especially for object manipulation and targeting and selection related tasks. For these dynamic interactions, user perception also appears to be negatively affected by the lack of VIO cameras likely due to tracking loss. These findings indicate that the inclusion of VIO cameras is beneficial for AR enterprise use. Mitigation efforts could be considered to limit the adverse effects of excluding VIO cameras such as including IR/LED indicators around the surface of the controller, extending the cov- erage of the headset cameras used to detect controller IR/LED indicators, and combining hand-tracking with controller-tracking to improve controller tracking when the controller’s constellation is occluded. Further research is warranted to determine whether these mitigation efforts minimize the adverse effects of not including VIO cameras on AR controllers intended for enterprise use.
REFERENCES
Gajsek, D. (2022, January 5). Overview of VR controllers: The way of interacting with the virtual worlds. Overview of VR Controllers: The Way of Interacting With the Virtual Worlds. https://circuitstream.com/blog/vr-controllers-the-way- of-interacting-with-the-virtual-worlds Lang, B. (2022, March 7). Magic Leap 2 controller may use on-board inside-out
tracking, an industry-first. Road to VR. https://www.roadtovr.com/magic-leap-2- controller-camera-inside-out-tracking/ Microsoft Learn. (2022, May 24). Motion controllers - mixed reality. Mixed Reality. https://learn.microsoft.com/en-us/windows/mixed-reality/design/motion-cont rollers Pimax. (2023, May 29). Pose tracking methods: Outside-in vs inside-out tracking
in VR. https://pimax.com/pose-tracking-methods-outside-in-vs-inside-out-track ing-in-vr/
LISTED IN THE AHFE DIGITAL BOOKSTORE CATALOGUE
Explore the complete digital volume
Accessibility, Assistive Technology and Digital Environments
Read this individual research paper free through the original publisher, or explore the full digital proceedings book.
ISBN 978-1-958651-97-1
Explore this ISBN in the AHFE Bookstore ↗Listed in the July 2026 bookstore catalogue; search by ISBN to confirm current availability · Digital book purchase optional