Prachi Joshi, Hirak Banerjee, Avdhoot V Muli, Aurobinda Routray, Priyadarshi Patnaik (2024). Study of Emotional contagion through Thermal Imaging: A pilot study using noninvasive measures in young adults. In: Neuroergonomics and Cognitive Engineering. AHFE Open Access, vol. 126, pp. 220–230. https://doi.org/10.54941/ahfe1004755
Emotional contagion, the process of unconsciously mirroring others’ emotions [6], occurs through various channels including facial expressions, vocal tone, and body language, influencing social interactions and responses to cultural stimuli like music and movies [3], [4], [1]. Facial expressions, analyzed using the Facial Action Coding System (FACS), provide insights into emotional transmission [2]. Thermal imaging, a technique for measuring facial temperature changes, offers a noninvasive method to study emotional responses [5]. However, the facial thermal response to emotional contagion remains understudied. This study aims to investigate how emotional contagion affects facial blood flow among highly emotionally contagious individuals, identified using noninvasive measures. Thermal imaging will capture temperature changes across ten designated facial regions of interest (ROIs), shed-ding light on facial muscle activation. By interpreting temperature variations in these ROIs, researchers seek to understand the physiological processes underlying emotional contagion. Previous studies have shown inconsistent findings regarding facial temperature changes during emotions like fear and joy, highlighting the need for further investigation. This research aims to clarify these discrepancies and advance our understanding of facial thermal responses to emotional contagion, contributing to the broader field of emotion research and potentially informing therapeutic interventions and communication strategies.Initially, Eighteen participants participated in the study. Two groups of standardized emotionally contagious video stimuli (Happy, Fear) were used to induce emotional contagion.The videos started with a one-minute relaxing clip to help participants achieve a neutral emotional state before watching the emotional contagion clips. Following the two-minute emotional contagion video, a blank screen was displayed for one minute to observe the aftereffects of the emotional contagion on participants. Facial temperature was recorded from Fluke Ti 400, and facial expressions were recorded from the webcam. Participants were asked to fill out an emotion-intensity feedback form to rate the experienced emotion and its intensity during video stimuli. Eight participants’ data was removed from further analysis because of inconsistencies. Out of the remaining ten, we further shortlisted five highly emotionally contagious participants with the help of the emotional contagion scale. Ninety baseline and arousal thermal images (10 seconds each) were identified and analyzed using FACS. Ten important regions of interest(ROIs) were selected for facial thermal variations. The interpretation of temperature patterns on selected ROIs produces a physiological time series signal, reflecting changes in blood flow associated with emotional responses. As previously discussed, blood flow radiates across the blood vessels when an emotion happens, which is why a gradual shift in the baseline occurs when an emotion takes place. To assess significant differences in facial thermal temperatures from baseline to emotional contagion, the Mann-Whitney U test and average temperature differences were used. During both emotions (fear and joy), the temperature of the nose decreased on the faces of participants. However, during fear, the temperature dropped in the forehead, left eye corner, and right cheek, while during joy, it increased in the left eye upper region. Additionally, while in fear, the left eye upper, right eye upper, and nose exhibited decreased temperatures, whereas during joy, the forehead, left and right eye corners and nose showed reduced temperatures. Mann Whitney U test showed significant emotional arousal in all the ROIs. Only the right eye corner and left cheek in two participants during fear and the right eye corner during joy in one participant was showing insignificant differences.[1] Amy Coplan. Catching characters emotions: Emotional contagion responses to narrative fiction film. Film Studies, 8(1):26–38, 2006.[2] Paul Ekman. Facial expression and emotion. American psychologist, 48(4):384,1993[3] [3]Carolina Herrando and Efthymios Constantinides. Emotional contagion: a brief overview and future directions. Frontiers in psychology, 12:2881, 2021[4]Giuliana Isabella and Hamilton C. Carvalho.Chapter 4 - emotional contagion and socialization: Reflection on virtual interaction. In Sharon Y. Tettegah and Dorothy L. Espelage, editors, Emotions, Technology, and Behaviors, Emotions and Technology, pages 63–82. Academic Press, San Diego, 2016 [5]Sophie Jarlier, Didier Grandjean, Sylvain Delplanque, Karim N’diaye, Isabelle Cayeux, Maria Ines Velazco, David Sander, Patrik Vuilleumier, and Klaus R. Scherer. Thermal analysis of facial muscles contractions. IEEE Transactions on Affective Computing, 2:2–9, 2011.Eliska Prochazkova and Mariska [6]E. Kret. Connecting minds and sharing emotions through mimicry,Neuroscience Biobehavioral Reviews2017
Emotion contagion involves unconsciously mirroring others’ emotions, lead- ing to shared feelings within social interactions (Prochazkova and Kret, 2017). This can occur through various channels, such as facial expressions, vocal tone, and body language (Herrando and Constantinides, 2021). Cul- tural objects like music, movies, videotapes, and cartoons can elicit strong emotions in viewers, emphasizing the close connection between emotion per- ception and motor reactions (Coplan, 2006; Pinilla et al., 2020). Techniques such as the facial action coding system (FACS) are used to analyse facial
Study of Emotional Contagion Through Thermal Imaging 221
expressions and intricate patterns of facial muscles that convey social sig- nals. Developed by Ekman et al., FACS is a widely used system that classifies facial expressions based on the anatomy of facial muscles, utilizing action units(AUs) to describe visible facial movements at varying intensities (Ekman, 1993). The thermal imaging technique has emerged as a promising non-invasive method for detecting and assessing changes in facial muscle contractions associated with producing action units (AUs). Facial expressions stem from the activation of micro muscle units, leading to temperature variations in action units and potentially influencing blood flow in specific facial regions (Jarlier et al., 2011). Facial expressions result from the activation of micro muscle units, causing temperature changes in action units and potentially altering blood flow in specific facial areas (Jarlier et al., 2011; Cho and Bianchi-Berthouze, 2019). Facial blood vessels are innervated by sympathetic and parasympathetic nerves (Kistler et al., 1998), influencing skin temper- ature (McCorry, 2007; Matsukawa et al., 2018). Facial thermal patterns reflect emotional states, measured noninvasively with infrared thermal imag- ing, correlating with physiological parameters like ECG and GSR (Ioannou et al., 2014; Cruz-Albarran et al., 2017). Recent studies have explored emotions using infrared thermal (IRT) imaging, revealing facial blood flow as a marker of emotional contagion (Ioannou et al., 2014). Psychophysiological and emo- tional states are typically monitored by measuring autonomic nervous system parameters through behavioural channels. Conventional technologies involve contact sensors, potentially influencing results due to invasiveness and par- ticipant compliance requirements (Merla, 2014). Studies reveal a correlation between facial skin temperature changes and experiences of fear, joy, and emotional arousal (Nakanishi and Imai-Matsumura, 2008; Nhan and Chau, 2009). Fear and joy are the ones that have been studied in association with the thermal directional response (Kistler et al., 1998; Di Giacinto et al., 2014). However, discrepancies in facial temperature variations during emo- tions present conflicting results or involve different facial regions. Notably, positive emotions like joy show inconsistent findings, with some studies suggesting an overall increase and others indicating a decrease in facial tem- perature (Aristizabal-Tique et al., 2023). Joy is associated with a reduction in temperatures on the nose and forehead (Nakanishi et al., 2008; Aristizabal- Tique et al., 2023). Few studies noted temperature decrease in nose, forehead, maxillary and lips during fear (Cruz-Albarran et al., 2017; Kosonogov et al., 2017; Bhushan et al., 2020). Studies on facial temperatures of nonhuman primates have also noted the reduction of the nasal temperature as a marker of fear (Chotard et al., 2018).
The current research explores the impact of video stimuli inducing emo- tional contagion on the facial blood flow of individuals who are highly emotionally contagious. The Facial Action Coding System (FACS) analyses and categorises highly aroused facial expressions. Thermal imaging tracks temperature changes in ten specific facial regions, providing insights into facial blood flow patterns. The research aims to understand how various facial regions respond to emotional contagion in terms of blood flow.
METHOD
Stimuli Joy and fear were selected as target emotions for their relevance to coordi- nated behaviour and potential survival and fitness value, as both motor and affective processes are implicated in emotional contagion (Buss, 2000). Joy is associated with high arousal and positive valence, while fear is associated with negative valence and high arousal, making them suitable for the study (Mneimne et al., 2010). The criteria for selecting emotionally contagious videos included alignment between the elicited emotion and the emotions felt by individuals, ensuring consistency in emotional displays and cultural context. For the study multiple videos were rated by individuals (N = 20) on their capacity to elicit particular emotion. Videos with highest ratings were then shortlisted as emotional contagion stimuli.
Participants This study received approval for ethical clearance (No. IIT/SRIC/DEAN/2024) from the institute’s ethical committee. Eighteen participants participated in the study. Six participants’ data was removed from further analysis because of inconsistencies. Out of the remaining twelve, we further shortlisted eight highly emotionally contagious participants with the help of the emotional contagion scale.
Apparatus and Materials Physiological Measure Thermal infrared (IR) imaging with the Fluke TI 400 was used for non- invasive assessment of emotions and psycho-physiological responses. This technology captures temperature variations and generates thermal face images based on heat patterns, detecting heat emitted by humans and objects independent of ambient lighting.
Web Camera Videos of participants’ faces were recorded with Logitech C270 Web camera, placed above the computer screen in front of the participant.
Psychological Measures The Emotional Contagion Scale (ECS) and Brief Mood Introspection Scale (BMIS) were used to assess emotional responses. The ECS consists of 15 items rated on a 4-point Likert scale, while the BMIS measures nine emotions on a 7-point Likert scale.
Procedure Participants completed a consent form, demographic questionnaire and the Basic Mood Introspection Scale (BMIS) prior to the experiment. They were then asked to watch the videos and rate the intensity of the emotions they felt. Standardized emotionally contagious video stimuli (Joy and Fear) were
Study of Emotional Contagion Through Thermal Imaging 223
presented in randomized order. Each session began with a one-minute relax- ing clip to establish a neutral emotional baseline. Subsequently, participants viewed a two-minute emotional contagion video followed by a one-minute blank screen to observe aftereffects. An emotion-intensity feedback form was completed to rate experienced emotions and their intensity. A 15-minute gap separated the Joy and Fear clips. After debriefing, participants filled out an emotional contagion questionnaire.
DATA ANALYSIS Facial Expression Extraction
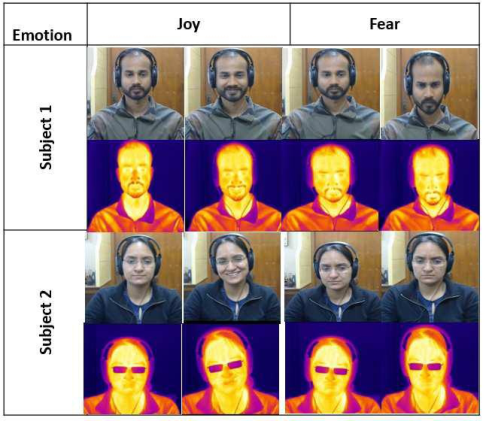
Facial expressions were manually selected using the Facial Action Coding System (FACS), and suitable frames reflecting both Joy and Fear emotions for each individual were extracted from the captured thermal frames as can be seen from the images shown in Figure 1. This facial expression was captured from the 10-second baseline and emotional arousal of emotional contagion video stimuli.
Figure 1: Comparison of facial expressions and corresponding thermal images under baseline conditions and during emotional contagion.
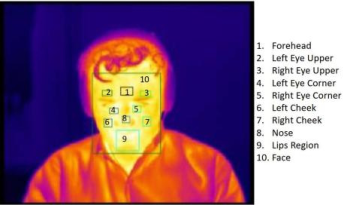
Thermal Image Extraction Thermal images were extracted from thermal videos using the FLUKE Ti- 400 camera and processed using Smart View Classic software. Frames were annotated using the VGG Image Annotator (Dutta and Zisserman, 2019) to identify ten specific ROIs(See Figure 2). The data was exported in JSON format for further analysis.
Emotion arousal periods were selected based on Facial Action Coding Sys- tem (FACS) analysis, and 90 frames were manually annotated for emotion- related features. Automated region of interest(ROI) detection was achieved using Python scripts to read JSON files and extract ROIs based on unique IDs and image names. ROIs were converted from RGB to grayscale, and average
temperatures were calculated for each ROI. Average temperature values for each ROI were stored in CSV format for further analysis. Time series graphs were plotted to visualize temperature trends over time, ensuring consistency and accuracy in temperature calculation.
Figure 2: ROIs for thermal analysis.
RESULT
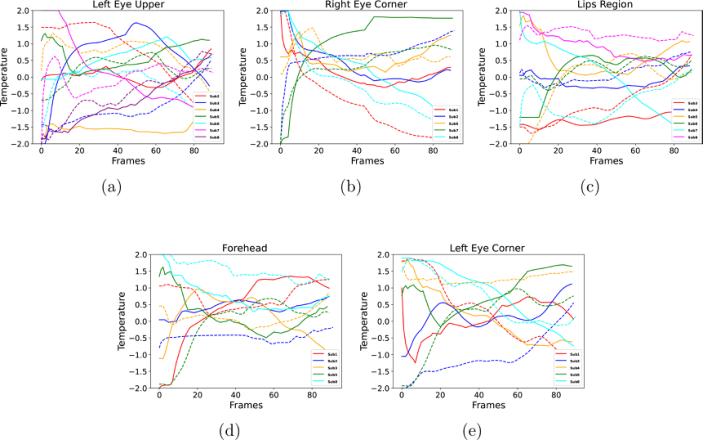
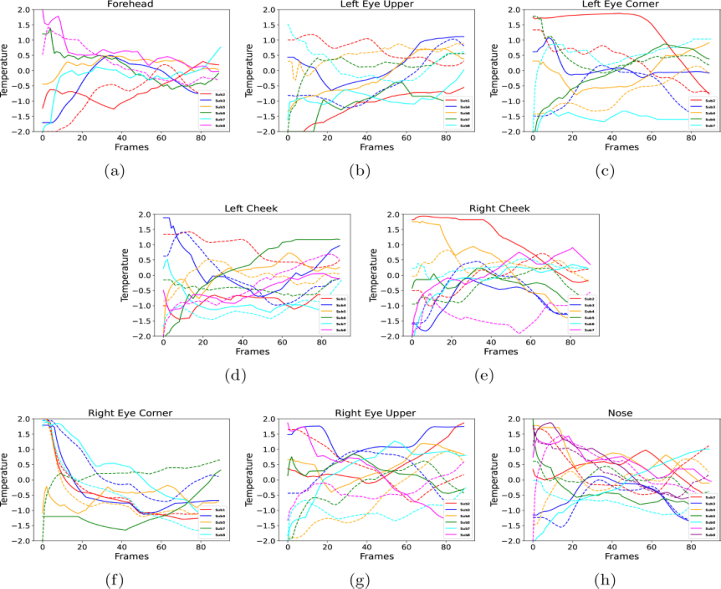
The results demonstrate distinct thermal patterns associated with different emotional states induced by emotional contagion (Figure 3, 4). Figure 3, 4 depict facial thermal temperature graphs captured over a timeframe of 10-second for both baseline and emotional contagion. In each graph, the dot- ted line represents the baseline, while the solid line represents the contagion. Fear contagion elicits increased temperature in the left and right cheeks and the forehead. Conversely, joy contagion is linked to a decrease in forehead temperature as shown in Figure 3.
Figure 3: Time series signal of joy contagion compared to baseline, where temperature exhibits increases in (a) left eye upper, (b) right eye corner, and (c) lips region, while showing decreases in (d) forehead and (e) left eye corner regions.
Study of Emotional Contagion Through Thermal Imaging 225
Analysis of the temperature differences between baseline and emotion arousal periods provides insights into the physiological manifestations of emotions in thermal imaging data. Table 1 showed an average temperature in each RoI,s for joy and Table 2) showed an average temperature in each RoI,s for fear. The temperature difference (1t) between the average baseline temperature and the temperature during emotional contagion is highlighted, with increases in red and decreases in blue(See Table 1, 2).
Figure 4: Time series signal of fear contagion compared to baseline, showcasing tem- perature increments observed in (a) forehead, (b) left eye upper, (c) left eye corner, (d) left cheek, and (e) right cheek regions. Conversely, temperature decreases are noted in (f) right eye upper, (g) right eye corner, and (h) nose.
It’s important to note that individual variations in emotional response can significantly impact temperature fluctuations. The methodology emphasizes the importance of considering these individual differences when interpret- ing thermal imaging data. Different patterns emerge regarding temperature changes associated with specific emotions. joy induces a notable decrease in temperature on the forehead and left eye corner. In contrast, fear is char- acterized by a decrease in temperature in the nose, right eye upper, and right eye corner. Conversely, during joyful experiences, a discernible increase in temperature is observed in the left eye upper, right eye corner, and lip region. On the contrary, fear triggers temperature increments in the fore- head, left eye upper, left eye corner, and both cheeks. Mann-Whitney U test
was used to analyse the significance of temperature differences in each Region of Interest (ROI) compared to the baseline during emotional arousal. Across all ROIs, each emotional state was compared against baseline temperatures. Significance was determined at p<0.05, indicating statistical significance for p-values below this threshold. The findings reveal that during experiences of joy and fear, temperatures for ROI significantly deviated from baseline levels. Studies have consistently reported a reduction in temperatures on the nose and forehead during experiences of fear (Nakanishi and Imai-Matsumura, 2008; Aristizabal-Tique et al., 2023; Cruz-Albarran et al., 2017; Kosonogov et al., 2017). Additionally, temperature decreases on the nose, and maxillary regions have been noted (Cruz-Albarran et al., 2017; Salazar-López et al., 2015). Research findings indicate that during instances of fear, there is a notable decrease in temperature in specific facial regions, including the nose, forehead, maxillary, and lips.
Table 1. Mean temperature of region of interest (ROI) for joy.
Table available in the original PDF paper.
Subject ROI FH LE RE LE RE LC RC Nose LR Face Upper Upper Corner Corner Tb 32.94 30.92 30.85 33.95 32.25 30.86 28.86 32.86 28.18 25.74 1 TEC 32.68 30.51 29.99 32.92 32.75 29.50 28.39 33.37 27.81 25.57 1T 0.27 0.41 0.86 1.03 −0.50 1.36 0.47 −0.51 0.37 0.17
Moreover, specific facial regions exhibit notable temperature changes. In fear contagion scenarios, the left eye upper region and right eye cor- ner demonstrate temperature increments, while the left eye corner shows decrements. Conversely, during joy contagion, the lips region exhibits ele- vated temperatures. Additionally, the nose temperature decreases during fear
Study of Emotional Contagion Through Thermal Imaging 227
contagion. Further analysis reveals temperature increments in the left eye upper and corner regions during fear contagion, while temperature decre- ments are observed in the right eye upper and corner regions as illustrated in Figure 4. These findings underscore the intricate relationship between emotional contagion and thermal responses across facial regions.
Table 2. Mean temperature of region of interest (ROI) for fear.
Table available in the original PDF paper.
Subject ROI FH LE RE LE RE LC RC Nose LR Face Upper Upper Corner Corner Tb 33.09 31.11 31.83 32.64 30.53 30.68 30.37 27.73 30.46 28.39 1 TEC 32.93 31.75 32.50 29.89 29.86 31.17 30.15 27.89 30.55 28.45 1T 0.15 −0.64 −0.67 2.75 0.68 −0.49 0.22 −0.16 −0.09 −0.05
The statistical analysis conducted in this study focused on examining the average baseline temperature (Tb) and the temperature during Emotional Contagion (TEC) across various facial regions. The significance of tempera- ture differences in each Region of Interest (ROI) compared to the base-line during emotional arousal was assessed through the Mann-Whitney U tests. The results revealed significant differences in temperature for both joy and fear across most ROIs, indicating distinct thermal responses associated with different emotional states. These findings underscore the importance of considering individual differences in emotional responses when interpreting
thermal imaging data and highlight specific facial regions where emotional arousal elicited significant temperature changes relative to the baseline. Fear contagion causes increased facial temperature, indicating heightened arousal and blood flow. Joy contagion shifts thermal signatures, with decreased fore-head temperatures indicating relaxation and elevated lip region temper- atures suggesting muscle activation. These responses highlight the complex relationship between emotions and physiological reactions.
CONCLUSION AND FUTURE WORK In conclusion, our study elucidated the intricate relationship between facial expressions, thermal dynamics, and emotional experiences through the anal- ysis of thermal imaging data. The statistical analysis revealed significant temperature differences in various facial regions during emotional arousal, emphasizing the importance of considering individual variations in emotional responses. These findings deepen our understanding of the physiological correlates of emotions and under-score the potential of thermal imaging as a valuable tool for studying emotional contagion. Future research direc- tions include expanding the sample size for greater generalizability, exploring temporal dynamics of thermal responses for deeper insights into physiolog- ical mechanisms, integrating additional physiological measures like heart rate variability or electro-dermal activity for a comprehensive understand- ing of emotions, and investigating machine learning techniques to automate the analysis of thermal patterns. These avenues promise to advance our understanding of the intricate relationship between emotional contagion and physiological responses.
ACKNOWLEDGMENT
I would like to acknowledge the Electrical Engineering Department at the Indian Institute of Tech-nology, Kharagpur, for providing the necessary resources and facilities for conducting this research.
I am deeply thankful to the students of IIT Kharagpur, particularly those who participated in the study, for their cooperation and invaluable contribu- tions to the data collection process. Their involvement has been essential to the success of this research project.
Additionally, I would like to acknowledge the support and guidance pro- vided by my academic advisors and mentors at IIT Kharagpur. Their insights and encouragement have played a significant role in shaping this research endeavour.
REFERENCES
A. Di Giacinto, M. Brunetti, G. Sepede, A. Ferretti, and A. Merla. Thermal signature of fear conditioning in mild post traumatic stress disorder. Neuroscience, 266:216–223, 2014. Abhishek Dutta and Andrew Zisserman. The via annotation software for images,
audio and video. In Proceedings of the 27th ACM International Conference on Multimedia, MM’19, page 2276–2279, New York, NY, USA, 2019. Association for Computing Machinery.
Study of Emotional Contagion Through Thermal Imaging 229
Amy Coplan. Catching characters emotions: Emotional contagion responses to narrative fiction film. Film Studies, 8(1):26–38, 2006. Andreas Kistler, Charles Mariauzouls, and Klaus von Berlepsch. Fingertip tem-
perature as an indicator for sympathetic responses. International Journal of Psychophysiology, 29(1):35–41, 1998. Andr’es Pinilla, Ricardo M Tamayo, and Jorge Neira. How do induced affective states bias emotional contagion to faces? a three-dimensional model. Frontiers in psychology, 11:97, 2020. Arcangelo Merla. Thermal expression of intersubjectivity offers new possibili-
ties to human– machine and technologically mediated interactions. Frontiers in psychology, 5:802, 2014. BR Nhan and Tom Chau. Infrared thermal imaging as a physiological access pathway: A study of the baseline characteristics of facial skin temperatures. Physiological measurement, 30(4): N23, 2009. Braj Bhushan, Sabnam Basu, Pradipta Kumar Panigrahi, and Sourav Dutta. Explor-
ing the thermal signature of guilt, shame, and remorse. Frontiers in Psychology, 11:580071, 2020. Carolina Herrando and Efthymios Constantinides. Emotional contagion: A brief overview and future directions. Frontiers in psychology, 12:2881, 2021. David Buss. The evolution of happiness. The American psychologist, 55:15–23, 01
2000. E Salazar-L’opez, E Dom’ınguez, V Ju’arez Ramos, J De la Fuente, A Meins, O Iborra, G G’alvez, MA Rodr’ıguez-Artacho, and E G’omez-Mil’an. The mental and sub- jective skin: Emotion, empathy, feelings and thermography. Consciousness and cognition, 34:149–162, 2015. Eliska Prochazkova and Mariska E. Kret. Connecting minds and sharing emotions
through mimicry: A neurocognitive model of emotional contagion. Neuroscience Biobehavioral Reviews, 80:99–114, 2017. Hélène Chotard, Stephanos Ioannou, and Marina Davila-Ross. Infrared thermal imaging: Pos-itive and negative emotions modify the skin temperatures of monkey and ape faces. American journal of primatology, 80(5): e22863, 2018. Irving A Cruz-Albarran, Juan P Benitez-Rangel, Roque A Osornio-Rios, and Luis A
Morales-Hernandez. Human emotions detection based on a smart-thermal system of thermographic images. Infrared Physics & Technology, 81:250–261, 2017. Irving A Cruz-Albarran, Juan P Benitez-Rangel, Roque A Osornio-Rios, and Luis A Morales-Hernandez. Human emotions detection based on a smart-thermal system of thermographic images. Infrared Physics & Technology, 81:250–261, 2017. Kanji Matsukawa, Kana Endo, Kei Ishii, Momoka Ito, and Nan Liang. Facial
skin blood flow responses during exposures to emotionally charged movies. The journal of physiological sciences, 68(2):175–190, 2018. Laurie Kelly McCorry. Physiology of the autonomic nervous system. American journal of pharmaceutical education, 71(4), 2007. Malek Mneimne, Alice S Powers, Kate E Walton, David S Kosson, Samantha Fonda,
and Jes-sica Simonetti. Emotional valence and arousal effects on memory and hemispheric asymmetries. Brain and cognition, 74(1):10–17, 2010. Paul Ekman. Facial expression and emotion. American psychologist, 48(4):384,
1993. Rie Nakanishi and Kyoko Imai-Matsumura. Facial skin temperature decreases in infants with joyful expression. Infant Behavior and Development, 31(1):137–144, 2008.
Sophie Jarlier, Didier Grandjean, Sylvain Delplanque, Karim N’diaye, Isabelle Cayeux, Maria Ines Velazco, David Sander, Patrik Vuilleumier, and Klaus R. Scherer. Thermal analysis of facial muscles contractions. IEEE Transactions on Affective Computing, 2:2–9, 2011. Stephanos Ioannou, Vittorio Gallese, and Arcangelo Merla. Thermal infrared
imaging in psy-chophysiology: Potentialities and limits. Psychophysiology, 51(10):951–963, 2014. Victor H Aristizabal-Tique, Marcela Henao-P’erez, Diana Carolina L’opez-Medina, Renato Zambrano-Cruz, and Gloria D’ıaz-Londono. Facial thermal and blood perfusion patterns of human emotions: Proof-of-concept. Journal of Thermal Biology, 112:103464, 2023. Vladimir Kosonogov, Lucas De Zorzi, Jacques Honore, Eduardo S Mart’ınez-
Vel’azquez, Jean-Louis Nandrino, Jos’e M Martinez-Selva, and Henrique Sequeira. Facial thermal variations: A new marker of emotional arousal. PloS one, 12(9): e0183592, 2017. Youngjun Cho and Nadia Bianchi-Berthouze. Physiological and affective computing through thermal imaging: A survey. CoRR, abs/1908.10307, 2019.
LISTED IN THE AHFE DIGITAL BOOKSTORE CATALOGUE
Explore the complete digital volume
Neuroergonomics and Cognitive Engineering
Read this individual research paper free through the original publisher, or explore the full digital proceedings book.
ISBN 978-1-964867-02-1
Explore this ISBN in the AHFE Bookstore ↗Listed in the July 2026 bookstore catalogue; search by ISBN to confirm current availability · Digital book purchase optional