Victor Niaussat, Raphaelle Giguere, Tanya Paul, Patrick Archambault, Alexandre Marois (2024). Real-Time Machine Learning for ICU Hypoxia Prediction: A Pilot Study. In: Neuroergonomics and Cognitive Engineering. AHFE Open Access, vol. 126, pp. 12–22. https://doi.org/10.54941/ahfe1004734
Continuous and precise monitoring in the intensive care unit (ICU) are essential, particularly for patients with respiratory disorders necessitating mechanical ventilation, as they represent a critical cohort. Hypoxia can be defined as a medical condition characterized by an inadequate supply of oxygen to bodily tissues and organs, leading to an inability to meet their metabolic needs. This condition can manifest in diverse scenarios, such as high-altitude environments for example mountain climbing or in high-altitude flights. Common symptoms of hypoxia include breathing difficulties, confusion, elevated heart rate, and impaired cognitive and physical functions. If left unaddressed, hypoxia can lead to tissue damage, organ failure, and, in severe cases, even death. Traditionally, hypoxia detection relies on post facto measures, with methods implying peripheral capillary oxygen saturation (SpO2) providing valuable but delayed insights. Models providing real-time levels of hypoxia, or even early detection and intervention, would thus be relevant to prevent such a state. They could in fact provide timely detection to trigger automatic ventilation or to alert healthcare personnel promptly via adaptive automation. The goal of this study was to produce a real-time hypoxia detection model using machine-learning techniques in the context of ICU. Methods. We used the open-source eICU database, consisting of critically ill patients treated in ICU across the United States. It contains vital signs recorded at 5-min intervals and many hypoxia events. We utilized parameters according to a feature selection such as SpO2, heart rate (HR), and respiratory rate (RR) to make hypoxia predictions from few prior lags. We selected three hypoxia levels to achieve a supervised learning classification for hypoxia: No Hypoxia (SpO2 > 93%), Low level of Hypoxia (88% < SpO2 < 93%), and Strong level of Hypoxia (SpO2 < 88%). Furthermore, we exported the trained model to the Open Neural Network Exchange (ONNX) format to facilitate real-time predictions deployment in clinical settings, thus offering a valuable tool for early hypoxia detection and proactive patient care in ICU.Results. Mann-Whitney U tests and paired t-tests raised significant differences across levels of hypoxia for the SpO2, HR and RR measures. We tested several machine-learning models and our results showed that a Random Forest model could provide accurate predictions of impending hypoxia events (5 minutes prior to the event). We performed a random search fine-tuning method and a group 5-fold cross-validation and achieved a predictive accuracy of 0.937, a precision rate of 0.85, and a balanced accuracy of 0.813. The ONNX implementation of the model had an inference of 1 millisecond, which allows real-time hypoxia prediction. Discussion. Hypoxia is frequently encountered in the ICU as a result of a wide range of pathologic characteristics. Therefore, detecting hypoxia events before they occur is of paramount importance to ensure timely countermeasures through adaptive automation and prevent fatal outcomes for patients. The use of an ONNX model further enables real-time predictions, enhancing the clinical utility of our approach. The versatility of this approach extends beyond the medical domain, for example in aviation where hypoxia poses a serious threat. Such models have potential for being integrated in real time for pinpointing instances of pilots hypoxia, thus contributing to their health and to overall flight safety.
Hypoxia is a condition in which tissues of the body do not receive suffi- cient oxygen (O2) supply to meet their metabolic demands (Rupp et al., 2014). Breathing difficulties, respiration rate (RR) changes, confusion, a quick heartbeat, and impaired cognitive and physical capacities are all com- mon symptoms of hypoxia (Bhutta et al., 2022). If hypoxia is not addressed, it can result in tissue damage, organ failure, and, in severe cases, death (Rupp et al., 2014).
The imbalance between tissue O2 supply and consumption results in an insufficient O2 supply to maintain cellular function. Hypoxia is typically diagnosed with an O2 saturation (SpO2) below a selected threshold (%). According to literature, the threshold is around 90% (Manninen and Unger,
Real-Time Machine Learning for ICU Hypoxia Prediction: A Pilot Study 13
2016). There are two major causes of hypoxia at the tissue level, low blood flow to the tissue, or low oxygen content in the blood (hypoxemia). For our interest, we focus on hypoxia as a low level of oxygen in the tissues. Hypox- emia and hypoxia are related but, unlike hypoxemia which requires invasive sensors, hypoxia can be monitored non-invasively (Samuel and Franklin, 2008). In a study by Sippl et al. (2017), machine learning models were used to detect postintubation hypoxia during general anaesthesia. Researchers employed machine learning models utilizing key physiological parameters, including arterial oxygenation (SpO2), mean arterial pressure, and heart rate (HR), all recorded during the initial 30 minutes of each anaesthesia session. The machine learning models identified the AUC of SpO2 at 95%, the overall decline in SpO2, the minimum SpO2 value, patient’s age, and the Cormack- Lehane score as the most influential variables to predict a hypoxic state. This study showcased the development of machine learning models capable of cat- egorizing oxygen desaturation levels with a degree of accuracy comparable to that achieved by expert human consensus (Sippl et al., 2017). Their classifi- cation models was binary (estimates whether or not the person has hypoxia) and detected hypoxia instantly.
Various methodologies are used in hypoxia prediction models, including deep learning, electroencephalography EEG, and the utilization of vital signs measured through invasive sensors. While deep learning models have demon- strated efficacy in predicting hypoxia, they are often criticized for their lack of interpretability, posing challenges in implementing them effectively within intensive care systems (Annapragada et al., 2021). Alternatively, EEG data, which involves monitoring the electrical activity of the brain, is often used for hypoxia detection. By analysing EEG signals, abnormalities and patterns can emerge and provide some valuable insights for predictive modelling (Linnville et al., 2021). This approach provides insights into the neurological changes associated with hypoxia and presents a more interpretable framework than some deep learning models. Hypoxia prediction models can rely on vital sign measurements obtained through invasive sensors directly connected to the body. This approach involves monitoring physiological parameters to assess oxygen levels and accurately predict instances of hypoxia (Lundberg et al., 2017). Although this method is invasive, it provides a high-fidelity source of data for robust predictive modelling in critical care scenarios.
Certain approaches utilize vital parameters that are continuously measured in intensive care allowing for instantaneous binary detection. Other current approaches to predicting hypoxia, such as deep learning, EEG monitoring, and invasive vital sign measurements, may not be suitable for continuous, non-intrusive patient monitoring. Additionally, EEG is often unavailable in the ICU, and when it is available, it is not for long periods, making it unre- liable for hypoxia detection. Therefore, this study examines the feasibility of using non-invasive sensors available in the ICUs, paving the way for more sustainable hypoxia prediction systems. Additionally, a three-class predictive model was used to define an intermediate hypoxia state and to account for hypoxia uncertainty, representing a low level of hypoxia, which also allowed for a more granular, prospective evaluation of hypoxic state. This study
incorporates multiple temporal lags, enhancing capabilities for prospective hypoxia prediction. Finally, to evaluate model performance in a real-world scenario, we adopt the ONNX (Open Neural Network Exchange) format for model extraction, allowing seamless inference evaluation in simulated environments, ensuring the adaptability and interoperability of the predictive model across diverse systems.
METHOD
To label the three hypoxic states, we relied on measuring SpO2, which is used as the gold standard for hypoxia. We established two critical thresholds. First, we established that a SpO2 level of 93% is the threshold for low hypoxia levels, because it is on the low end of the National Institutes of Health’s rec- ommended SpO2 target range for COVID-19 patients (Shenoy et al., 2020). Furthermore, the SpO2 level of 93% falls between the hypoxemia treatment threshold (94%) recommended by the World Health Organization (World Health Organization, 2023) and the clinical emergency threshold (90%; Manninen and Unger, 2016). Second, we chose an 88% SpO2 level as the threshold for severe hypoxia level, 5% below the first chosen threshold. Considering these threshold limits, we included the clinical emergency thresh- old (90%; Manninen and Unger, 2016). Table 1 summarizes the main class developed according to these thresholds.
Table 1. Classes threshold for the hypoxic state detection model.
Table available in the original PDF paper.
Class Threshold No Hypoxia SpO2 > 93% Low level of Hypoxia 88% ≤SpO2 ≤93% High level of Hypoxia SpO2 < 88%
eICU Database We worked with the open access eICU database (Pollard et al., 2018) to col- lect vital data, continuous signals from patients in intensive care recording cases of hypoxia. The eICU database includes data from 335 units in 208 intensive care units (ICU) across the United States, covering patients who were severely ill and had their vital signs recorded every five minutes. A stratified sample of patient index stays by hospital was created using the percentage of index stays in each hospital from the entire private data reposi- tory. Only a small percentage of patients had stays in low-acuity or step-down units; these stays were terminated. Over 139,000 unique patients were admit- ted during 2014 and 2015, and the database includes over 200,000 patient unit encounters.
To comply with the US Health Insurance Portability and Accountability Act’s (HIPAA) safe harbor requirement, all tables were deidentified. One of these clauses states that all protected health information will be deleted. Additionally, hospital and unit identifiers have been deleted to safeguard
Real-Time Machine Learning for ICU Hypoxia Prediction: A Pilot Study 15
contributing organizations’ privacy. In the eICU database, there are 1,263 patients who can experience a loss of oxygen in tissues.
Data Extraction Vital signs, lab results, medications, care plan details, admission diagnosis, patient history, time-stamped diagnoses from an organized problem list, and similarly selected treatments are included in the dataset. Patients’ data is gath- ered into a shared warehouse only in cases where specific “interfaces” are accessible. Every interface is designed to transform and load a specific type of data; for example, vital sign interfaces include vital signs, laboratory inter- faces measure blood samples, and so on. Even if those measurements were made in the real context, different care units may have different interfaces in place, and that the lack of an interface will result in no data being available for a given patient. The data is provided as a relational database, comprising multiple tables joined by keys. Table 2 displays the vital signs available.
Table 2. Percentage of data availability for health parameters in the eICU.
Table available in the original PDF paper.
Data Type Column Name % of Data Available Heart rate heartrate 99.6% Peripheral oxygen saturation sao2 88.2% Respiration rate respiration respiration 84.5% ST level st2 40.2% ST level st1 37.5% ST level st3 36.5% Invasive mean blood pressure systemicmean 14.0% Invasive systolic blood pressure systemicsystolic 13.9% Invasive diastolic blood pressure sytemicdiastolic 13.9% Central venous pressure cvp 12.4% Temperature temperature 6.9% Mean pulmonary artery pressure pamean 2.0% Diastolic pulmonary artery pressure padiastolic 2.0% Systolic pulmonary artery pressure pasystolic 2.0% End tidal carbon dioxide concentration etco2 4.5% Intracranial pressure icp 0.8%
Data Preprocessing and Feature Extraction In this phase of our research, we present a comprehensive approach to data preprocessing and feature extraction. These steps are crucial in ensuring the reliability and effectiveness of subsequent analyses. The process includes sev- eral discerning stages, each designed to strengthen the dataset’s robustness and capture key temporal dynamics associated with hypoxia events.
Our methodology starts by selecting time series datasets that have at least 60 non-null data points. This criterion is necessary to ensure the robustness and adequacy of the data for subsequent analysis. To handle missing data, we applied an interpolation method (Uryumtsev et al., 2020; van Rossum et al., 2023). This method helps to maintain the temporal integrity of the
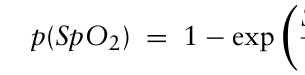
dataset, ensuring a continuous and smooth representation of the time series. Our preprocessing strategy includes applying the hypoxia highlights transfor- mation to emphasize oxygen saturation fluctuations that may be indicative of potential hypoxic events, contributing to the accuracy of the subsequent detection model. To further highlight the hypoxia phenomena, we can change the emphasis of the decreases in oxygen saturation levels using the following mathematical transformation (Annapragada et al., 2021):
SpO2 −100%
(1)
Equation reproduced from the original PDF.
10
This transformation highlights oxygen loss events. The value represents the probability of observing a hypoxia event. Here: a) when the SpO2 level is close to 100%, probability (p) of a hypoxic event is low; and b) when the SpO2 level is lower, p increases sharply.
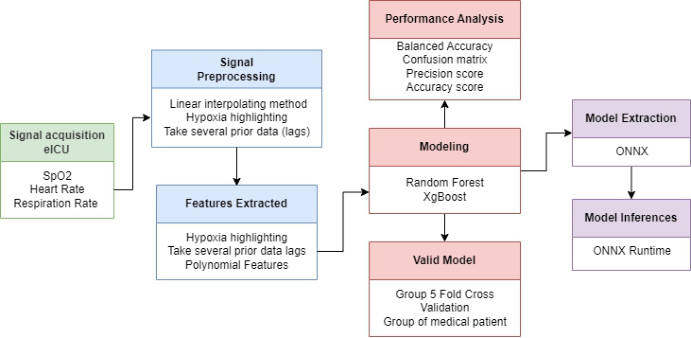
Finally, we used several prior data points (lags) to capture the tempo- ral dynamics leading up to hypoxia events. These lags provide a historical context, enabling the model to recognize patterns and trends leading to hypoxic occurrences (Annapragada et al., 2021). Our approach integrates data preprocessing techniques and mathematical transformations, providing the method for a robust and nuanced analysis of time series data in the con- text of hypoxia detection. Figure 1 depicts the high-level description of the process used to create a prediction model.
Figure 1: Depiction of the high-level modeling pipeline.
Feature Selection To select the most relevant vital signals for developing a hypoxia detec- tion model (i.e. the features of the prediction models), we based our choices on a statistical test. We assessed normality using the Shapiro-Wilk test and found that the vital signals did not follow a normal distribution. Therefore, we employed the Mann-Whitney U-test for continuous variables
Real-Time Machine Learning for ICU Hypoxia Prediction: A Pilot Study 17
(Park et al., 2023). Another way to analyse data is to measure the correla- tions between different vital signs, aiming at predicting hypoxia (Mouradian et al., 2018). We computed the Spearman correlation coefficients between vital pairs (Cohen, 2009), which measures the strength and direction of linear relationship between two variables.
Machine Learning Model Two models, XGBoost and Random Forest, were used for performance com- parison The use of Random Forest and XGBoost is due to their prevalence in hypoxia detection and prediction, and among studies about acute respi- ratory diseases (Liu et al., 2021; Wang et al., 2017) and respiratory failure (Liao et al., 2021). The SpO2 parameter undergoes the previously detailed mathematical transformation. Additionally, a 1-lag temporal component is incorporated to enhance predictive accuracy accounting. The temporal aspect accounts for the dynamic nature of physiological parameters and particularly their evolution over time. The objective of the model is to predict hypoxia levels 5 minutes in advance, allowing for a timely intervention. The Random Search technique was used to fine-tune hyperparameters for both the Ran- dom Forest and XGBoost models. This technique is preferred over grid search due to its superior performance in hyperparameter optimization (Putatunda and Rama, 2018).
To ensure the model’s robustness and generalizability, a group five-fold cross validation approach is employed, using patient groups as distinct folds. The model’s efficacy is evaluated through a range of metrics, including balanced accuracy, standard deviation of accuracy, confusion matrix, pre- cision score, and overall accuracy score, collectively providing a thorough assessment of its predictive capabilities.
RESULTS
Table 3 summarizes the results of the Mann-Whitney U-test. SpO2 defines the means of labeling states, that is why is not included in the analysis. As a vital reference sign for monitoring hypoxia, we selected SpO2 as the primary vital sign in constructing our prediction model. Our preliminary analysis using the Mann-Whitney U-test revealed that RR, and HR were the most significant factors in distinguishing between different hypoxia states.
Table 3. Summary of the results for the Mann-Whitney U-test.
Table available in the original PDF paper.
Vital signs No Hypoxia vs
No Hypoxia vs
Low Hypoxia vs
Low Hypoxia
High Hypoxia
High Hypoxia HR U 9.81×10¹⁰ U 2.91×10¹⁰ U 3.56×10¹⁰
p-value <0.001 p-value <0.001 p-value <0.001 RR U 9.60×10¹⁰ U 2.83×10¹⁰ U 3.74×10⁹ p-value <0.001 p-value <0.001 p-value <0.001
Our exploration also revealed a correlation between SpO2 and End tidal (r =0.17, p <0.001), SpO2 and Intracranial pressure (r = 0.37, p <0.001),
and End tidal and Intracranial pressure (r = 0.38, p <0.001). End-tidal CO2 and intracranial pressure did not adequately represent the different hypoxia levels in the analyzed dataset and therefore were not considered as features for this model. We observed an intriguing correlation between HR and RR (r = 0.27, p <0.001), and their lack of correlation with SpO2 (−0.07 < rs <0.05, ps <0.001) demonstrated its crucial role in developing a hypoxia detec- tion model. Therefore, we selected SpO2, HR and RR as features for our models. Our key features include the selection of two lags for each vital sign (5- and 10-minutes prior) and a mathematical transformation of SpO2.
Table 4 summarizes the results for the Random Forest and XGBoost models for the three-class classification of hypoxic events. Similar model- ing performances were observed across both training and testing for all the performance values for the Random Forest model be. As shown in Table 3, mean accuracy on the test set for this model reached 0.937. Precision, bal- anced accuracy and F1-scores were however inferior, still reaching values >80%. As for the XGBoost model, it reached similar performance metrics. Mean accuracy for the test set was also of 0.937, and balanced accuracy was almost equivalent, with a value of 0.829.
Table 4. Summary of the results for the random forest and XGBoost models.
Table available in the original PDF paper.
Model Dataset Mean accuracy Precision Balanced Accuracy F1-Score Random Forest Training 0.939 0.846 0.806 0.867 Test 0.937 0.847 0.817 0.873 XGBoost Training 0.938 0.828 0.824 0.877 Test 0.937 0.835 0.829 0.880
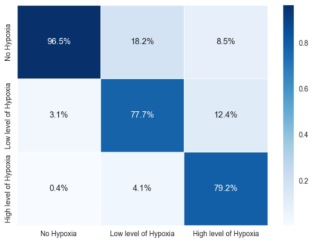
Figure 2: Confusion matrices for the random forest (left) and XGBoost models (right).
Examining the confusion matrices in percentage terms, both models demonstrate high precision in correctly identifying instances on the three classes (see Figure 2). The Random Forest model stands out in precision for the “No Hypoxia” class with percentages of 96.5% and maintains cor- rect precision with 79.2% for “High Level of Hypoxia” class. Meanwhile, XGBoost achieves slightly higher precision for “No Hypoxia” at a 96.8-%
Real-Time Machine Learning for ICU Hypoxia Prediction: A Pilot Study 19
performance but has lower precision for “High Level of Hypoxia” at 74.9%. Contrary to the XGBoost model which reached lower accuracy for the high levels of hypoxia, the lowest prediction for the Random Forest model was found for the middle hypoxic class (i.e. low level of hypoxia).
The three-class hypoxia prediction model based on the Random Forest algorithm was exported to the ONNX format, which is a widely accepted standard for model interoperability. The model’s inference performance was evaluated, with a focus on measuring execution times. The mean execu- tion time was 130.87 microseconds (SD = 26.54 µs), that is ∼0.13 ms, demonstrating a reasonably swift prediction process. The distribution of exe- cution times shows that 25% of the inferences were completed within 111 µs, 50% within 122 µs, and 75% within 148 µs. The minimum execution time observed was 96 µs, while the maximum recorded time peaked at 3,785 µs. More than 99.99% of the inferences were executed in less than 1 ms.
DISCUSSION
In the current study, we made use of the eICU database for developing predictive models for the prospective detection of hypoxic events. Using a set of physiological features (namely SpO2, HR, and RR), this study demonstrates the effectiveness of Random Forest and XGBoost models in detecting hypoxia in a three-class classification task. The models achieved high accuracy, precision, and balanced accuracy, as well as F1-scores that validate their proficiency in balancing precision and recall. Examination of the confusion matrices in percentage terms shows commendable preci- sion for the “No Hypoxia” class. Accurately predicting the “Low Level of Hypoxia” and “High Level of Hypoxia” class, however, posed more chal- lenge due to the complexity of discerning subtle variations in hypoxia levels. This suggests the existence of a class that creates uncertainty regarding the hypoxia level. Limitations also emerged with the infrequent class, empha- sizing the need for a more balanced dataset. By obtaining more frequently measured data, it could be possible to extract more relevant frequency features.
Our literature review revealed machine learning models that were designed to detect post-intubation hypoxia during general anaesthesia. These models utilized parameters such as SaO2, mean arterial pressure, and HR, achiev- ing an impressive AUC of 95% (Sippl et al., 2017). This study illustrates the feasibility of using AI for hypoxia prediction. In a separate study con- ducted by Snider et al. (2022), classification models were developed to predict hypoxia episodes using data from wearable dry-EEG sensors. Some stud- ies also utilized heart rate variability and cerebral oxygenated haemoglobin (Snider et al., 2022). In contrast to existing literature, our model employs sim- ple vital signs that are accessible in most contexts using either a smartwatch or basic sensors.
The exportation of the model to the ONNX format highlights the prac- ticality and robust execution of the Random Forest model with a mean execution time of 130.87 µs, indicating potential for tasks with strict latency
requirements. These findings demonstrate the model’s real-world applica- bility, highlighting its efficiency and potential for tasks with strict latency requirements.
Exploring other vital signs or sensors could further enhance model per- formance by reducing reliance on raw data and incorporating more com- prehensive data sources. Implementing a machine learning algorithm in an ICU requires an interpretable approach (Nemati et al.). The SHAP method can be used to clarify the impact of features on the model’s predictions, providing a deeper understanding of its reasoning. This technique enhances the interpretability of machine learning models by transparently revealing each feature’s contribution to the model’s outputs. Adopting SHAP can help clinicians understand the reasoning behind developed prediction models, pro- viding deeper insight into the decision-making process. Another database that is worth exploring for testing and validating the model is the MIMIC III Clin- ical Database. This model, based on ICU data, identifies vital sign patterns specific to hypoxia. It has potential applications in other hypoxic contexts, such as high-altitude climbers or divers. Future studies should test this model on different datasets to validate its effectiveness. The study’s strength lies in its use of real-world ICU patient data, which enhances generalizability compared to artificial laboratory data. Furthermore, automated bedside data collection reduces the risk of errors compared to manual collection. Although the current models exhibit strong performance, it is crucial to address their limitations through balanced data collection and exploration of additional features to enhance their ability to discern hypoxia levels.
CONCLUSION
This pilot study demonstrates the potential of real-time machine learning, using XGBoost and Random Forest, in predicting ICU hypoxia using only the SpO2, HR, and RR features. The model, generating good performance, aimed to allow for timely intervention by predicting hypoxia levels 5 minutes in advance. The optimization of the model, rendered interoperable through the ONNX format, reinforces its utility for ICU patients, underlining the significance of this innovative approach in critical care.
REFERENCES
Annapragada, A. V., Greenstein, J. L., Bose, S. N., Winters, B. D., Sarma, S. V. and Winslow, R. L. (2021) “SWIFT: A deep learning approach to prediction of hypox- emic events in critically-ill patients using SpO2 waveform prediction”, medRxiv. https://doi.org/10.1101/2021.02.25.21252234 Bhutta, B. S., Alghoula, F. and Berim, I. (2022). “Hypoxia”, National Library of
Medecine StatPearls. https://www.ncbi.nlm.nih.gov/books/NBK482316/ Cohen, J. (2009) “Statistical power analysis for the behavioral sciences” (2nd ed., reprint). Psychology Press. Liao, K.-M., Liu, C.-F., Chen, C.-J. and Shen, Y.-T. (2021) “Machine learning
approaches for predicting acute respiratory failure, ventilator dependence, and mortality in chronic obstructive pulmonary disease”, Diagnostics, 11, 2396. https://doi.org/10.3390/diagnostics11122396
Real-Time Machine Learning for ICU Hypoxia Prediction: A Pilot Study 21
Linnville, S., Phillips, J. B., Snider, D. H., Rice, G. M. and Raj, A. (2021) “Dry- EEG indices of normobaric hypoxia in professional pilots”, Defense Technical Information Center. https://apps.dtic.mil/sti/citations/AD1147835 Liu, T., Zhao, Q. and Du, B. (2021) “Effects of high-flow oxygen therapy on patients
with hypoxemia after extubation and predictors of reintubation: A retrospective study based on the MIMIC-IV database”, BMC Pulmonary Medicine, 21, 160. https://doi.org/10.1186/s12890-021-01526-2 Lundberg, S. M., Nair, B., Vavilala, M. S., Horibe, M., Eisses, M. J., Adams, T., Liston, D. E., Low, D. K.-W., Newman, S.-F., Kim, J. and Lee, S.-I. (2017) “Explain- able machine learning predictions to help anesthesiologists prevent hypoxemia during surgery”, bioRxiv. https://doi.org/10.1101/206540 Manninen, P. H. and Unger, Z. M. (2016) “Chapter 21—Hypoxia”, Complica-
tions in Neuroanesthesia, 169–180. https://doi.org/10.1016/B978-0-12-804075- 1.00021-3 Mouradian, V., Famili, A., Kozhemiakina, A. and Ashiani, M. (2018) “Early prediction of hypoxia based on vitals analysis and predictive analytics”, IARIA, 21–24. Nemati, S., Holder, A., Razmi, F., Stanley, M. D., Clifford, G. D. and Buchman, T. G.
(2018) “An interpretable machine learning model for accurate prediction of sepsis in the ICU”, Critical Care Medicine, 46, 547–553. https://doi.org/10.1097/CCM. 0000000000002936 Park, J.-B., Lee, H.-J., Yang, H.-L., Kim, E.-H., Lee, H.-C., Jung, C.-W. and Kim, H.-S. (2023) “Machine learning-based prediction of intraoperative hypox- emia for pediatric patients”, PLoS ONE, 18, e0282303. https://doi.org/10.1371/ journal.pone.0282303 Pollard, T. J., Johnson, A. E. W., Raffa, J. D., Celi, L. A., Mark, R. G. and
Badawi, O. (2018) “The eICU Collaborative Research Database, a freely avail- able multi-center database for critical care research” Scientific Data, 5, Article 1. https://doi.org/10.1038/sdata.2018.178 Putatunda, S. and Rama, K. (2018) “A comparative analysis of hyperopt as against other approaches for hyper-parameter optimization of XGBoost”, International Conference on Signal Processing and Machine Learning, 6–10. https://doi.org/10. 1145/3297067.3297080 Rupp, T., Esteve, F., Bouzat, P., Lundby, C., Perrey, S., Levy, P., Robach, P. and
Verges, S. (2014) “Cerebral hemodynamic and ventilatory responses to hypoxia, hypercapnia, and hypocapnia during 5 days at 4, 350 m”, Journal of Cerebral Blood Flow & Metabolism, 3, 52–60. https://doi.org/10.1038/jcbfm.2013.167 Samuel, J. and Franklin, C. (2008), “Hypoxemia and Hypoxia”, Common Surgical Diseases: An Algorithmic Approach to Problem Solving, 391–394. https://doi.or g/10.1007/978-0-387-75246-4_97 Shenoy, N., Luchtel, R. and Gulani, P. (2020) “Considerations for target oxygen
saturation in COVID-19 patients: Are we under-shooting?”, BMC Medicine, 18, 260. https://doi.org/10.1186/s12916-020-01735-2 Sippl, P., Ganslandt, T., Prokosch, H.-U., Muenster, T. and Toddenroth, D. (2017) “Machine learning models of post-intubation hypoxia during general anesthesia”, Studies in Health Technology and Informatics, 243, 212–216. Snider, D. H., Linnville, S. E., Phillips, J. B. and Rice, G. M. (2022) “Predict-
ing hypoxic hypoxia using machine learning and wearable sensors”, Biomedical Signal Processing and Control, 71, 103110. https://doi.org/10.1016/j.bspc.2021. 103110
Uryumtsev, D. Y., Gultyaeva, V. V., Zinchenko, M. I., Baranov, V. I., Melnikov, V. N., Balioz, N. V. and Krivoschekov, S. G. (2020) “Effect of acute hypoxia on cardiorespiratory coherence in male runners”, Frontiers in Physiology, 11, 630. https://doi.org/10.3389/fphys.2020.00630 van Rossum, M. C., da Silva, P. M. A., Wang, Y., Kouwenhoven, E. A. and Hermens, H. J. (2023), “Missing data imputation techniques for wireless contin- uous vital signs monitoring” Journal of Clinical Monitoring and Computing, 37, 1387–1400. https://doi.org/10.1007/s10877-023-00975-w Wang, Q., Markopoulos, P., Yu, B., Chen, W. and Timmermans, A. (2017) “Interac-
tive wearable systems for upper body rehabilitation: A systematic review”, Journal of Neuroengineering and Rehabilitation, 14, 20. https://doi.org/10.1186/s12984- 017-0229-y World Health Organization. (2023) “Oxygen”, World Health Organization.
LISTED IN THE AHFE DIGITAL BOOKSTORE CATALOGUE
Explore the complete digital volume
Neuroergonomics and Cognitive Engineering
Read this individual research paper free through the original publisher, or explore the full digital proceedings book.
ISBN 978-1-964867-02-1
Explore this ISBN in the AHFE Bookstore ↗Listed in the July 2026 bookstore catalogue; search by ISBN to confirm current availability · Digital book purchase optional