Jonas De Bruyne, Laetitia De Leersnijder, Durk Talsma, Jelle Demanet, Jelle Saldien, Klaas Bombeke (2024). Random Gazes, Telling Eyes: Exploring Gaze Transition Entropy as a Performance Indicator in Evaluating Instructional Designs. In: Neuroergonomics and Cognitive Engineering. AHFE Open Access, vol. 126, pp. 143–153. https://doi.org/10.54941/ahfe1004747
This study explores gaze transition entropy (GTE) as an objective performance measure in industrial assembly training. GTE can be defined as a metric of randomness in gaze patterns over time, with low entropy indicating predictable and structured patterns and high entropy indicating unpredictable and irregular patterns. Using mobile eye-tracking glasses, 28 participants completed a cable assembly task while gaze patterns were analyzed across specific areas of interest (AOIs). Preliminary findings from six participants show decreased GTE with increased task familiarity and task experience. Additionally, preliminary trends suggest a positive relation between GTE and self-reported hesitation, indicating its potential as an objective gauge of uncertainty. Furthermore, a theoretical variation on gaze transition entropy where the effect of consecutive fixations at the same object is factored out is explored. This research offers insights into the potential of using gaze transition entropy to objectively assess hesitation and proficiency in training, providing a potential avenue for enhancing instructional content within instructional design using objective evidence. Further refinement and exploration of gaze transition entropy could significantly impact training quality assessment across diverse domains and can enable promising applications in other fields as well.
If we were to try getting insight into the ins and outs of how a person is solving an assembly task, mere visual observation might not be sufficient. To really understand the individual’s progress in the task, we can, for exam- ple, ask the person—which would impede ongoing task execution—or, a more subtle approach, we can observe the person’s eye movements with
eye-tracking devices. In fact, eye-tracking techniques, either in conjunction with or independently of other psychophysiological measurements, can not only offer insights into human cognitive states and processing, but also detect when things go wrong or when the flow of progress suddenly changes (e.g., detecting when human operators get cognitively overloaded, or start hesi- tating). Albeit an old technique, in recent years, more and more studies have intensively explored eye-tracking techniques to objectively measure cognitive load during various tasks and in a wide range of contexts (Marquart et al., 2015; Tolvanen et al., 2022). Interestingly, in the field of instructional design (i.e., the design of learning processes and educational content in training), this opens the door to automatic evaluation of instructional designs. Where current evaluation methods are cumbersome and rely largely on explicit sub- jective self-reported assessments by subjects, eye tracking techniques can serve as objective, swift and automatic assessment methods.
Eye tracking offers various possibilities to investigate cognitive states. First, there is pupillometry. A well-established relation exists between pupil dilation and cognitive load (Gavas et al., 2017; Just et al., 2003; Krejtz et al., 2018; van der Wel and van Steenbergen, 2018). As a result, one can assess a user’s cognitive state while performing a task. However, due the larger pupillary light reflex, pupillometry is typically—and, ideally—used in well-controlled lab environments (Beatty and Lucero-Wagoner, 2000). Blinking, another eye- related function, also reflects cognitive states beyond its primary role in eye maintenance. Attributes like blink rate, variability, and duration convey information about cognitive states from mind wandering to sustained atten- tion, fatigue and cognitive load (Maffei and Angrilli, 2018; Perkhofer and Lehner, 2019; Smilek et al., 2010). However, using blinks to assess cognitive states in applied contexts is challenging due to their links to various cognitive, behavioral, and functional aspects. Interestingly, blink rate is shown to have a positive correlation with cognitive load during assembly work, despite high visual load (Biondi et al., 2023).
Researchers have also investigated other eye-related measures and their relationship with cognitive states—number of fixations, average fixation duration and number of saccades (Perkhofer and Lehner, 2019; Zagermann et al., 2018). Also, gaze dispersion and patterns can be investigated. For example, through heat maps or scan path plots. A measure that has gained increased attention in recent years is gaze entropy, often referred to as gaze transition entropy (GTE). GTE is a measure of unpredictability (or random- ness) in a participant’s gaze pattern, where higher values indicate a less structured, thus more chaotic, gaze pattern. This way, one of the character- istics of a gaze pattern, usually studied though scan paths, can be quantified. The idea of quantifying statistical dependencies in gaze patterns was initially introduced by Ellis and Stark (1986) and later developed further by multiple researchers (Hwang et al., 2011; Krejtz et al., 2015, 2014; Vandeberg et al., 2013) and used in a wide range of applications such as academic poster com- prehension (Hao et al., 2019), visual exploration of faces in autistic children (Shic et al., 2008), or cognitive load of surgeons during surgery (Di Stasi et al., 2016). Mathematically, GTE over different areas of interest (AOIs; i.e., predefined areas in the visual scene) finds its roots in information theory.
Random Gazes, Telling Eyes: Exploring Gaze Transition Entropy 145
By modelling gaze transitions as first-order Markov chain processes, the com- plexity in a gaze pattern (i.e., sequence of AOIs) can be expressed in terms of (normalized) Shannon’s Entropy and statistically compared (Krejtz et al., 2015). It is intuitively clear that GTE can be employed as a marker for concepts such as experienced difficulty, hesitation, cognitive (over)load and instruc- tion comprehension in industrial assembly training contexts. However, this has not yet been investigated. GTE as one of the objective performance mark- ers other than the evident accuracy and speed can potentially inform future instructional designs as instructions that elicit, for instance, hesitation or cog- nitive overload can easily and automatically be detected and optimized. The current study explores GTE as a potential performance marker in a step-by- step cable assembly task using mobile eye trackers in a dataset collected for a broader eye-tracking study. While there might be applications for individual performance evaluation (e.g., real-time evaluation to steer operator support systems), this study—as an initial exploration and given the nature of the use case—focusses on the potential of the marker to use it as a tool to evalu- ate instruction quality. Additionally, a new variation on GTE compared to that introduced by Krejtz et al. (2015) is explored, aiming at controlling for specific eye behavior that is not of interest.
METHOD
Participants 28 participants (7 female, Mage = 23.7 years old) voluntarily took part in this study. Given the exploratory nature of this work, 6 participants (1 female; Mage = 25.5 years old) were selected at random for inclusion in the current initial analysis. Each participant signed informed consent and received movie theatre vouchers.
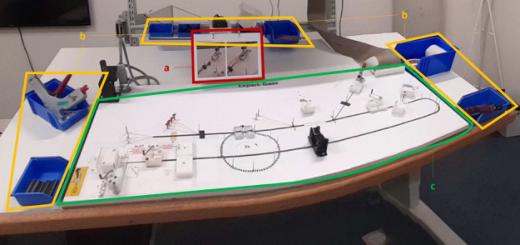
Figure 1: Overview of the workspace during the experiment. a) Instruction flip chart; b) storage boxes; c) cable assembly board.
Equipment and Assembly Task The study employed a cable assembly training conducted on a pow- ered assembly board (Figure 1), replicating real cable assembly workplace practices, which was mounted on a height adjustable worktable. The cable
board was surrounded by storage boxes containing tools or materials. To the right of the assembly table (not shown in Figure 1), a rack stored some neces- sary cable parts. Above the cable assembly board, a small flip chart displayed paper instructions, with each card presenting instructions on the front and a QR code on the back. A scanner behind the flip chart automatically times- tamped QR codes when participants flipped cards to advance to the next instruction.
The task comprised 19 major steps, further divided into 42 substeps. Each step’s instruction card included a textual description and two pictures—one illustrating the current situation and the other depicting the end state of that step.
Tobii Glasses 2 were used to record eye tracking data. They are mobile eye trackers that look similar to regular glasses, capturing data at 100 Hz. Simultaneously, the mobile eye tracker recorded a first-person video for gaze object/AOI identification during video coding (i.e., “Fixation X was in AOI Y”). A total of 34 AOIs were defined.
Procedure Participants first signed informed consent and were then introduced to the task and the cable board. Following the introduction, they wore mobile eye- tracking glasses and underwent the standard calibration procedure for Tobii Glasses 2. The experiment proceeded without time constraints, allowing participants to navigate without immediate corrections for mistakes. Exper- imenter intervention occurred only when errors led to dead ends, and those specific steps were subsequently excluded from the data. The task was per- formed twice. Due to the relatively simple nature of the training characterized by steep learning curves, participants could be considered to have already attained a certain expert level during the second run (R2) of the task because of what they learned in the first run (R1). After each run, participants evalu- ated their hesitation levels for each step on a scale from 0 to 2: indicating no hesitation, a slight amount of hesitation, or a significant amount of hesitation, respectively.
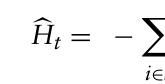
Gaze Transition Entropy Gaze entropy scores were calculated using the procedure proposed by Krejtz et al. (2015). In short, we started by creating a transition matrix using the consecutive fixation during the performance of each step. This transition matrix includes—based on the observations in a specified time interval—cells of which the value in row i and column j represents the empirical probability that the next fixation would be to the in the jth AOI if the current one is in the ith AOI. In other words, each row and column in the matrix corresponds to a specific AOI, and the values in the cells indicate the likelihood of tran- sitioning from one area to another. AOIs are collected in set S = {1, …, s} which is the state space of the Markov process. A sequence of fixations are modelled as a Markov chain with constant probabilities pij and stationary probabilities πi, where i, j ∈S. Based on the transition matrix a stationary distribution π can be calculated. The eventual formula used to calculate GTE
Random Gazes, Telling Eyes: Exploring Gaze Transition Entropy 147
was a modified version of Shannon’s entropy formula:
X
X πi pijlognspij.
Equation reproduced from the original PDF.
The difference between our formula and the one used by Krejtz et al. (2015) is the choice for the base of the logarithm. By setting the base of the logarithm at nS (i.e., the number of AOIs) which is a constant for all calcu- lations within this study—the number of AOIs in the workspace remained unchanged throughout the experiment—a more interpretable scale for GTE is obtained, now spanning from 0 to 1 (from fully predictable to fully random gaze pattern, respectively).
Another modification to the procedure of Krejtz et al. (2015) that is explored in the current work stems from the theoretical implications of retaining consecutive fixations in the same AOI in the transition matrix. In the original approach, extended focus on a specific AOI (e.g., while read- ing instructions presented in one AOI) leads to decreased GTE, indicating a more predictable gaze pattern. This occurs as prolonged attention increases the likelihood of consecutive AOIs being the same, reducing the variability and randomness in eye movements. This would imply that, for instance, when a participant is reading something in a specific AOI for a longer period (e.g., reading instructions), this would result in lower GTE. Therefore, we explore a variant to GTE factoring out the influence of such consecutive fixations. We will refer to this variation of GTE as modified gaze transition entropy (mGTE). Mathematically, this can be obtained by zeroing out the diagonal of the transition matrix with the absolute values of the observed transitions before the values are converted to the constant probabilities pij. The other steps in the procedure were identical to Krejtz et al.’s (2015).
Data Analysis GTE and mGTE were calculated at two levels. First, (m)GTE was separately calculated for the entire duration of each run completed by every partici- pant. Second, gaze entropy was calculated for each step separately. Data during steps that were irrelevant to the assembly, very short steps (< 10 fixa- tions), and steps during which the experimenter had to intervene, or help were deleted from the latter calculations, but were retained for the assembly-level entropy calculations.
Given the small sample size (N = 6), performing classical parametric sta- tistical analyses is unsensible. Therefore, non-parametric tests have been performed as they do not pose assumptions on, for instance, the distribution of the data and because they can handle small datasets. However, we under- line the exploratory nature of the current work. The non-parametric method that fits the current dataset is the (one-sided) Wilcoxon signed-ranks test for 2 dependent samples. In case of significant effects, effect size r is reported. However, given the small sample size not all tests could be performed. There- fore, additional descriptive analyses are reported to provide preliminary ideas on trends and potential.
RESULTS
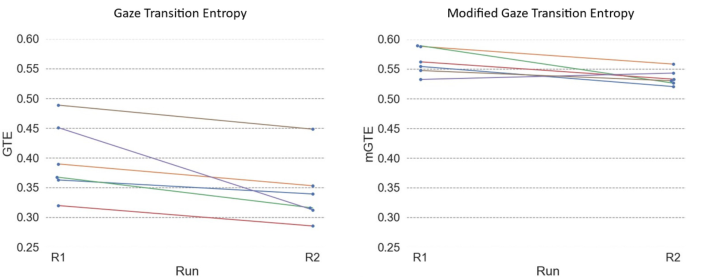
GTE calculated across full assemblies was significantly larger for the first run (R1) (Mdn = 0.378) compared to during the second run (R1) (Mdn = 0.327), Z = −2.42, p = 0.016, r = 0.90. This is in line with the expectations given the increased experience and proficiency of the participants the second time they performed the task. Similarly, mGTE across full assemblies was also larger for the first run (Mdn = 0.558) compared to the second time participants per- formed the assembly task (Mdn = 0.531), Z = −2.15, p = 0.031, r = 0.81. To gain better understanding of the new measure mGTE, the descriptive data analysis results revealed that GTE calculated across full assemblies ranges between 0.285 and 0.489 while mGTE showed less variability with a minimum of 0.520 and a maximum of 0.590 (Figure 2).
When exploring GTE calculated on separate steps across both runs, we observed a broader distribution for mGTE (SD = 0.121) than for GTE (SD = 0.080). Zooming in, mGTE was (close to) zero (< 0.001) for 24 steps. These steps also had a low value for GTE (0.067–0.197). When investigating the corresponding transition matrices, we found that these steps were char- acterized by a rather directional gaze pattern with minimal to none revisits to previous AOIs. Such gaze patterns exhibited a high level of predictability, especially when we excluded consecutive gazes to the same AOI. For exam- ple, if a participant’s gaze pattern was A-A-A-B-C-D, the only uncertainty stemmed from the transitions when currently fixated on A. By removing the influence of consecutive fixations within the same AOI, the gaze pattern transformed into a deterministic sequency (A-B-C-D), resulting in a highly predictable transition matrix.
Figure 2: (Modified) gaze transition entropy scores calculated on gaze patterns across entire assembly runs for each individual.
When examining the potential connection between (m)GTE and subjec- tive ratings of hesitation, participants infrequently reported hesitation during steps. Among the 6 analyzed participants, 12 instances indicated a lot of hesitation, and 46 instances noted little hesitation during a step, with the remaining steps (400) reported as without hesitation. Given the limited instances with hesitation, the self-reported hesitation scores were categorized
Random Gazes, Telling Eyes: Exploring Gaze Transition Entropy 149
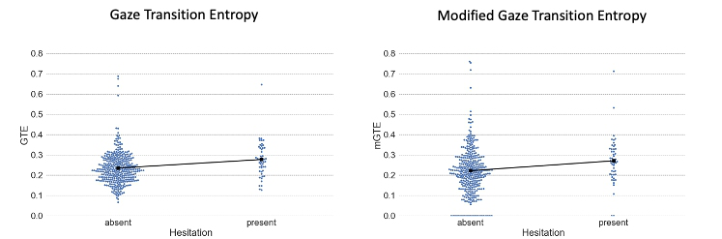
as present or absent. Despite data imbalance, a slight positive trend emerged, showing higher mean GTE and mGTE values for steps with reported hesita- tion compared to those without (Figure 3). Notably, the substantial shift in absolute values from GTE to mGTE seen in the full assembly analysis was absent when considering individual steps.
Figure 3: (Modified) gaze entropy scores calculated on step-level. Black squares indicate mean values.
Upon closer examination, we performed step-level analyses. However, given the sample size, in-depth analyses per step were impossible with the available analysis methods. Therefore, only tests on aggregated data across steps were conducted. To do so, we divided the dataset into two dis- tinct dataset: one containing data of steps where participants (individually) reported hesitation during the first run and did not do so during the second run (hesitation – no hesitation; H-NH dataset) and a dataset only contain- ing data of times where participants reported no hesitation during both the first and the second run (no hesitation – no hesitation; NH-NH dataset). If the hypotheses were correct, we would be able to see a stronger decrease in (m)GTE in the first compared to the second dataset. Results showed a sig- nificant decrease in step-level GTE from the first run (Mdn = 0.262) to the second run (Mdn = 0.182) in the H-NH dataset, Z = −2.15, p = 0.031, r = 0.91. The same applied for the NH-NH dataset, where again, the second run showed lower step-level GTE during the first (Mdn = 0.246) compared to during the second run (Mdn = 0.225), Z = −2.42, p = 0.016, r = 0.90. For mGTE however, this difference was only observed in the NH-NH dataset (MdnR1 = 0.236 and MdnR2 = 0.207), Z = −2.15, p = 0.031, r = 0.81, and not in the H-NH dataset (p = 0.219). We observe that the difference in effect size for the effects found in the H-NH and NH-NH datasets for GTE is negligible.
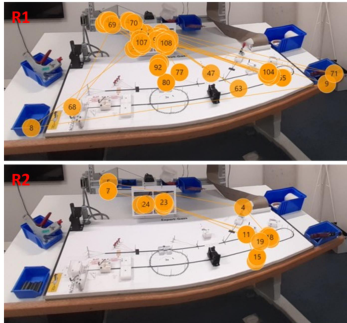
To exemplify what (m)GTE quantifies, figures were generated to illustrate the gaze path of an individual during a specific step (step 9.01) in two runs (Figure 4). In this step, participants were required to locate the correct con- nector piece, place it in a mold at a specific location on the board, and ensure the correct orientation. In the first run, the participant’s gaze path was more chaotic, with higher saccade frequency between AOIs. GTE and mGTE values for the first run were 0.350 and 0.306, respectively. The second run showed
a more organized gaze pattern, with GTE and mGTE values of 0.264 and 0.175.
Figure 4: Gaze paths of one participant during step 9.01 during the first (R1) and the second run (R2). Fixations are presented as colored circles and saccades as lines. The numbers indicate the order of the fixations.
DISCUSSION
This study explored whether gaze transition entropy (GTE) can be used as an objective performance marker in industrial assembly contexts. Using data of a larger eye tracking study, the measure GTE and a variation on GTE (mGTE; i.e., GTE controlling for consecutive fixations within the same AOIs) were investigated on their potential usefulness as a performance marker during assembly work. Specifically, as a first step in this endeavor, GTE was explored as a marker potentially highlighting experienced difficulty during assembly trainings (e.g., cognitive overload, hesitation, etc.), or performance in short.
Preliminary results show a strong negative relation between (m)GTE and experience with the task, suggesting that when participants are better pre- pared and experienced, their (eye) behavior is more structured and decisive. Importantly, this was mainly observed when GTE and mGTE were calculated across the full assembly task. This finding suggests a potential usefulness to evaluate concepts such as learning, efficiency, or experience when (m)GTE is used on task level.
When investigating (m)GTE values for each separate step, the data sug- gested a slight positive relation with self-reported hesitation. Additionally, similar to the task-level analysis, a significant relation between (m)GTE and experience with the task (first vs. second run) was observed.
The results underline the potential of GTE as an evaluation marker in assembly-like contexts. When used at group level, it can especially be use- ful to evaluate instructional designs—if everyone has difficulties with step X, those instructions should be improved.
Although on the theoretical level GTE and mGTE are rather non- interchangeable, the data showed only minimal differences when it is used
Random Gazes, Telling Eyes: Exploring Gaze Transition Entropy 151
in the current context. At the descriptive level, we observed more variability and lower absolute values for GTE compared to mGTE. However, both mea- sures did not give significantly different results. This may be attributed by the task’s nature and the instructions. In case of more complicated, textual instructions that would require extensive reading, we would expect larger dif- ferences between GTE and mGTE because of the more frequent consecutive fixations in the same AOI.
This study underlines the promising opportunities of applying techniques from information theory to evaluate instructional design. Exploring further, future research should consider investigating the concept of mutual informa- tion (Hao et al., 2019) between the AOI housing the instructions and another AOI to strengthen GTE results. On an abstract level, mutual information rep- resents that knowledge obtainable in AOI X decreases the uncertainty when at AOI Y. Based on this, it could be hypothesized that well-designed and clear instructions would have increased mutual information with other AOIs compared to poorly designed and confusing instructions.
Although for now, the main application of GTE for instructional design evaluation–as we learned from this study—encompasses group-level analyses, another aspect that is worth exploring is the potential real-time possibility of GTE. A (quasi-)real-time variant of gaze transition entropy would make it possible to monitor workers or trainees online. This would allow for quicker iterations to improve usability, user experience and learning. Importantly, real-time GTE opens possibilities beyond instructional design evaluation, extending to applications such as adaptive operator support systems (cf. Dimitropoulos et al., 2021). The most critical challenge for real-time GTE, however, will be the definition of the time window size. GTE is calculated on data from a specific time interval. Therefore, GTE can only be quasi-real- time since it would be calculated on the last updated data slice. The size of this time-window, however, can greatly influence gaze transition entropy and should be carefully considered.
A crucial consideration pertains to the nature of the task or training. While (m)GTE shows to be a promising marker in structured, step-wise instruc- tional designs where adherence to distinct steps is expected and advisable, its utility may diminish in tasks granting participants the freedom to choose their own strategies. In such tasks, it might be beneficial to explore more which would possibly lead to higher (m)GTE values. Another important note lies in the interpretation of the absolute values of GTE and mGTE scores. Although the scores are useful when different gaze paths are compared, they are hard to interpret when they are presented on their own. Future research should, if possible, consider working towards guidelines that can be used to interpret the absolute values in their specific context. Furthermore, investigating the distinctive features of various industrial tasks and establishing guidelines for the indicative efficacy of specific eye tracking markers, such as GTE, for dif- ferent behavior or cognitive states in different task types, would enrich the field with a tailored toolbox for operator evaluation.
In conclusion, GTE (and its variants) can serve as a valuable marker in the toolbox of the instructional designer to objectively evaluate instructional
designs of trainings. However, the results of this study leave open the ques- tion of the range of constructs or behaviors to which it is linked. For example, this study showed that GTE could be brought in relation to experience with the training, but it remains unclear which underlying factors are at play (e.g., more decisive execution of the task, less cognitive load, etc.). Although the current results suggest promising potential applications, further research should consider specific experiments to disentangle the underlying processes of changes in GTE.
ACKNOWLEDGMENT
We thank Hester van der Steen and Dominique Kesteloot of WAAK Maatwerkbedrijf vzw for making this research possible and for assisting in data collection.
This work was part of the larger TETRA ExpertGaze project funded by VLAIO (project id: HBC20202080).
The work of Jonas De Bruyne is supported by Research Foundation - Flanders (FWO fellowship; 11PEL24N).
REFERENCES
Beatty, J. and Lucero-Wagoner, B. (2000) ‘The pupillary system.’, in Handbook of psychophysiology, 2nd ed. New York, NY, US: Cambridge University Press, pp. 142–162. Biondi, F. N. et al. (2023) ‘Distracted worker: Using pupil size and blink rate to detect
cognitive load during manufacturing tasks’, Applied Ergonomics, 106, p. 103867. Available at: https://doi.org/https://doi.org/10.1016/j.apergo.2022.103867. Dimitropoulos, N. et al. (2021) ‘Operator support in human–robot collaborative environments using AI enhanced wearable devices’, Procedia CIRP, 97, pp. 464–469. Available at: https://doi.org/10.1016/j.procir.2020.07.006. Ellis, S. R. and Stark, L. (1986) ‘Statistical Dependency in Visual Scanning’, Human
Factors: The Journal of the Human Factors and Ergonomics Society, 28(4), pp. 421–438. Available at: https://doi.org/10.1177/001872088602800405. Gavas, R., Chatterjee, D. and Sinha, A. (2017) ‘Estimation of cognitive load based on the pupil size dilation’, in 2017 IEEE International Conference on Systems, Man, and Cybernetics (SMC), pp. 1499–1504. Available at: https://doi.org/10.1109/SM C.2017.8122826. Hao, Q., Sbert, M. and Ma, L. (2019) ‘Gaze Information Channel in Cognitive
Comprehension of Poster Reading’, Entropy, 21(5), p. 444. Available at: https: //doi.org/10.3390/e21050444. Hwang, A. D., Wang, H.-C. and Pomplun, M. (2011) ‘Semantic guidance of eye movements in real-world scenes’, Vision Research, 51(10), pp. 1192–1205. Available at: https://doi.org/10.1016/j.visres.2011.03.010. Just, M. A., Carpenter, P. A. and Miyake, A. (2003) ‘Neuroindices of cognitive work-
load: Neuroimaging, pupillometric and event-related potential studies of brain work’, Theoretical Issues in Ergonomics Science, 4(1–2), pp. 59–88. Available at: https://doi.org/10.1080/14639220210159735. Krejtz, K. et al. (2014) ‘Entropy-based statistical analysis of eye movement transitions’, in Proceedings of the Symposium on Eye Tracking Research and Applica- tions. New York, NY, USA: ACM, pp. 159–166. Available at: https://doi.org/10. 1145/2578153.2578176.
Random Gazes, Telling Eyes: Exploring Gaze Transition Entropy 153
Krejtz, K. et al. (2015) ‘Gaze Transition Entropy’, ACM Transactions on Applied Perception, 13(1), pp. 1–20. Available at: https://doi.org/10.1145/2834121. Krejtz, K. et al. (2018) ‘Eye tracking cognitive load using pupil diameter and
microsaccades with fixed gaze’, PLoS ONE, 13(9). Available at: https://doi.or g/10.1371/journal.pone.0203629. Maffei, A. and Angrilli, A. (2018) ‘Spontaneous eye blink rate: An index of dopaminergic component of sustained attention and fatigue’, International Journal of Psychophysiology, 123, pp. 58–63. Available at: https://doi.org/10.1016/j.ijpsyc ho.2017.11.009. Marquart, G., Cabrall, C. and de Winter, J. (2015) ‘Review of Eye-related Mea-
sures of Drivers’ Mental Workload’, Procedia Manufacturing, 3, pp. 2854–2861. Available at: https://doi.org/10.1016/j.promfg.2015.07.783. Perkhofer, L. and Lehner, O. (2019) ‘Using Gaze Behavior to Measure Cognitive Load’, in F. D. Davis et al. (eds) Information Systems and Neuroscience. Cham: Springer International Publishing, pp. 73–83. Shic, F. et al. (2008) ‘Autism, eye-tracking, entropy’, in 2008 7th IEEE International
Conference on Development and Learning. IEEE, pp. 73–78. Available at: https: //doi.org/10.1109/DEVLRN.2008.4640808. Smilek, D., Carriere, J. S. A. and Cheyne, J. A. (2010) ‘Out of mind, out of sight: eye blinking as indicator and embodiment of mind wandering.’, Psychological sci- ence : a journal of the American Psychological Society / APS, 21(6), pp. 786–789. Available at: https://doi.org/10.1177/0956797610368063. Di Stasi, L. L. et al. (2016) ‘Gaze entropy reflects surgical task load’, Surgi-
cal Endoscopy, 30(11), pp. 5034–5043. Available at: https://doi.org/10.1007/ s00464-016-4851-8. Tolvanen, O. et al. (2022) ‘Eye-Tracking Indicators of Workload in Surgery: A Systematic Review’, Journal of Investigative Surgery. Taylor and Francis Ltd., pp. 1340–1349. Available at: https://doi.org/10.1080/08941939.2021.2025282. Vandeberg, L. et al. (2013) ‘Detecting cognitive interactions through eye movement
transitions’, Journal of Memory and Language, 69(3), pp. 445–460. Available at: https://doi.org/10.1016/j.jml.2013.05.006. van der Wel, P. and van Steenbergen, H. (2018) ‘Pupil dilation as an index of effort in cognitive control tasks: A review’, Psychonomic Bulletin and Review. Springer Science and Business Media, LLC, pp. 2005–2015. Available at: https://doi.org/ 10.3758/s13423-018-1432-y. Zagermann, J., Pfeil, U. and Reiterer, H. (2018) ‘Studying eye movements as a basis
for measuring cognitive load’, in Conference on Human Factors in Computing Systems - Proceedings. Association for Computing Machinery. Available at: https: //doi.org/10.1145/3170427.3188628.
LISTED IN THE AHFE DIGITAL BOOKSTORE CATALOGUE
Explore the complete digital volume
Neuroergonomics and Cognitive Engineering
Read this individual research paper free through the original publisher, or explore the full digital proceedings book.
ISBN 978-1-964867-02-1
Explore this ISBN in the AHFE Bookstore ↗Listed in the July 2026 bookstore catalogue; search by ISBN to confirm current availability · Digital book purchase optional