Aleksandra Zheleva, Michał Kacper Gil, Edoardo Pelosin, Durk Talsma, Lieven De Marez, Klaas Bombeke (2024). Kitchen Horrors: Unraveling the Influence of Multimodal Stressors on User Experience in Virtual Reality through Electrodermal Activity. In: Human Factors in Virtual Environments and Game Design. AHFE Open Access, vol. 137, pp. 10–19. https://doi.org/10.54941/ahfe1004982
The last couple of years have seen a surge in the quality of on-site multiplayer virtual reality experiences. The shift to standalone VR headsets, the decrease in latency and the increase in reliability of rendering VR content have all benefited the rise of VR entertainment parks. The next frontier, however, seems to be the inclusion of sensor data (e.g., electrodermal activity signals) to aid the creation of adaptive VR experiences that are equally immersive for all users. If we can assess the specific impact certain stimuli have on the user during an immersive experience, creators will not only be able to create more engaging content but also design feedback loops to bring to users personalized VR experiences in real time. The current study takes a vital step in this direction by measuring electrodermal activity (EDA) to differentiate between stress responses to visual, audio, and audio-visual stimuli in a haunted VR kitchen game. The study leverages data from 13 participants who underwent a 40-minute-long virtual reality experience. The analysis suggests that relying solely on cleaned EDA data to differentiate between stress and no-stress conditions may not be effective, despite subjective reports of such distinctions. However, a more detailed analysis of EDA features (i.e., EDA peak amplitude and SCR peak amplitude) reveals the ability to not only differentiate between the impact of various stimuli modalities (audio, visual, and audio-visual) on stress responses but also discern between individuals’ responses. These findings underscore the imperative for adaptive VR experiences tailored to the unique responses of individual users, pointing towards a future where personalized, real-time immersive experiences can be finely crafted based on users' physiological reactions.
Kitchen Horrors: Unravelling the Influence of Multimodal Stressors 11
captivate users (The Park Playground, 2022). However, a significant chal- lenge arises due to the large differences in how users respond to VR content. For instance, individuals may react differently to jump scares in a VR hor- ror game, influencing their level of immersion and enjoyment. To address this variability, one promising approach is the development of adaptive virtual environments (VEs). These environments dynamically detect users’ experience features, such as stress responses, in real time and adjust the VE accordingly. The current study takes the initial step in this direction by exploring the integration of a wearable electrodermal activity (EDA) sensor, specifically EmotiBit (Montgomery et al., 2023), in a VR haunted kitchen game. The goal is to determine the reliability of this sensor in detecting par- ticipants’ unique reactions to multimodal stressors, including audio, visual, and audio-visual stimuli.
Limitations of Current VR Experiences As noted by Slater (2003), “Given the same immersive system, different peo- ple may experience different levels of presence” (p. 2). Individual variations in cognitive styles, personality traits, and user expectations contribute to diverse perceptions and engagements with virtual content (Slater and Wilbur, 1997). Achieving universality in users’ VR experiences becomes challenging when considering these individual nuances. Thus, there is a growing inter- est in developing VEs capable of quantifying users’ unique experiences and dynamically adjusting the environment to achieve a universally immersive VR experience.
Building on the exploration of individual differences in experiencing VR content, our investigation delves into stress responses triggered by stimuli incorporated in a VR experience. Specifically, we examine stress-inducing stimuli, such as scares, which evoke strong and universal human reac- tions (Lazarus, 1993). The prevalence of scares in immersive games under- scores their relevance to virtual environments. Additionally, the association of scare stimuli with the arousal system allows for measurable responses through wearables, providing an objective means of assessing stress responses (Boucsein, 2012).
The current study pays particular attention to inducing stress through multimodal stressors (audio, visual, and audio-visual) incorporated in a VR haunted kitchen game. Our goal is to unravel the nuanced impact of these modalities on users’ unique stress responses within VR. This research builds upon the understanding that the user experience in a VE is not solely deter- mined by individual differences but also influenced by the engagement of different human senses (Dinh et al., 1999; Feng et al., 2016). Indeed, Melo & colleagues (2022) highlight the potential benefits of multisensory (e.g., audio, and visual) stimulation in VEs. Nevertheless, they also present evidence sug- gesting that the addition of modalities may not uniformly impact the overall user experience but could influence how participants respond to specific stim- uli (Melo, 2022). Against this backdrop, our study aims to contribute to the ongoing discourse by investigating the effect of stimuli of different modalities, namely visual, audio, and audio-visual on the users’ electrodermal activity (EDA) in VR.
Rationale for Including Sensor Data The rationale for including sensor data in this exploration study lies in the crucial need to adapt the environment to individual responses. In this con- text, EDA emerges as a promising sensor, offering real-time insights into users’ responses within VEs (Kivikangas et al., 2011; Picard et al., 2001). EDA data allows us to investigate the intensity and patterns of users’ reac- tions to different stimuli, particularly sensitive to stress and arousal levels. Analysing EDA data in the context of various stressors can unravel nuanced variations in users’ responses, contributing to a comprehensive understand- ing of individual stress dynamics during a VR experience. Integrating EDA data in VR experiences not only enhances understanding but also paves the way for real-time personalization through feedback loops. This adaptability ensures that VR content dynamically aligns with users’ evolving emotional responses, allowing active shaping of VR experiences.
To guide our investigation, we formulated three research questions (RQs). Answering these questions will inform the development of adaptive VR experiences, paving the way for more engaging VR interactions.
RQ1. Can electrodermal activity data effectively detect the users’ stress response in a VR haunted kitchen game?
RQ2. Do stimuli of varying modalities (audio, visual and audio-visual) induce different electrodermal activity responses in VR?
RQ3. Do stimuli of varying modalities (audio, visual and audio-visual) induce different electrodermal activity responses in VR between participants?
METHODOLOGY
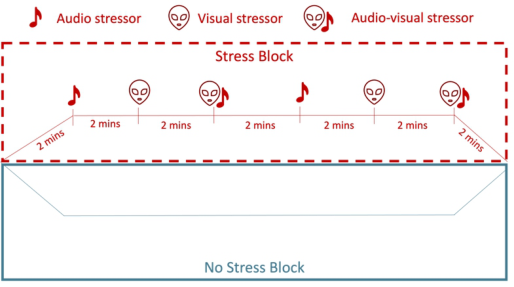
Design This study used a within-subjects design with two 14 minutes long conditions (stress vs. no stress) of a VR haunted kitchen game. To address potential biases, the Balanced Latin Squares technique controlled for order effects and sequence variations (Johnson & Wichern, 2007). In the stress condi- tion, participants experienced six stimuli (two audio, two visual, and two audio-visual) in semi-randomized sequences, generating 13 scenarios. Stim- uli were presented every two minutes for systematic exposure (Figure 1). The no-stress condition had no stimuli. Ethical approval was obtained from the Ghent University Faculty of Political and Social Sciences Ethical Committee (2021-51).
Participants A cohort of 17 participants (Nfemale = 8; Mage = 27.3) was initially recruited through snowball sampling in a Ghent library. However, due to EDA data loss caused by network issues, the analysis is based on 13 participants (Nfemale = 5; Mage = 27.3).
Measurement Instruments EDA data was collected via the EmotiBit sensor (Montgomery et al., 2023). To integrate the EmotiBit seamlessly with the VE the following
Kitchen Horrors: Unravelling the Influence of Multimodal Stressors 13
custom-developed steps were followed. First, the EmotiBit’s connectivity to a local Wi-Fi network was established, which facilitated the sensor’s connec- tion to the EmotiBit Oscilloscope (Montgomery et al., 2023), allowing data streaming through the Open Sound Control (OSC) communication protocol (as of April 24, 2023). Then, customization of the IP address, Wi-Fi port, and data types, was done through a.xml file. For streaming data to Android devices, such as the HTC Vive Focus 3 used in the current study, specific IP and port configurations were utilized. Finally, the Unity project that hosted the VR experience leveraged the OSC Jack package, establishing a connection through a scriptable. Within the scene, an empty object equipped with the OSC Event Receiver script facilitated the configuration of the OSC address, data type, and function invocation upon receiving an OSC message.
Additionally, two questionnaires were administered. A demographics questionnaire, programmed using Microsoft Forms, collecting information about the research sample (i.e., age and gender) and a questionnaire assessing the participants’ subjective experiences of stress (Lang, 1980) administered in VR.
Figure 1: The design of the two conditions. Stress condition – red dashed box on top. This illustrates one of the 13 possible sequences of appearance of the six stimuli. No stress condition – blue full-line box at the bottom.
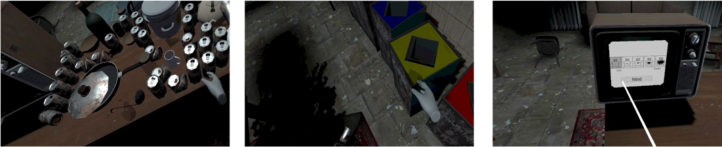
Experimental Task The VR task required participants to be immersed in a VR haunted kitchen which they had to clean up (Figure 2). The environment consisted of (1) a table with a TV on which participants received instructions and question- naires; (2) different objects placed on the table; (3) three recycling bins; (4) a shelf on which participants could place clean pots; (5) furniture that increased the visual fidelity of the VE.
Participants were instructed to either sort out the trash or place the clean dishes on the shelf. In the stress condition, while cleaning up, participants experienced six different stimuli – one visual of a zombie, one visual of a possessed woman, one audio of a zombie screaming, one audio of a woman screaming, one screaming zombie and one screaming possessed woman. Fol- low the link to see a video demonstration of the VR environment https: //osf.io/ydv7j/?view_only=39837d1e4cf5447094ee0ca6b5ea967b.
Figure 2: The virtual environment. From left to right: (1) the table with objects; (2) the garbage bins; (3) the SAM questionnaire.
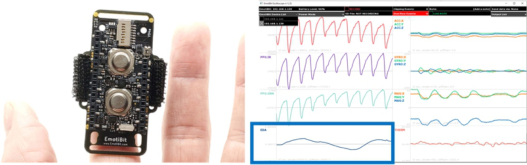
Procedure First, participants were asked to complete the demographic questionnaire on a laptop. Next, they were informed about the experimental procedure and were asked to put the EmotiBit on the index finger of their non-dominant hand (Figure 3). Then, the experimenter checked the quality of the EmotiBit signal via the Oscilloscope (Figure 3). If there was a lack of signal (illustrated by a flat line and a value of 0 seen in the Oscilloscope) the EmotiBit location was slightly adjusted. Once the signal was stable, the experimenter helped the participant put on the HTC Focus 3 wireless headset (HTC Corporation, 2021) and gave them the controller in the EmotiBit free hand. Participants acclimated to the VE (5 minutes) in the Vive welcome scene before entering the haunted kitchen. Before each block, a detailed expla- nation of the task and VR controller was presented on the TV in the VR scene. Following the explanation, the block automatically started. After com- pleting the first block (14 minutes), participants filled out a user experience questionnaire, displayed on the TV in the virtual environment. The second block then automatically began, followed by the same questionnaire. Follow- ing the final block’s questionnaire, the application automatically closed, and both EDA and questionnaire data were sent to the headset’s internal storage. Participants removed the headset and underwent debriefing.
Figure 3: Left: the EmotiBit sensor box placed on the index figure (EmotiBit, 2024). Right – the EmotiBit Oscilloscope. This photo is for demonstration only; in the actual experiment, the two circular EDA sensors were placed face down, contacting the par- ticipant’s skin. The EDA signal is highlighted in the full blue line box at the bottom left of the screenshot.
Data Preprocessing and Analysis EDA data preprocessing was conducted in Python (Van Rossum and Drake, 2009) with the NeuroKit2 library (Makowski et al., 2021). The eda_process
Kitchen Horrors: Unravelling the Influence of Multimodal Stressors 15
and eda_eventrelate functions were used to generate a cleanEDA data frame and a dictionary with extracted features (i.e., EDA Peak Amplitude, SCR Peak Amplitude). EDA Peak Amplitude was chosen because it measures the maximum phasic signal change, capturing rapid responses to stimuli in the VR experience. The SCR Peak Amplitude captured the maximum ampli- tude of the first EDA response in each epoch. Then we epoched the signal around each stressor’s occurrence (−1s to +10s). We took the second before a stimulus occurred to baseline the EDA signal per participant.
Data analysis was done via JASP (JASP Team, 2024). After assessing vari- able distributions, a paired sample t-test compared the EDA cleaned data signal between stress and no-stress conditions. Subjectively reported stress differences were examined using a Wilcoxon Signed Rank test due to the non- normal distribution of the variables. Two repeated measure ANOVA models (RM ANOVA) explored the influence of stressor modality (audio, visual, and audiovisual) on (1) EDA Peak Amplitude and (2) SCR Peak Amplitude. Later, participant id was added as a covariate to each RM ANOVA to explore the effect of individual differences. Finally, due to the rather small sample, we chose to report omega squared (ω2) as an estimate of the effect size. The ω2 accounts for the variability within groups (mean square within) and adjusts the eta-squared (η2) by considering the degrees of freedom between groups.
RESULTS
For interpretation purposes, we will report the results of the current study per research question.
RQ1. Can electrodermal activity data effectively detect the users’ stress response in a VR haunted kitchen game?
When looking at the overall stress response in participants we found no difference in the mean clean EDA signal of the stress condition (M = 2.21; SD = 1.39) compared to the no-stress condition (M = 2.20; SD = 1.37), t(12) = 0.03, p = 0.97. Interestingly, we found a significant difference in the subjective stress questionnaire: stress block (M = 3.92; SD = 0.64); no-stress block (M = 2.62, SD = 0.87); W(12) = 12, z = 3.06, p <.01.
RQ2. Do stimuli of varying modalities (audio, visual and audio-visual) induce different electrodermal activity responses in VR?
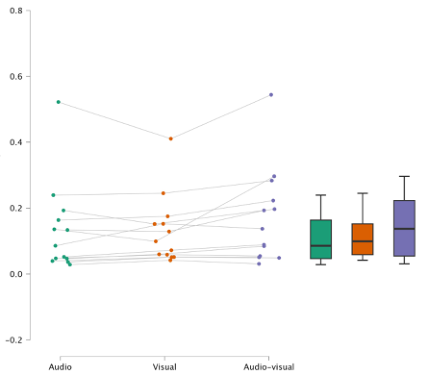
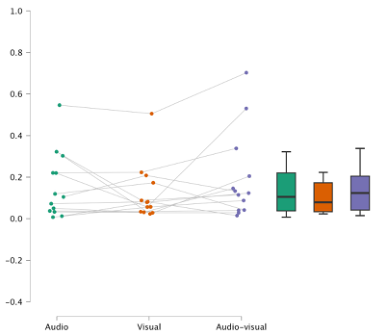
An RM ANOVA determined that the EDA Peak Amplitude varied signif- icantly across stressor modalities (F(2, 24) = 5.70, p < 0.01, ω2=0.02). The post hoc analysis showed that while there was not a significant difference between the audio (M = 0.133, SD = 0.135) and visual stressors (M = 0.131, SD = 0.104), the audio-visual stressors elicited a significantly higher EDA Peak Amplitude response (M = 0.172, SD = 0.144) (see Figure 4: Right).
The second RM ANOVA determined that the SCR Peak Amplitude did not vary significantly across stressor modalities (F(2, 24) = 1.74, p = 0.19, ω2 = 0.01). The post hoc analysis showed similar trends to the ones of the EDA peak analysis. Specifically, while there was no noticeable difference between the audio (M = 0.158, SD = 0.139) and visual (M = 0.122, SD = 0.134) stres- sors, the audio-visual stressors elicited a slightly higher SCR Peak Amplitude response (M = 0.193, SD = 0.210) (see Figure 5: Right).
Figure 4: Left: difference in EDA Peak Amplitude between stimuli of the three modal- ities per participant. Each line represents a participant; right: difference in EDA Peak Amplitude between stimuli of the three modalities on a group level.
RQ3. Do stimuli of varying modalities (audio, visual and audio-visual) induce different electrodermal activity responses in VR between participants?
When running the EDA Peak Amplitude RM ANOVA with participant id as a covariate we determined that there was no significant effect of the interaction term (F(2, 22) = 1.637, p = 0.217, ω2= 0.003). Furthermore, the between-subject effect of participant id was not significant (F(1,11) = 2.96, p = 0.113) (see Figure 4: Left).
Similarly, the SCR Peak Amplitude RM ANOVA that included the par- ticipant id as a covariate showed an non-significant interaction term (F(2, 22) = 0.823, p = 0.217, ω2= 0.001). However, participant id displayed a significant between-subjects effect (F(1,11) = 5.72, p < 0.05) (see Figure 5: Left).
Figure 5: Left: Difference in SCR Peak Amplitude between stimuli of the three modal- ities per participant. Each line represents a participant; right: difference in SCR Peak Amplitude between stimuli of the three modalities on a group level.
Kitchen Horrors: Unravelling the Influence of Multimodal Stressors 17
DISCUSSION AND CONCLUSION We investigated the robustness of detecting individual differences in users’ stress reactions to stimuli from three modalities (audio, visual, and audio- visual) in a VR haunted kitchen game. Through a within-subjects design, we systematically exposed participants to varying stress and no-stress conditions within a VR setting and measured their EDA response.
Our findings indicate that using the clean EDA signal to distinguish between stress vs no stress conditions might not be successful even when participants indicate subjectively that they experienced such a difference. However, once we delve deeper into the features of the EDA signal (i.e., look- ing at EDA Peak Amplitude and SCR Peak Amplitude), we can distinguish between the effect of different stimuli modalities on the stress response in users in VR. What is more, we can also see that users experience the different modalities distinctively – thus further serving the point that future VR expe- riences should be adaptable to the individual state. Interestingly, our data shows that we can detect individual differences in stress response in the SCR Peak Amplitude feature. A possible explanation can be found in the work of Meer et al. (2016) who found a correlation between SCR and trait anxiety (i.e., a personality feature that is consistent and unique per person). In this light, the current research reiterates the finding that the SCR feature reflects an individual’s reaction to stress that is dictated by their personality and thus is inherently different from any other individual’s response. This is a particu- larly important finding regarding the usability of the SCR feature in feedback loops.
When interpreting the present findings, it is important to address a signif- icant limitation of our study, namely, the lack of grounding truth in the form of a subjective stress measure per each stimulus. Due to this limitation, we are restricted in relating the objective difference in participants’ SCR Peak Amplitude per modality to their subjective reflection on it. We should note, that this limitation was considered during the conception of the experimen- tal design. Ultimately, we decided against asking the participants how they experienced a stressor after the occurrence of each stimulus. This decision was made to not break the participant’s feelings of presence and immersion in the virtual game and ultimately diminish the effect of the stressors.
What is more, we experienced a notable technical challenge - loss of data. Four participants (out of 17) had to be excluded due to data logging issues, where their VR experience log files lacked any EDA values. Two primary explanations account for this data logging challenge: firstly, the inconsis- tency in contact between the EmotiBit sensor and the users’ skin and secondly, network issues.
Concerning the placement of the EmotiBit sensor on the index finger, occa- sional loss of contact with the user’s skin was observed, potentially impacting the reliability of EDA measurements and introducing a potential confound- ing factor. To address this limitation, we are developing three prototypes of a VIVE Focus 3 controller that incorporates the EmotiBit EDA sensor box on the handle of the controller. These prototypes are currently undergoing
testing, and the quality of the data derived from them is yet to be thoroughly investigated before their application in the described haunted kitchen context.
Furthermore, network issues might have posed a challenge in the data log- ging process (Elbamby et al., 2018). More specifically, the loss (or increased latency) of the local Wi-Fi connection could have resulted in the disruption of the data streaming Open Sound Control (OSC) communication protocol. This disruption, particularly when streaming data to Android devices like the HTC Vive Focus 3, might have led to the loss of real-time EDA data transmis- sion. Recognizing the challenges associated with network instability, we are currently looking into the incorporation of WebSockets which offer a more resilient alternative to conventional protocols like OSC, as they provide a continuous channel for data transmission, reducing the susceptibility to net- work fluctuations (Murley et al., 2021). By implementing WebSockets, we aim to fortify the stability of data transmission and logging in real-time and thus facilitate the use of real-time EDA responses in feedback loops.
Even with these limitations in mind, our current findings lay the ground- work for the next phase of our research, where we plan to integrate these insights into feedback loops within the VR haunted kitchen environment. By incorporating real-time physiological data, such as EDA features, into adaptive VR experiences, we aim to create personalized and engaging inter- actions that dynamically adjust based on users’ experiences. This iterative approach holds promise for the development of adaptive VR environments that respond in real time to users’ physiological states, fostering a more immersive and tailored experience.
In conclusion, this study not only contributes to the understanding of user experience in VR but also sets the stage for innovative applications in the design of adaptive virtual environments. As technology continues to evolve, the integration of physiological measures will undoubtedly shape the future of VR entertainment parks and related industries.
ACKNOWLEDGMENT
The work of Aleksandra Zheleva is supported by the Research Foundation— Flanders (FWO) (11G6522N).
REFERENCES
Boucsein, W. (2012). Electrodermal activity (2nd ed.). Springer Science + Business Media. https://doi.org/10.1007/978-1-4614-1126-0 Dinh, H., Walker, N., Hodges, L., Song, C., & Kobayashi, A. (1999). Evaluating the
importance of multi-sensory input on memory and the sense of presence in virtual environments. Paper presented at the Virtual Reality; 1999. Proceedings., IEEE. Elbamby, M. S., Perfecto, C., Bennis, M., & Doppler, K. (2018). Toward Low- Latency and Ultra-Reliable Virtual Reality. IEEE Network, 32(2), 78–84. https: //doi.org/10.1109/MNET.2018.1700268 EmotiBit (2024). Available at: https://shop.openbci.com/products/emotibit (Accessed 20 January 2024).
Kitchen Horrors: Unravelling the Influence of Multimodal Stressors 19
Feng, M., Dey, A., & Lindeman, R. (2016). An initial exploration of a multi-sensory design space: Tactile support for walking in immersive virtual environments. Paper presented at the 2016 IEEE Symposium on 3D User Interfaces (3DUI). HTC Corporation. (2021). HTC Vive Focus 3 Virtual Reality Headset. Taiwan: HTC
Corporation. JASP Team (2024). JASP (Version 0.18.3) [Computer software]. Johnson, R. A., & Wichern, D. W. (2007). Applied Multivariate Statistical Analysis (6th ed.). Pearson Prentice Hall. Kivikangas, J. M., Chanel, G., Cowley, B., Ekman, I., Salminen, M., Järvelä, S., &
Ravaja, N. (2011). A review of the use of psychophysiological methods in game research. Journal of Gaming & Virtual Worlds, 3(3), 181–199. Lang, P. J. (1980). Behavioral treatment and bio-behavioral assessment: Computer applications. In J. B. Sidowski, J. H. Johnson, & T. A. Williams (Eds.), Technology in mental health care delivery systems (pp. 119–137). Ablex. Lazarus, R. S. (1993). From psychological stress to the emotions: A history of chang-
ing outlooks. Annual Review of Psychology, 44, 1–21. https://doi.org/10.1146/an nurev.ps.44.020193.000245 Mackowski, D., Pham, T., Lau, Z. J., Brammer, J. C., Lespinasse, F., Pham, H., Scholze, C., & Chen, S. A (2021). NeuroKit2: A Python toolbox for neuro- physiological signal processing. behavior research. methoDS, 53(4) 1689–1696. https://doi.org/10.3758/s13428-020-01516-y Meer, Y., Breznitz, Z., & Katzir, T. (2016). Calibration of Self-Reports of Anxiety and
Physiological Measures of Anxiety While Reading in Adults With and Without Reading Disability. Dyslexia, 22(3), 267–284. https://doi.org/10.1002/dys.1532 Melo, M., Gonçalves, G., Monteiro, P., Coelho, H., Vasconcelos-Raposo, J., & Bessa, M. (2022). “Do Multisensory Stimuli Benefit the Virtual Reality Experience? A Systematic Review.” IEEE Transactions on Visualization and Computer Graphics, 28(2), https://doi.org/10.1109/TVCG.2020.3010088. Montgomery, S. M., Nair, N., Chen, P., & Dikker, S. (2023). Introducing EmotiBit,
an open-source multi-modal sensor for measuring research-grade physiological signals. Science Talks, 6, 100181. https://doi.org/10.1016/j.sctalk.2023.100181 Murley, P., Ma, Z., Mason, J., Bailey, M., & Kharraz, A. (2021). WebSocket Adoption and the Landscape of the Real-Time Web. Proceedings of the Web Conference 2021, 12(21), 1192–1203. https://doi.org/10.1145/3442381.3450063 Picard, R. W., Vyzas, E., & Healey, J. (2001). Toward machine emotional intelligence:
Analysis of affective physiological state. IEEE Transactions on Pattern Analysis and Machine Intelligence, 23(10), 1175–1191. Slater, M. (2003). A note on presence terminology. Retrieved from https://api.sema nticscholar.org/CorpusID:60395352. Slater, M., & Sanchez-Vives, M. V. (2016). Enhancing our lives with immersive
virtual reality. Frontiers in Robotics and AI, 3, 74. Slater, M., & Wilbur, S. (1997). A framework for immersive virtual environments (FIVE): Speculations on the role of presence in virtual environments. Presence: Teleoperators and Virtual Environments, 6(6), 603–616. The Park Playground (2022). The Park Playground, Retrieved from https://www.th
eparkplayground.com/en-be. Accessed January 24, 2024. Van Rossum, G. & Drake, F. L., 2009. Python 3 Reference Manual, Scotts Valley, CA: CreateSpace.
LISTED IN THE AHFE DIGITAL BOOKSTORE CATALOGUE
Explore the complete digital volume
Human Factors in Virtual Environments and Game Design
Read this individual research paper free through the original publisher, or explore the full digital proceedings book.
ISBN 978-1-964867-13-7
Explore this ISBN in the AHFE Bookstore ↗Listed in the July 2026 bookstore catalogue; search by ISBN to confirm current availability · Digital book purchase optional