Caroline Schon, Kevin König, Johannes Tümler (2024). Random Dot Kinematogram used in Virtual Reality: A preliminary experiment. In: Human Factors in Virtual Environments and Game Design. AHFE Open Access, vol. 137, pp. 80–87. https://doi.org/10.54941/ahfe1004989
For professional use of virtual reality (VR), it is important to understand, how decisions made in VR differ from decisions made in reality. For example, if decision makers of automaker corporations experience virtual vehicle prototypes in VR, would they make the same decisions on product features in VR as they would in reality? Or, if students use VR to learn and carry out exams, would they decide for the same actions and exam answers as in reality? Two-choice tasks in a physical environment using the random dot kinematogram have already been realised. In our study, we therefore aimed at replication of this experiment in virtual reality. Challenges arose in the selection of the VR devices. Hence, here we report on the pre-experiment to identify a suitable VR setup.The biggest problem with this experiment was that lines were seen instead of dots. For this reason, different headsets with different refresh rates were tested to avoid this.The test subjects were students and tested the settings in randomized order and then indicated what they had seen in randomized answers. The data was collected in the form of an online questionnaire. A total of 17 people took part in the test. There is no clearly satisfactory result. However, most of the “very good” and “good” results were achieved with 80 Hz of the Valve Index.
Tools like Virtual, Mixed and Augmented Reality (VR, AR, MR, here sub- sumed as “xR”) have become valuable for industry (Firu et al., 2021). For example, xR serves as a medium to present and discuss parameters of vir- tual product prototypes in early development phases. This can save money, because less physical prototypes need to be built. In such applications, deci- sion makers and product specialists rely on correctness of the presented xR experience in order to make valid decisions. One commonly discussed problem of today’s xR systems is the vergence-accomodation-conflict (VAC, Batmaz et al., 2022). It describes a problem caused by the technical lay- out of today’s xR displays: The depth cue “accommodation” (focus) is not addressed correctly. Due to that, users can be misled in their own depth per- ception, which can have an effect on their decisions and actions. Other xR system properties such as latency, ghosting or display resolution effect the experience as well.
During implementation of a planned experiment that would display mov- ing dots on the VR headset, pre-users reported to see “lines” instead of
Random Dot Kinematogram Used in Virtual Reality: A Preliminary Experiment 81
individual dots, known as ghosting. The effect is caused by slow updates of the VR display (“low persistence displays”). This made users perceive arti- facts of the old information, which, from user’s point of view, appeared to be a line instead of a point. A screenshot of the display output showed no dotted lines, suggesting that it was not a software issue.
Here in this paper, we want to find out which VR headset can be used in experiments to investigate on binary decisions regarding information processing in visual perception.
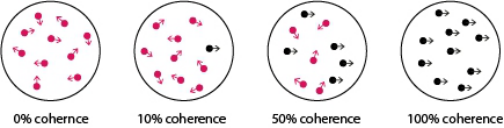
Theoretical Foundation The Random Dot Kinematogram (RDK) is an established tool to act as a visual stimulus for the in-depth investigation of motion perception (Ratcliff & McKoon, 2008). This visual stimulus consists of an arrange- ment of randomly placed dots on a screen, which can be set in motion in different ways. The aim of this experiment is to investigate the binary per- ception of movement. Test subjects are asked to differentiate between right and left movements of displayed dots. During the experiment, the number of dots that move coherently in a certain direction varies. The dots that move in a predefined direction are in contrast to the so-called noise. The latter represent points that move in a random manner and therefore do not belong to the directional movement. Figure 1 shows some examples for better understanding.
Figure 1: Visualisation random dot kinematogram.
In addition to numerous applications in the animal world, RDK was also used in studies with humans. In particular, the brightness (Cavanagh et al., 1985) and the effect of other factors such as field size and contrast. For exam- ple, RDK helped to find that some children with autism have more difficulty processing visual stimuli (Milne et al., 2002). It was found that the RDK causes anticipatory jerk-free eye movements and thus proves that no unin- terrupted movement is necessary to cause such eye movements (Santos et al., 2012) and a neurophysiological analysis of the decision-making process in RDK is possible using electroencephalography (Ettefagh et al., 2022).
The main goal is to check whether decisions in VR and AR can be made in a comparable way to reality. To do this, however, the appropriate headset must be found in order to exclude the technology as a confounding variable, which is why a preliminary study was designed, which is presented in this paper. We want to find out which VR headset can be used in a study with an RDK in VR with as low as possible influence on the result. There are different types of VR headsets. These include PC-controlled or standalone headsets. Three different
headsets from different manufacturers were included, because these represent typical devices on the current market. The HP Reverb G2, the Valve Index and the HTC Vive Pro were used in this paper. The HP Reverb G2 VR headset has a very high screen resolution with 2160 × 2160 pixels per eye on the LCDs. The field of view is 107.52
diagonally (Musil, 2023). The maximum refresh rate is 90 Hz. The HP Reverb G2 utilises inside-out tracking with four built-in cameras and has a limited, adjustable interpupillar distance of 60–68 mm (HP). The HTC Vive Pro is equipped with two AMOLED displays, each with a resolution of 1440 × 1600 pixels. In contrast to the HP Reverb G2, the HTC Vive Pro uses external base stations for tracking (HTC). There is no manufacturer information on the range of the interpupillary distance switch. However, a range of 60.7–73.5 mm has been specified in the manufacturer’s forums (HackPerception). The field of view of the HTC Vive Pro is 110.48
diagonally (Musil, 2023). The VALVE Index has two LCDs with the same resolution as the Vive Pro of 1440 × 1600 pixels per eye. Another similarity with the HTC Vive Pro is the use of base stations for tracking. The field of view of the Valve Index is the largest with a diagonal of 114.43
. The FOVs mentioned here only refer to the part of a scene that the screens can physically display (rendered FOV). What a person ultimately sees depends, on the distance to the screen and was not taken into account (Musil, 2023). The range of the interpupillary distance is 58–70 mm. In contrast to the other two alternatives mentioned, the Valve Index has a maximum refresh rate of 144 Hz (Valve). For an overview, the specifications are listed in Table 1.
Table 1. Technical information on the individual VR headsets.
Table available in the original PDF paper.
Characteristic HP Reverb G2 HTC Vive Pro Valve Index 2160 × 2160 1440 × 1600 1440 × 1600 Screen resolution (pixels per eye)
60–68 60, 7 - 73, 5 58-70
Maximum refresh rate (Hz) 90 90 144 Screen technology LCD AMOLED LCD Range of the interpupillary distance control (mm) Field of view (diagonal, in
) 107.52 110.48 114.43
One hypothesis is that the intensity of ghosting is lower in configurations with lower refresh rates, as a lower number of frames per second generates a lower number of artifacts. To confirm this, setups of different configurations of VR headsets and refresh rates were tested.
METHODS
In this study, 17 students of Anhalt University took part voluntarily and with- out compensation. The participants were a heterogeneous group in terms of gender, nationality, and engineering degree programmes.
We implemented a within-subjects design experiment: Each test subject tested all configurations and then evaluated them. In total, 5 setups were
Random Dot Kinematogram Used in Virtual Reality: A Preliminary Experiment 83
configured, consisting of different headsets and settings. A detailed break- down can be seen in Table 2. These setups were chosen because each of the VR headsets used has a characteristic that can influence the perception of the stimulus. Only the highest and lowest refresh rates of the respective VR headset were selected. This was done in order to be able to estimate the influ- ence of the refresh rate and at the same time to obtain a feasible scope. In this study, PC-VR headsets were used as there was no need for a lot of freedom of movement or standalone alternatives.
Table 2. Test settings with configuration of refresh rate and VR-headset.
Table available in the original PDF paper.
Configuration Refresh Rate VR-Headset 1 80 Hz Valve Index 2 144 Hz Valve Index 3 60 Hz HP Reverb G2 4 90 Hz HP Reverb G2 5 90 Hz HTC Vive Pro
In addition to the headsets, the following equipment is used for the exper- iment. Three computers were loaded with the RDK to carry out the test. A computer is used for the Valve Index and HTC Vive and has the follow- ing components installed: An NVIDIA GeForce RTX 2080 graphics card together with an Intel Core i7-8700 processor and 64 GB DDR4 RAM. The other two were used for one configuration each of the HP Reverb G2. They used an NVIDIA GeForce RTX 3070 graphics card with an Intel Core i7-10700 processor and 32 GB DDR4 RAM. This was necessary for organisational reasons.
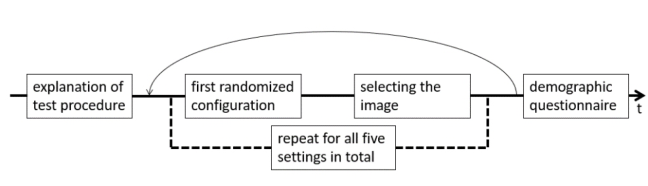
This study aimed to find out, which headset should be used for a later study of RDK in VR. Therefore, in this study, participants were shown an RDK in the VR headset. To be able to compare the headsets, they were asked to memorize what they had seen. After taking off the VR headset, they were shown four different images on a standard 4k-PC monitor of what they could probably have seen. Then, the participants were asked which of these images represented their experience best. Figure 2 depicts a scheme of the study pro- cedure. The presented order of images was randomized. The answers were collected using an online questionnaire done with LimeSurvey.
Figure 2: Study procedure.
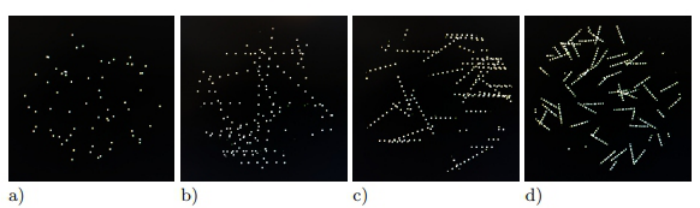
The four response options are photographs of the VR application dis- played on a conventional screen and taken with a smartphone camera. The speed of the dots themselves and the speed at which the dots are generated were increased or reduced to simulate the desired ghosting effect for those photographs. The four settings are points at standstill, points at half speed, points at full speed and points at double speed of the RDK actually shown. The speed of the dot generation was adapted to the speed of the dots so that the dot density remains largely identical. In order to be able to show the dif- ferences well in pictures, photos were used which were subsequently edited a little in order to be able to see the differences as good as possible. The contrast was increased, and the brightness reduced until the background took on an even black tone. Finally, all images were cropped to the 1:1 image format and scaled to a uniform size of 1024 × 1024 pixels (Figure 3). On the monitor, the images appeared approximately in the same size as in VR.
Figure 3: Possible answers to what the test persons saw: complete standstill (a), double speed (b), normal speed (c) and half speed (d).
First, the test subject is given an explanation of the survey procedure. The implemented test system picked a randomized order of configurations (headset, display frequency). Each participant had to run through all config- urations in a randomized order. The VR headset, together with the correct configuration, is then put on the test person. The test subject can start the experiment independently by pressing a button and only has the task of observing the stimulus. The person can independently determine the dura- tion of the experiment and leave the VR scene whenever they want. Finally, the test person quits the VR experience and selects the image in the question- naire, that most closely corresponds to what they saw. This is repeated until all five configurations have been tested.
RESULTS
The headset images were assigned different ratings for the evaluation. These go from best to worst from left to right in Figure 3. Image 3a is the ideal case, as the dots are clearly recognisable as individual ones. In image 3b, strong ghosting can be recognized, but the individual dots are still visible. In images 3c and 3d, the dots are difficult or even impossible to recognise as such and blur into a line.
Random Dot Kinematogram Used in Virtual Reality: A Preliminary Experiment 85
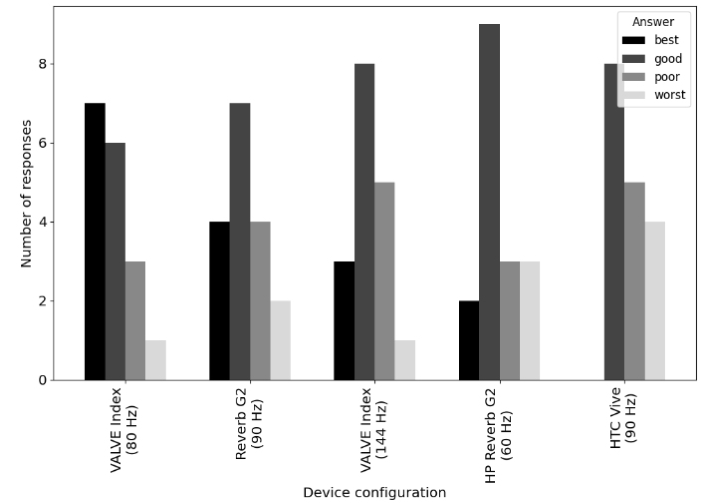
The test subjects in the experiment gave a total of 85 answers. Of these, each configuration received 17 responses. The VALVE Index received the best result at a refresh rate of 80 Hz, with seven good and six passable responses (Figure 4). Followed by HP Reverb G2 with 4 very good and 7 good answers. The VALVE Index with 144 Hz has 3 very good and 8 good answers and the HP Reverb G2 with 60 Hz has 2 very good and 9 good answers. HTC Vice has 8 good responses in the only tested setting.
Figure 4: Number of selected answers per headset.
In Table 3 we grouped the good and bad answers to decide for the “least bad” device. The VALVE Index received the best values. In addition, test persons criticised the quality of the HP Reverb G2 after use and described motion sickness.
Table 3. Test settings with configuration of refresh rate and VR-headset.
Table available in the original PDF paper.
Sorted by Refresh Rate Average
VR-Headset Refresh Rate
Poor + Worst
Poor + Worst
Very Good + Good
Very Good + Good Valve Index 80 Hz 13 4 12 5 144 Hz 11 6 HP Reverb G2 60 Hz 11 6 11 6 90 Hz 11 6 HTC Vive Pro 90 Hz 8 9 8 9
DISCUSSION
This investigation is a preliminary study to find a suitable headset for the project to be able to prepare a future study to depict an RDK in VR. In addi- tion to the options tested here, there are also variants between the chosen frequency specifications selected here.
According to the assumption made earlier, the HP Reverb G2 should have performed best at a refresh rate of 60 Hz because the intensity of ghosting is lower in configurations with lower refresh rates, as a lower number of frames per second generates a lower number of artefacts. The reason for this could be that the configuration is below the minimum refresh rate of 75 Hz, as this value is named by various sources to be a conservative minimum threshold (Heinecke, 2012).
Furthermore, six (35%) of the 17 test subjects actively noted that the con- figuration of 60 Hz had an unpleasant flickering effect. Both could have had an influence on the test subjects’ responses. Although the Valve Index achieved the best result at 80 Hz, the fact that less than 50 % of the answers were given for the good option is not satisfactory. Further consideration led to the assumption that one of the additional intermediate refresh rates of the Valve Index might be suitable. For this reason, we recommend a modified version of the experiment for similar studies: Only the Valve Index should be used together with refresh rates of 80 Hz, 90 Hz and 120 Hz. Based on the device specifications, the Valve Index should theoretically be the most suitable for the project, as the headset has a good range of the interpupillary distance control, and the largest field of view compared to the alternatives. Although the HP Reverb G2 has a higher resolution and therefore a clearer image, this advantage can be negated if the test subject perceives the image as blurred due to a distance between the eyes that cannot be adjusted.
For this reason, we decided that we might have to give the participants in the experiment the opportunity to choose the most comfortable frequency first and then do the experiment.
The findings on ghosting are that it depends on the frequency setting and the configuration of the glasses. Ghosting depends only slightly on the view- ing position (Silva et al., 2014). For this reason, the test subjects should no longer be allowed to move freely around the room in future experiments. “Instrumentation for characterizing motion artifacts is limited in its ability to associate its results with the way humans see motion artifacts” (Miseli, 2004, p. 4). As it was perceived differently by everyone, queries will also be made before future experiments in order to find the best individual setting for the test person.
Our next steps involve carrying out the planned experiment focusing on the visual perception of humans in VR. For this purpose, the Valve Index should be used and the refresh rate must be determined for each test subject. After that, we plan to carry out a similar experiment for AR glasses.
Looking forward, it is to be seen how future xR display technology devel- ops. For now, there is no clear-cut solution for the ghosting issue of current generation VR displays as discussed in this paper. Nevertheless, the Valve Index seems to be a suitable compromise.
Random Dot Kinematogram Used in Virtual Reality: A Preliminary Experiment 87
REFERENCES
Batmaz, A. U., Barrera Machuca, M. D., Sun, J. and Stuerzlinger, W. (2022). The effect of the vergence-accommodation conflict on virtual hand pointing in immer- sive displays. In Proceedings of the 2022 CHI Conference on Human Factors in Computing Systems pp. 1–15, doi: 10.1145/3491102.3502067. Cavanagh, P., John Boeglin, J. and Favreau, O. E. (1985). Perception of Motion in Equiluminous Kinematograms, Perception, 14(2), 151–162, doi: 10.1068/p140151. Ettefagh, A., Ghassemi, F. and Tabanfar, Z. (2022). Timefrequency Analysis of
Electroencephalogram Signals in a Perceptual Decision-Making Task of Random Dot Kinematograms. Frontiers in Biomedical Technologies, 9(3), 170–175, doi: 10.18502/fbt.v9i3.9642. Firu, A. C., Tapîrdea, A., Feier, A. and Dr˘aghici, G. (2021). Virtual reality in the automotive field in industry 4.0. Materials Today: Proceedings, 45, 4177–4182, doi: 10.1016/j.matpr.2020.12.037. HackPerception, https://forum.htc.com/topic/4764-ipd - below - 60 / # : ∼: text =
The % 20IP % 20range % 20of % 20the, out % 20 % 2D % 20it ‘ s % 20a % 20physical % 20limit. Heinecke, A. M. (2012). Mensch-Computer-Interaktion: Basiswissen für Entwickler und Gestalter. Springer Berlin Heidelberg, doi: 10.1007/978-3-642-13507-1. HTC VIVE Pro Specs and User Guide, https://developer.vive.com/resources/hardwar
e-guides/vive-pro-specs-userguide/. HP Reverb G2 Virtual Reality Headset Specifications, https://support.hp.com/us-en /document/c06938191. Milne, E, Swettenham, J., Hansen, P., Campell, R., Jeffries, H. and Plaisted, K. (2002).
High motion coherence thresholds in children with autism. Journal of Child Psychology and Psychiatry, 43(2), 255–263, doi: 10.1111/1469-7610.00018. Miseli, J. (2004). 7.3: Motion artifacts. Digest of Technical Papers. SID International Symposium, 35(1), 86–89, doi: 10.1889/1.1811463. Musil, R. (2023), HMD Geometry Database, https://risa2000.github.io/hmdgdb/. Ratcliff, R. and McKoon, G. (2008). The Diffusion Decision Model: Theory and
Data for Two-Choice Decision Tasks. Neural Computation, 20 (4), 873–922, doi: 10.1162/neco.2008.12–06-420. Santos, E. M, Gnang, E. K. and Kowler, E. (2012). Anticipatory smooth eye movements with random-dot kinematograms. Journal of Vision 12(11), S. 1–1, doi: 10.1167/12.11.1. Silva, V. N. H., Stoenescu, D., Nassour, T. C., de la Riviere, J.-B., and de
Bougrenet de la Tocnaye, J.-L. (2014). Ghosting impingements in 3D dual- view projection systems. Journal of display technology, 10(7), 540–547, doi: 10.1109/JDT.2014.2306960. Valve. Headset – Valve Index – Upgrade your experience, https:/ /www.valvesoftware.com/en/index/headset.
LISTED IN THE AHFE DIGITAL BOOKSTORE CATALOGUE
Explore the complete digital volume
Human Factors in Virtual Environments and Game Design
Read this individual research paper free through the original publisher, or explore the full digital proceedings book.
ISBN 978-1-964867-13-7
Explore this ISBN in the AHFE Bookstore ↗Listed in the July 2026 bookstore catalogue; search by ISBN to confirm current availability · Digital book purchase optional