Mervyn Franssen, Rutger Verstegen, Pavlo Bazilinskyy, Marieke Martens (2024). Exploring the Correlation between Emotions and Uncertainty in Daily Travel. In: Advances in Human Factors of Transportation. AHFE Open Access, vol. 148, pp. 527–536. https://doi.org/10.54941/ahfe1005244
Our mental state influences how we behave in and interact with the everyday world. Both uncertainty and emotions can alter our mental state and, thus, our behaviour. Although the relationship between uncertainty and emotions has been studied, research into this relationship in the context of daily travel is lacking. Emotions may influence uncertainty, just like uncertainty could trigger emotional responses. In this paper, a study is presented that explores the relationship between uncertainty and emotional states in the context of daily travel. Using a diary study method with 25 participants, emotions and uncertainty that are experienced during daily travel while using multiple modes of transport, were tracked for a period of 14 days. Diary studies allowed us to gain detailed insights and reflections on the emotions and uncertainty that participants experienced during their day-to-day travels. The diary allowed the participants to record their time-sensitive experiences in their relevant context over a longer period. These daily logs were made by the participants in the m-Path application. Participants logged their daily transportation modes, their emotions using the Geneva Emotion Wheel, and the uncertainty that they experienced while travelling. Results show that emotions and uncertainty influence each other simultaneously, with no clear causality. Specifically, this study observed a significant correlation between negative valence emotions (disappointment and fear) and uncertainty, which emphasises the importance of uncertainty and the management of negative valence emotions in travel experiences.
Emotions influence how we behave in and plan for the everyday world (Scherer, 2005). Just like emotions, another influence on our behaviour is uncertainty (Kappes et al., 2018; Windschitl and Wells, 1996). Our behaviour plays a key role in road safety (Sagberg et al., 2015; Shinar, 2017; Wegman, 2017). The correlation between uncertainty and emotions in traffic, however, is still to be explored. This potential correlation can lead to new insights into how we view uncertainty in its relationship with our emotions in traffic.
Uncertainty Uncertainty has been researched as a psychological construct (Kappes et al., 2018; Rowe, 1994; Windschitl and Wells, 1996). Researching this psychological uncertainty itself can be done by asking participants how they perceive their own uncertainty. In this case, the research looks at uncertainty as something of which the participant has their own understanding of, and the values can thus not be compared between participants. It could, however, still be beneficial to research the correlation between uncertainty and emo- tions within individuals to further understand both constructs and to offer more possibilities for the measurement of uncertainty through correlating concepts.
Emotions Measurement of human emotions can be done by analysing bodily features or through self-reporting. Analysis of the body for deriving emotional state can be done, for instance, via heart rate variability (Quintana et al., 2012) and video analysis of facial features (Mower, Matari´c, and Narayanan, 2010). For self-reporting emotions, a metareview by Fuentes et al., (2016) anal- ysed 40 papers discussing relevant research technologies and designs. Another method to measure emotions is the ‘Geneva Emotion Wheel’ (GEW) (Scherer, 2005; Scherer, Fontaine, Sacharin and Soriano, 2013), which is a theoretically derived and empirically tested instrument that aids the process of measur- ing emotional reactions during events. When implementing the GEW the participants are asked to indicate the emotion(s) that they experience. The participants can choose from 20 distinct emotions, that are arranged between positive and negative valence, as well as high control and low control (Scherer, 2005; Scherer, Fontaine, Sacharin and Soriano, 2013). For each emotion, participants can select the intensity of the emotion.
Relation Between Uncertainty and Emotions Existing literature shows a predominant association between uncertainty and negative emotional states (Anderson et al., 2019; Morriss et al., 2022). Additionally, uncertainty is shown to increase affective reactions (Bar-Anan, Wilson and Gilbert, 2009). However, in the context of daily travel, no such work exists. In this context, the relationship and causality between emotions and uncertainty are yet to be explored. Uncertainty can trigger emotional responses (Morriss et al., 2022) and, as mentioned by Anderson et al. (2019), whether emotion can influence uncertainty is an area that deserves further research. Our research specifically looks at experienced uncertainty during day-to-day travel, with no prior exploratory studies within this field. The goal is to explore the correlations between uncertainty and emotions in travel. An approach to exploring these emotions is using a diary study approach, which can be beneficial in finding the emotions that people experience (Janssens et al., 2018). The usage of a diary for this purpose in the context of daily travel is an existing method supported by previous research (Gulian et al., 1990).
Exploring the Correlation Between Emotions and Uncertainty in Daily Travel 529
Diary Study Diary studies are a method in which participants keep a log of their activi- ties, experiences and thoughts (Janssens et al., 2018). A diary study can span from a few weeks to months, depending on the context and scenario in which measurements are being made. A diary study approach could offer the ability for participants to log their daily emotions and uncertainty that they expe- rienced while traveling. These participants can log their daily travel, in a diary or an application like m-Path (Mestdagh et al., 2023), and give con- textual insights about real-time user experiences and contribute towards the understanding of the emotions and uncertainty that they experience. These quantitative insights of qualitative data can contribute towards finding the link between experienced emotions and uncertainty.
METHODOLOGY
In this study, we look at the influence that emotions have on uncertainty and the influence that uncertainty has on emotions. These effects are mea- sured using a diary study method on the daily emotional experiences and the role that they play on the uncertainty of participants in their travels, whilst also measuring the role that uncertainty plays on the emotional state of participants.
Participants In total, 34 potential participants were recruited via a study invitation based on convenience sampling (Golzar, Noor and Tajik, 2022). From this sample, 25 participants completed all steps in the study (M = 8, F = 17) and ages ranged from 19 to 34 (M = 25.3, SD = 3.3). All participants selected the Netherlands as their country of residence. 20 participants reported having a driver’s license, and 5 reported not having one. The primary mode of trans- portation was chosen as bike/moped (13), followed by car/motorcycle (4), train (4) and walking (4). Estimated daily travel time ranged from 0.5 hours to 2 hours (M = 1.04, SD = 0.54).
Procedure All participants signed an informed consent prior to their participation. The study was executed fully digitally, not requiring participants to come to a physical location. This study started with the installation of the m-Path application (Mestdagh et al., 2023) on participants’ devices. This applica- tion allowed for sending participants notifications reminding them to fill out the questionnaires and subsequently offered a platform to show question- naires directly on their mobile phones. All participants received a guide with instructions on questionnaire reporting, to provide consistency.
During the first day, participants filled out a demographic questionnaire. Next to basic demographics, we also measured how often participants con- sidered they experienced emotions from the GEW and uncertainty during their day-to-day lives. The ‘none’ option of the GEW was created as a separate option that participants could select.
For the following 14 days, participants were instructed to complete a questionnaire after each time they completed a travel. The participants were instructed that it was preferred to report directly after travelling, but in case this was not possible, reporting later on the same day was allowed. For the purpose of this research, travelling was defined as “moving between two different places for at least 5 minutes of movement”. Participants reported their travel goal, mode of transport, duration, level of uncertainty, and level of emotions from the GEW. Levels of the emotions and uncertainty were recorded on a 7-point Likert scale (Jebb, Ng and Tay, 2021). Numerical values were not shown on the Likert scale to aim to avoid skewing uncer- tainty data with an approach focussed on numbers (Windschitl and Wells, 1996). For each experienced emotion, participants could select if their (lack of) uncertainty did (not) influence the emotion, and if the emotion did (not) influence their lack of uncertainty. Participants were instructed to report all emotions and uncertainty they experienced during their travel. At the end of each travel entry, participants had the opportunity to add remarks. Each day, participants received questionnaire reminders at 9:30, 12:30, and 17:30 in the form of a questionnaire notification. Upon opening the m-Path application, participants could create a new travel entry at any time, to not limit them from their regular travel schedule and keep flexibility in reporting opportunities.
After recording their daily travel experiences for 14 days, participants were asked to complete a questionnaire regarding their influence of uncertainty on emotions, and their influence of emotions on uncertainty during the study period. As a token of appreciation, participants who completed the study received a 10-euro gift voucher for their participation. This study procedure was approved by the Ethical Review Board of the Eindhoven University of Technology.
Data Analysis All data for this study was analysed using SPSS Statistics. A two-tailed Spearman test (Myers and Sirois, 2006) was applied for insights into cor- relations due to the ordinal nature of the Likert scale data that was used to collect ratings for the selected emotions and uncertainty. Correlations were deemed significant once p<0.05 with Bonferroni correction applied (Napierala, 2012). The strength of significant correlation coefficients was interpreted using practice from the field of psychology (Akoglu, 2018).
RESULTS
During the research the correlation between uncertainty and emotions while travelling is measured in three phases. It is measured during the ‘staring ques- tionnaire’ in which participants are asked to review how often they think they experience emotions and uncertainty in their day-to-day lives. The second phase exists out of the ‘daily travel reports’ in which participants reported on the emotions that they experienced during travel, as well as their experienced uncertainty. Here participants were also asked if they thought their uncer- tainty had an influence on each emotion and vice-versa. During the third
Exploring the Correlation Between Emotions and Uncertainty in Daily Travel 531
phase participants filled in the ‘end questionnaire’ where they were asked if they thought that their emotions influenced their uncertainty and vice-versa. All three phases are analysed separately to find correlations and are later reviewed to discuss the similarities and differences.
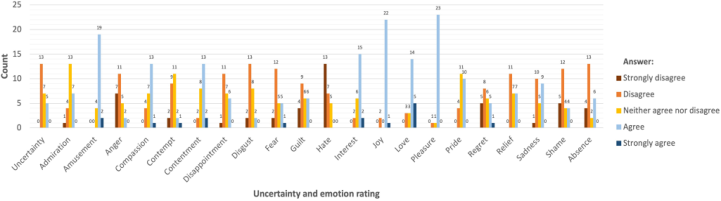
Starting Questionnaire Ratings on emotions and uncertainty are visualised in a bar graph (see Figure 1). The correlation between uncertainty and emotions is analysed from the ‘starting questionnaire’. The Spearman testing (Bonferroni corrected) found a strong and significant correlation between uncertainty and anger (r(23) = 0.70, p = 0.002). The other analysed correlations (P-value can be >1 due to Bonferroni Correction) emotions and uncertainty were: interest (r(23) = 0.34, p = 1.973), amusement (r(23) = −0.17, p = 8.839), pride (r(23) = −0.45, p = 0.498), joy (r(23) = −0.07, p = 15.734), pleasure (r(23) = 0.05, p = 16.767), contentment (r(23) = −0.12, p = 12.005), love (r(23) = 0.10, p = 13.116), admiration (r(23) = 0.23, p = 5.809), relief (r(23) = 0.08, p = 14.682), compassion (r(23) = 0.28, p = 3.621), sadness (r(23) = 0.32, p = 2.502), guilt (r(23) = 0.28, p = 3.584), regret (r(23) = 0.12, p = 12.088), shame (r(23) = 0.22, p = 6.310), disappoint- ment (r(23) = 0.30, p = 3.170), fear (r(23) = −0.05, p = 17.438), disgust (r(23) = −0.02, p = 19.600), contempt (r(23) = 0.22, p = 6.058), hate (r(23) = 0.51, p = 0.190), and ‘an absence of emotions’ (r(23) = 0.13, p = 11.089).
Figure 1: Participant reports about uncertainty and emotions. Question used: “I often experience [emotion inserted] in my day-to-day life”.
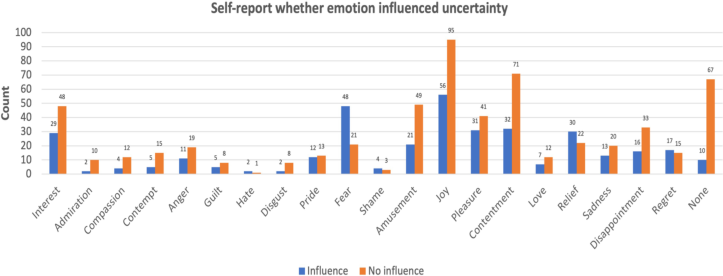
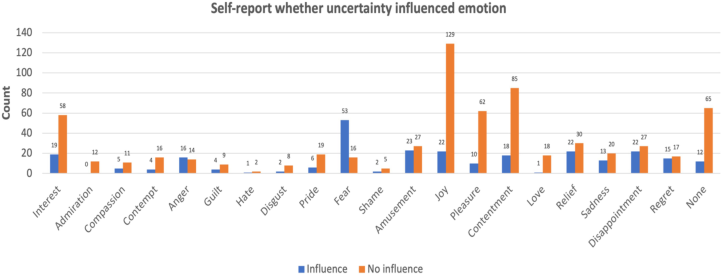
Daily Travel Reports For the duration of two weeks, participants indicated what emotions they experienced and how much uncertainty they felt during their travels. For each emotion selected, participants were asked to rate the level of the emotion and were also asked if they thought the emotion had an influence on their uncertainty and their uncertainty on the emotions. Data on the experienced emotions and their relationship with uncertainty, are visualised in Figure 2 and Figure 3.
The Spearman test was used to find the correlation coefficient for the selected level of individual emotions and the reported level of uncertainty. Testing shows a moderate and significant correlation between uncertainty
and disappointment (r(47) = 0.60, p <0.001). Next to that, uncertainty and fear (r(67) = 0.71, p <0.001) are strongly correlated. The other non- significant analysed correlations between emotions and uncertainty were: interest (r(75) = 0.30, p =0.154), amusement (r(68) = 0.08, p = 10.028), joy (r(149) = −0.08, p = 6.414), pleasure (r(70) =0.04, p = 14.614), con- tentment (r(101) = 0.26, p = 0.0183), love (r(17) = −0.11, p = 13.338), relief (r(50) = −0.07, p = 12.870), sadness (r(31) = 0.44, p = 0.230), regret (r(30) = 0.15, p = 8.516), disgust (r(8) = 0.24, p = 10.069), pride (r(23) = 0.41, p = 0.829), shame (r(5) = 0.72, p = 1.423), admiration (r(10) = 0.29, p = 7.112), compassion (r(14) = −0.05, p = 17.274), con- tempt (r(18) = 0.19, p = 8.354), anger (r(28) = 0.50, p = 0.101), guilt (r(11) = 0.25, p = 8.335), and hate (r(1) = 1.00, p = could not computed by SPSS).
Figure 2: Reported count of where emotion influenced uncertainty.Figure 3: Reported count of where uncertainty influenced emotion.
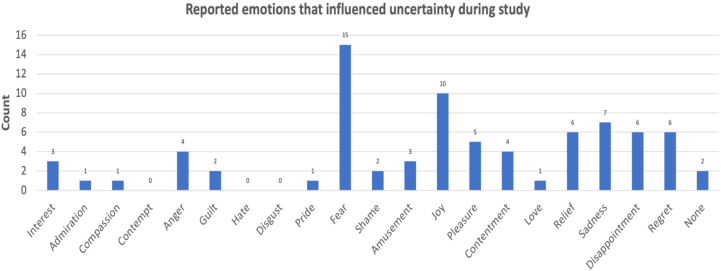
Ending Questionnaire In the ending questionnaire, participants reported that during the study, their emotions influenced their uncertainty on average with 3.28 (on a 7-point Lik- ert scale, with 1 being very little and 7 being very much SD = 3.28). In total, participants selected 79 emotions to have influenced their uncertainty. The
Exploring the Correlation Between Emotions and Uncertainty in Daily Travel 533
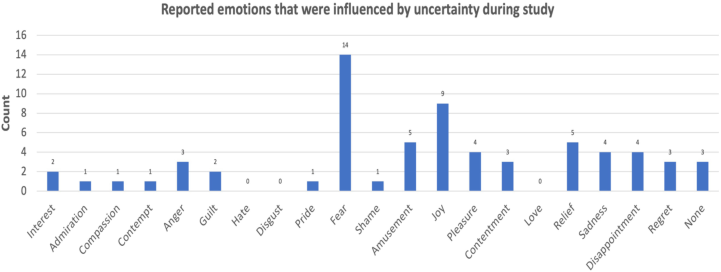
most frequently reported emotions that influence uncertainty were fear (15), joy (10), and sadness (7); see Figure 4 for details. On average, participants rated that uncertainty influenced emotions with a score of 3.48 (1-7 Likert scale, very little-very much, lowest answer = 1, highest = 7, SD = 3.48). The most picked emotions to influence uncertainty were fear (14), joy (9), relief (5) and amusement (5). In total, participants selected 66 emotions that they considered to be influenced by uncertainty during the study, see Figure 5.
Figure 4: Overview of self-report looking back at study: count of the selected emotions that influenced uncertainty.Figure 5: Overview of self-report looking back at study: count of the selected emotions that were influenced by uncertainty.
DISCUSSION
The executed study derived insights into the three phases the participants experienced during the study. Firstly, the emotions and uncertainty partici- pants considered they experienced in day-to-day life before participating in the study. Secondly, the relationship that was present during the study. Lastly, participants reflected upon the relationship after the study. In the following paragraphs, we will look further into the outcomes per phase.
Before Study: Starting Questionnaire The starting questionnaire found a significant relation between participants experiencing uncertainty and anger in the reported day-to-day experiences. Anger falls on the high control side of the GEW, and is slightly shifted towards negative valence (Scherer et al., 2013). Participants rated experiencing a rela- tively low amount of uncertainty in their day-to-day life. Emotions classified by the GEW closer to positive valence emotions (Scherer et al., 2013) received more frequent ratings, as can be seen in amusement, joy, and love. Negative valence emotions, on the other hand, received lower ratings.
During the Study: The Daily Travel Reports Daily travel reports gave insight into the fact that there was a significant and moderate correlation between uncertainty and disappointment. Next to that, there is a strong and significant correlation between uncertainty and fear.
Both of these emotions have a high negative valence on the GEW (Scherer et al., 2013). Participants self-reported that fear and uncertainty are strongly related and mutually influence one another.
After the Study: The Ending Questionnaire Outcomes from the ending questionnaire demonstrate that fear and uncer- tainty are strongly related and mutually influence one another. Participants did not report large differences with regard to whether emotions influence uncertainty and/or uncertainty-influenced emotions. Furthermore, the large standard deviations in these answers indicate low agreeance amongst the par- ticipants with regard to causality. Thus, data from the participants deemed emotions and uncertainty influence one another both ways without clear causality.
Findings The findings from this experiment agree with the results of earlier stud- ies (Anderson et al., 2019; Morriss et al., 2022), showing a relationship between negative valence emotions and uncertainty in non-traffic related contexts. This paper demonstrates that these findings apply to the field of daily travel experiences. Results regarding causality between emotions and uncertainty are non-conclusive, showing a large variance in answers between participants.
LIMITATIONS This study was performed using a limited sample (N = 25) of residents of the Netherlands during a two-week period. Despite all participants reported being residents of the Netherlands, some remarks in daily travel reports indicate travel abroad as well. Moreover, participants were relatively young (M = 25.3); therefore, as a follow-up study, we recommend a more lon- gitudinal study with a more diverse sample. Additionally, all emotions and uncertainty were self-reported. Participants could have experienced emotions on different levels with similar ratings, which is due to the subjective nature
Exploring the Correlation Between Emotions and Uncertainty in Daily Travel 535
of the dependent measurements. For future studies, it could be interesting to repeat the study, but also measure uncertainty and emotions objectively. The additional results could lead to new insights and understandings of how we perceive emotions and how they can influence uncertainty and vice-versa. Lastly, our research does not look at the timeline of when emotions and uncer- tainty were experienced during travel. Pinpointing which came first could lead to new insights. Therefore, follow-up research that builds a timeline of uncertainty and the appearance of emotions could lead to insights into what emotions are specifically triggered by uncertainty and vice-versa.
CONCLUSION
Our results show that emotions and uncertainty correlate to each other (or one another or mutually influential) simultaneously. Our findings show a high correlation between negative valence emotions and uncertainty. Similar findings have been made in the past using a different approach in a differ- ent context (Anderson et al., 2019; Morriss et al., 2022). Our findings also show that people perceive the influence that uncertainty has on their emo- tions, and emotions have on their uncertainty. These findings demonstrate the importance of uncertainty and related emotion management to create positive travel experiences.
ACKNOWLEDGMENT
We want to thank Shadab Alam for combining the datasets of the individ- ual participants. This research was supported by funding from the Dutch Research Council NWO-NWA (Grant No. NWA.1292.19.298).
REFERENCES
Akoglu, H., (2018). User’s guide to correlation coefficients. Turkish journal of emergency medicine, 18(3), pp. 91–93. doi: https://doi.org/10.1016%2Fj.tjem.2018.08.001. Anderson, E. C., Carleton, R. N., Diefenbach, M. and Han, P. K. (2019). ‘The relationship between uncertainty and affect’. Frontiers in psychology, 10, p. 2504. doi: https://doi.org/10.3389/fpsyg.2019.02504. Bar-Anan, Y., Wilson, T. D. and Gilbert, D. T., (2009). ‘The feeling of uncertainty
intensifies affective reactions’. Emotion, 9(1), p. 123. doi: https://doi.org/10.1037/ a0014607. Fuentes, C., Herskovic, V., Rodríguez, I., Gerea, C., Marques, M. and Rossel, P. O., (2017). ‘A systematic literature review about technologies for self-reporting emo- tional information’. Journal of Ambient Intelligence and Humanized Computing, 8, pp. 593–606. doi: https://doi.org/10.1007/s12652-016-0430-z. Golzar, J., Noor, S. and Tajik, O., (2022). ‘Convenience Sampling’. International
Journal of Education and Language Studies, 1(2), pp. 72–77. doi: https://doi.org/ 10.22034/ijels.2022.162981. Gulian, E., Glendon, A. I., Matthews, G., Davies, D. R. and Debney, L. M. (1990).
‘The stress of driving: A diary study’. Work & Stress, 4(1), pp. 7–16. doi: https: //doi.org/10.1080/02678379008256960. Janssens, K. A. M., Bos, E. H., Rosmalen, J. G. M., Wichers, M. C. and Riese, H.
(2018). ‘A qualitative approach to guide choices for designing a diary study’. BMC Medical Research Methodology, 18(1). doi: https://doi.org/10.1186/s12874-018- 0579-6.
Jebb, A. T., Ng, V. and Tay, L. (2021). ‘A Review of Key Likert Scale Development Advances: 1995–2019’. Frontiers in Psychology, 12(1), pp. 1–14. Available at: https://www.frontiersin.org/articles/10.3389/fpsyg.2021.637547/full. Kappes, A., Nussberger, A. M., Faber, N. S., Kahane, G., Savulescu, J. and Crockett,
M. J. (2018) ‘Uncertainty about the impact of social decisions increases prosocial behaviour’. Nature human behaviour, 2(8), pp. 573–580. doi: https://doi.org/10. 1038/s41562-018-0372-x. Mestdagh, M., Verdonck, S., Piot, M., Niemeijer, K., Kilani, G., Tuerlinckx, F., Kuppens, P. and Dejonckheere, E., (2023) ‘m-Path: an easy-to-use and highly tai- lorable platform for ecological momentary assessment and intervention in behav- ioral research and clinical practice’. Frontiers in digital health, 5, p. 1182175. doi: https://doi.org/10.3389/fdgth.2023.1182175. Morriss, J., Tupitsa, E., Dodd, H. F. and Hirsch, C. R., (2022) ‘Uncertainty makes me
emotional: Uncertainty as an elicitor and modulator of emotional states’. Frontiers in Psychology, 13, p. 777025 Mower, E., Matari´c, M. J. and Narayanan, S. (2011) ‘A framework for automatic human emotion classification using emotion profiles,’ IEEE Transactions on Audio, Speech, and Language Processing, 19(5), pp. 1057–1070. https://doi.or g/10.1109/tasl.2010.2076804 Myers, L. and Sirois, M. J. (2006) ‘Spearman Correlation Coefficients’, Differ-
ences between. Encyclopedia of Statistical Sciences. doi: https://doi.org/10.1002/ 0471667196.ess5050.pub2. Napierala, M. A., (2012) ‘What is the Bonferroni correction?’. Aaos Now, pp. 40–41.
https://link.gale.com/apps/doc/A288979427/HRCA?u=anon ∼3dec43e3&sid= googleScholar&xid=1b5ff6d3 (accessed 1 February 2024). Quintana, D. S., Guastella, A. J., Outhred, T., Hickie, I. B. and Kemp, A. H.
(2012) ‘Heart rate variability is associated with emotion recognition: Direct evidence for a relationship between the autonomic nervous system and social cognition’. International journal of psychophysiology, 86(2), pp. 168–172. doi: https://doi.org/10.1016/j.ijpsycho.2012.08.012. Rowe, W. D. (1994) ‘Understanding Uncertainty’. Risk Analysis, 14(5), pp. 743–750.
doi: https://doi.org/10.1111/j.1539-6924.1994.tb00284.x. Sagberg, F., Selpi, Bianchi Piccinini, G. F. and Engström, J. (2015) ‘A Review of Research on Driving Styles and Road Safety’. Human Factors: The Journal of the Human Factors and Ergonomics Society, 57(7), pp. 1248–1275. doi: https: //doi.org/10.1177/0018720815591313. Scherer, K. R. (2005) ‘What are emotions? And how can they be measured?,’
Social Science Information, 44(4), pp. 695–729. doi: https://doi.org/10.1177/ 0539018405058216. Scherer, K. R., Shuman, V., Fontaine, J. R. and Soriano, C., (2013) ‘The GRID meets the Wheel: Assessing emotional feeling via self-report’. Components of emotional meaning: A sourcebook, 53, pp. 1689–1699. doi: https://doi.org/10.1093/acprof: oso/9780199592746.003.0019. Shinar, D. (2017). Traffic safety and human behavior. Bingley, UK: Emerald Publish-
ing. Wegman, F. (2017) ‘The future of road safety: A worldwide perspective’. IATSS Research, 40(2), pp. 66–71. doi: https://doi.org/10.1016/j.iatssr.2016.05.003. Windschitl, P. D. and Wells, G. L. (1996). ‘Measuring psychological uncertainty: Ver-
bal versus numeric methods’. Journal of Experimental Psychology: Applied, 2(4), pp. 343–364. doi: https://doi.org/10.1037/1076-898x.2.4.343.
LISTED IN THE AHFE DIGITAL BOOKSTORE CATALOGUE
Explore the complete digital volume
Advances in Human Factors of Transportation
Read this individual research paper free through the original publisher, or explore the full digital proceedings book.
ISBN 978-1-964867-24-3
Explore this ISBN in the AHFE Bookstore ↗Listed in the July 2026 bookstore catalogue; search by ISBN to confirm current availability · Digital book purchase optional