Vinay Kumar Uppalapati, Bo Sun (2024). Automated Visualization for Visual Analytics: Trends, Challenges, and Opportunities. In: Human Interaction and Emerging Technologies (IHIET 2024). AHFE Open Access, vol. 157, pp. 435–449. https://doi.org/10.54941/ahfe1005503
Visualization, as a major approach of visual analytics, involves many human interaction techniques, especially in terms of how individuals communicate, comprehend, and interpret information. Creating visualizations is a tedious process and requires skill, but automatic data visualization technologies have made it easier to create visualizations. They completely changed the landscape of data analysis and decision-making processes. As the demand for effective and efficient visualization solutions grows across diverse sectors, researchers and practitioners have developed a plethora of autonomous systems aimed at transforming raw data into meaningful visual representations. This paper investigates the methodologies utilized by these systems, categorizing them based on machine learning approaches combined with various data inputs, template-based approach, and other technique/algorithm-based approach. We collected 31 top-tier journal papers in the field and shed light on the diverse techniques employed in generating visualizations automatically, enhancing our understanding of their capabilities, compatibility, and usability across various contexts. Our survey aims to provide insights into the strengths, limitations, and potential areas for future exploration in automatic data visualization, offering guidance to practitioners, researchers, and developers in selecting appropriate techniques for their specific needs and datasets. By systematically examining these systems and pinpointing areas for improvement, we contribute to the advancement and refinement of automatic data visualization methodologies, fostering progress in this dynamically evolving domain.
Data visualization is a critical tool in modern data analysis and decision- making processes. Data visualizations help humans understand abstract data. As the volume and complexity of data increases significantly across different sectors, such as business, healthcare, finance, and scientific research, so does the demand for effective and efficient data visualization solutions. Despite the number of visualization tools and libraries, users usually struggle to select the appropriate charts, appropriately encode data, and create visually appealing images. Users must understand the data and be proficient in using the available tools to do the activities listed above.
Creating visualizations manually requires a significant amount of effort and time. This problem can be overcome by automation; hence there is a high need for systems that can visualize data without user intervention. In response to this demand, researchers and practitioners have created a wide range of autonomous data visualization systems that turn raw data into meaningful visual representations. Automatic data visualization has progressed dramatically over time, reflecting technological developments and an increasing demand for accessible data insights. Initially, data visualization necessitated human labor, with analysts making charts and graphs using special tools. However, as computer power and machine learning techniques improved, automated data visualization tools arose. These programs automatically analyze datasets, discover patterns, and provide visual representations, saving users time and effort. From simple bar charts, as seen in (Dibia & Demiralp, 2019), (Luo et al., 2018) and (Harper & Agrawala, 2017) to complex interactive dashboards, as seen in (Deng et al., 2022), (Wu, Wang, Zhou, et al., 2021)automated data visualization solutions today offer a range of capabilities to cater to varying data analysis demands, helping users across various industries to make informed decisions based on data-driven insights.
Understanding automatic data visualization systems requires an examination of the methodologies they utilize to create visualizations. This survey classified existing automatic data visualization systems into three primary categories based on their methodology approaches: Systems adopted machine learning such as (Dibia & Demiralp, 2019) and (Luo et al., 2018) systems that are template-based such as the ones proposed by (Harper & Agrawala, 2017), and algorithmic or technique-driven systems as seen in (Li et al., 2021). Each approach offers distinct advantages and faces unique challenges, accommodating various data traits, user needs, and application contexts.
In this survey paper, we explore the field of automatic data visualization systems to offer a comprehensive overview of the techniques they utilize. We aim to categorize these systems according to their underlying methodologies, shedding light on the various approaches employed in generating data visualizations automatically.
What sets our survey paper apart is its emphasis on a novel classification scheme that categorizes automatic data visualization systems based on their underlying methodologies. This refined classification enhances our understanding of automatic data visualization methods’ capabilities, compatibility, and usability across various data sources and user interaction contexts. The objective of this survey paper is to categorize and analyze existing automatic data visualization systems based on their underlying methodologies. We also aim to pinpoint the areas the existing systems are lacking. By doing so, we provide insights into the strengths and limitations of different approaches, offering guidance for researchers, practitioners, and developers in selecting appropriate automatic data visualization techniques for their specific needs and datasets. Additionally, by pinpointing gaps and potential areas for future exploration, our goal is to encourage innovation and progress in this dynamically evolving domain. Through a
Automated Visualization for Visual Analytics: Trends, Challenges, and Opportunities 437
systematic examination of these systems, we contribute to the advancement and refinement of automatic data visualization methodologies, fostering innovation and improved usability in data visualization tools and systems.
In Related Work, we summarize related work in the area. In the section Survey Methodology, we detail our approach to this survey paper. Then we review the top-tier papers in the field in the section Automatic Visualization Systems and discuss challenges that current automatic data visualization systems face, and opportunities derived from our survey in the challenges and opportunities. The next section is about the discussion and limitations of our survey, and finally, our last section is the conclusion.
RELATED WORK
Automated visualization systems are a relatively new area of research. There is a small dedicated group of researchers from visualization and graphics. The top-tier papers in this area are limited compared with other Human- Computer Interaction (HCI) research.
There are a few surveys in this field. Wu, Wang, Shu, et al. (2021) explored the concept of formalizing visualizations as a data format and examining recent advancements in applying artificial intelligence (AI) techniques to visualization data, referred to as AI4VIS. The focus is on understanding and analyzing the digital representations of visualizations stored in computers, with an emphasis on data visualization, such as charts and infographics. The paper outlines a series of typical tasks researchers utilize for visualizing data and provides an in-depth examination of AI methodologies designed to fulfil these tasks. Zhu et al. (2020) reviewed and categorized automatic tools and academic papers in their survey, which focused on providing recommendations for visualizing data in various applications. These recommendations are classified into different categories based on the type of visualization they pertain to, such as network graph visualizations, annotation visualizations, and storytelling visualizations. Wang (Wang et al., 2021) surveyed papers of machine learning techniques applied to visualizations with the agenda of answering “what visualization processes can be assisted by ML?” and “how ML techniques can be used to solve visualization problems?”.
In contrast to previous survey papers, which primarily focus on summarizing existing automatic visualization generation systems using AI, our review expanded the scope to include template-based approach and other non-AI based algorithm approach. Our objective is to provide a comprehensive overview of these systems while also identifying the research problems and gaps they face.
SURVEY METHODOLOGY To provide an understanding of the current Automatic Visualization studies. We have conducted an analysis of 31 related papers in the fields of Visualization, Machine Learning, and Artificial Intelligence. Each paper is classified based on the approach used by the system or model in the paper to
438 Uppalapati and Sun
generate the visualization. Manual analysis is done for the collected papers to extract thorough details.
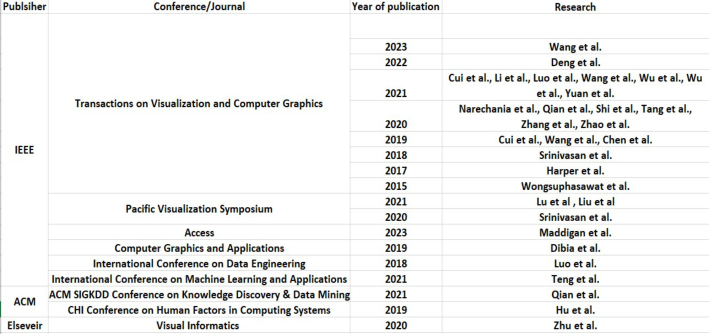
Survey Scope Our analysis commenced with the assembly of a comprehensive corpus of automatic visualization papers. We meticulously selected research articles published between January 2013 and December 2023 from prestigious journals and conferences associated with IEEE and ACM (see Figure 1). Leveraging Google Scholar’s top results, we focused on the past decade to capture the latest advancements in automatic visualization generation research.
To expedite the process without compromising accuracy, we adopted a method akin to previous studies by (Wang et al., 2021), primarily scrutinizing paper titles and abstracts. We reserved a detailed examination of the full manuscript for instances where title and abstract information were insufficient. We have even collected research papers related to the field of visualization if the abstract is talking about visualization generation. Throughout our search, we were attentive to keywords like “Automation,” “Infographic,” “Visualization,” “ML,” “AI,” and “Natural Language” to pinpoint relevant papers.
Figure 1: Diagram of a table showing the number of papers per conference/journal.
After following the process and filtering many papers, we included 31 top-tier papers for this review. Since the survey aims to understand the current studies in the field of automatic visualization, we focused on papers that mostly contribute to automating the process of visualization generation and papers related to automating aspects related to visualizations such as generating captions etc. Theory and evaluation papers were excluded. Then we validated the papers based on whether the paper contributes to the field in generating the visualizations automatically or automating aspects related to visualizations without the user manually taking the action.
Automated Visualization for Visual Analytics: Trends, Challenges, and Opportunities 439
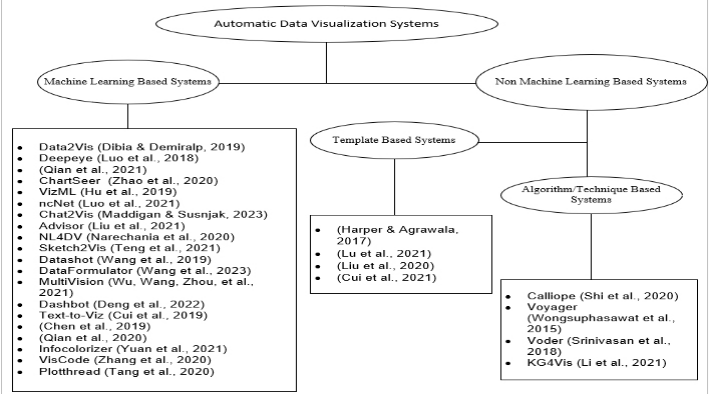
Figure 2: Diagram showing the classification of automatic data visualization systems in the study.
Paper Classification Our classification framework revolves around the approach adopted by each paper to generate visualizations. Papers are initially categorized into two main types: ML-based and non-ML-based. Non-ML-based systems are further classified into two sub-categories: Template-Based and Algorithm/technique-based (see Figure 2). This classification schema offers valuable insights into the diverse approaches employed in automatic visualization generation, highlighting their respective strengths and limitations.
Throughout our validation process, we meticulously ensured that each paper included in our analysis indeed contributed in a way to the automatic generation of visualizations or automation of aspects related to visualizations without manual intervention. This rigorous validation step underscores the reliability and credibility of the papers included in our survey. In summary, our methodology encompasses a systematic and thorough approach to analyzing the current landscape of automatic visualization studies, providing a robust foundation for our survey’s findings and conclusions.
AUTOMATIC VISUALIZATION SYSTEMS ML-Based Systems
ML-supported visualization generation systems reduce manual work by automatically generating visualizations for the input data using trained ML models.
Data2Vis is an end-to-end trainable neural translation model designed to automatically generate visualizations from given datasets. It employs Vega-Lite, a declarative language, to translate data specifications into
440 Uppalapati and Sun
visualization specifications. Utilizing a multilayered attention-based encoder- decoder network with LSTM units, Data2Vis streamlines the process of visualization generation (Dibia & Demiralp, 2019).
Evaluating and ranking visualizations is critical to guaranteeing the effectiveness and relevance of generated visual representations. To evaluate and prioritize visualizations, dedicated systems use machine learning techniques. Deepeye is a visualization system that solves three following problems: It recognizes whether a visualization is good or bad, it ranks which visualization is better between any 2 given two visualizations, and it finds the top k-visualizations for a given data set. It solves recognition issues by training a binary classifier to decide whether a visualization is good or bad. It solves visualization ranking issues in two ways either by using a supervised learning-to-rank model or relying on experts’ knowledge to specify partial orders as rules. Then, the graph-based approach and rule- based optimization efficiently compute top-k visualizations by filtering bad visualizations (Luo et al., 2018).
Similar to Luo’s approach (Luo et al., 2018), Qian (Qian et al., 2021) developed a machine-learning system to suggest visualizations for any given unseen new dataset. It automatically generates visualizations, assigns scores based on their effectiveness, and provides the user with a list of recommended visualizations in order of usefulness.
Assisting analysts with visual analysis involves automating elements of data exploration and interpretation. Machine learning systems make it easier for analysts to extract insights from complex datasets. Chartseer is a system that uses machine intelligence to assist analysts in visually monitoring their exploratory visual analysis (EVA). ChartSeer employs deep learning to analyze charts created by analysts, providing visual summaries, and suggesting relevant charts for further exploration based on user interactions. It contains a Data Storage and Analysis module, a Chart Encoder, and a Chart Decoder, which were trained using the GVAE deep learning model (Zhao et al., 2020).
Luo’s work (Luo et al., 2018) emphasis on analyzing and ranking visualizations is consistent with the goals of Zhao’s (Zhao et al., 2020) and Qian’s (Qian et al., 2021) work, where they used the ML approach to recommend visualizations based on their effectiveness.
Design choice during visualization development is critical for guiding the automated generation process. Some systems use machine learning algorithms to assess datasets and suggest the best visualization designs. VizML is a visualization approach in which the system learns from a large collection of datasets and their corresponding visualizations. The system identifies five key design choices analysts make: at the encoding level, choosing mark types using a shared axis or not and deciding how to represent data on the X and Y-axis; at the visualization level, selecting visualization types. VizML differs from other systems by focusing on suggesting design choices. It offers easier validation, interpretable measures, and smoother integration into visualization systems. The drawback is that it only suggests how to visually represent data and doesn’t provide recommendations for data queries. Information graphics are a type of data visualization that delivers
Automated Visualization for Visual Analytics: Trends, Challenges, and Opportunities 441
information in an engaging manner (Hu et al., 2019). Vizml’s predictive approach to visualization design is similar to Qian’s (Qian et al., 2021) system in suggesting visualizations based on machine learning-driven analysis.
Natural language querying enables people to engage with data and generate visualizations in a common language. Machine learning-based natural language processing systems enable users to communicate seamlessly with data visualization tools. Luo et al. (2021) present ncNet, a Transformer- based sequence-to-sequence model that supports the conversion of natural language queries on the given input dataset to visualization (NL2VIS). Additionally, it also takes in a chart template as a constraint to limit what could be visualized and then applies many visual optimizations to produce better visualization templates. Chat2VIS is a system that utilizes pre-trained large language models such as ChatGPT, GPT – 3 and Codex and converts natural language into code to generate visualizations (Maddigan & Susnjak, 2023). Advisor is an automatic system that creates visualizations with explanations to address questions from the public about tabular data. It has a pre-trained language model to convert natural language questions and table headers into vectors for a multi-task deep neural network, then identifies relevant data areas and determines the appropriate aggregation type based on these vectors. The results are presented with well-designed visualizations and annotations for different types of attributes and tasks (Liu et al., 2021). NL4DV is a toolkit that helps people use Natural language to interact with visual data for analysis. It has a query processor that infers relevant information from the input query, such as data attributes and analytic tasks. This information is then passed to a Visualization Recommendation Engine that generates a list of visualization specifications relevant to the input query (Narechania et al., 2020).
ncNet (Luo et al., 2021), Chat2Vis (Maddigan & Susnjak, 2023), Advisor (Liu et al., 2021), and NL4DV (Narechania et al., 2020) all focus on enabling natural language interaction for visualization tasks. Systems like Advisor and ncNet use explicit mechanisms to decide which visualizations to generate, while Chat2VIS addresses this gap with the help of an AI component’s ability to delegate the decision-making process for chart selection (Maddigan & Susnjak, 2023).
Getting visualizations generated from hand-drawn sketches allows designers and data analysts to experiment rapidly. The Sketch2Vis system uses advanced computer techniques to automatically create computer code for making graphs and charts from hand-drawn sketches (Teng et al., 2021).
Fact sheets provide brief summaries of facts, making complex information easy to comprehend for users. Automated systems that use machine learning can simplify the process of creating fact sheets from raw data. Datashot is an automated system that creates fact sheets automatically from tabular data. uses a trained decision tree model to select the best visualization style and generate fact sheets (Wang et al., 2019).
Interactive visualization tools help users to efficiently explore and express the results of data analysis. These tools frequently use machine learning approaches to speed up the visualization generation process. DataFormulator is an interactive tool for creating visualizations. It separates the high-level
442 Uppalapati and Sun
visualization ideas from the low-level data transformation steps with the help of an AI agent. The user describes the data they want to visualize in plain language. The tool’s AI agent then takes care of automatically transforming the data to match these descriptions with the help of a large language model and generates the desired visualizations (Wang et al., 2023).
Dashboards give customers a full picture of data, allowing them to track trends and make informed decisions. MultiVision is a deep learning model that not only selects data columns but also recommends multiple charts to simplify the process of creating analytical dashboards for data analysis. The model is part of a mixed-initiative system, allowing users to provide input for better recommendations. It introduces passive recommendations upon request and active recommendations that adjust automatically with user changes (Wu, Wang, Zhou, et al., 2021). Dashbot is a deep reinforcement learning-based recommendation system that uses a deep neural network to analyse data and create dashboards (Deng et al., 2022).
Creating an infographic involves more than just ensuring it effectively communicates information—it also requires attention to visual aesthetics. This aspect of the process can be challenging and time-intensive for both skilled designers and individuals lacking expertise in design. As a result, there is a growing need for automated tools that can streamline the infographic design process.
Like Data2Vis (Dibia & Demiralp, 2019), Text-to-Viz is a system that uses neural networks to convert statements about simple proportion-related statistics to a set of infographics with pre-designed styles. Infographics are effective tools for presenting complex information in an eye-catching way. Text-to-Viz uses a trained CNN + CRF model to identify and extract information for infographic constructions. A framework to systematically synthesize infographics is proposed. The infographics are ranked by taking three scores, including semantic, visual, and informative, into consideration. The infographics with the best overall score values are presented to the user for any changes, and then the user can save it (Cui et al., 2019).
Chen (Chen et al., 2019) presented an automated approach for designing timeline infographics. In his approach, a deep neural network extracts global (timeline representation, scale, layout) and local (element location, category, pixels) information from a bitmap timeline. Techniques like Non-Maximum Merging, Redundancy Recovery, and DL Grab Cut are employed to create an adaptable template and then generate the visualization using the template and the input data. Qian (Qian et al., 2020) suggested a new method to automate the creation of infographics by mimicking existing examples found online. Recursive neural networks and the Monte Carlo Markov Chain (MCMC) are commonly used in this method to improve the visual appearance of the initial draft until a satisfactory result is achieved.
Infographic design platforms frequently offer a restricted range of color palette choices, which can constrain users’ creative flexibility. Infocolorizer, a recommendation engine built using deep learning techniques, considers user preferences, automates the process, and tailors color palettes to the layout of elements (Yuan et al., 2021).
Automated Visualization for Visual Analytics: Trends, Challenges, and Opportunities 443
Enhancing visualizations entails adding additional information or increasing visual aesthetics while maintaining data integrity. Systems that enhance the visualization are as follows. VisCode is a method used to embed information into visualization images with minimal visual distortion. A Deep Neural Network model is trained on visualization images and QR Code data (Zhang et al., 2020).
Storyline visualizations show data in a narrative fashion, allowing users to follow a logical storyline while studying large datasets. Plot Thread is a tool that integrates a set of flexible interactions to support easy customization of storyline visualizations with the help of an AI agent, which also incorporates the authoring process (Tang et al., 2020).
Non-ML Based Systems Some researchers adopted templates or techniques instead of the ML approach to automate the creation of a visualization. In this section, we further classified this research into two more subcategories: template-based systems and Technique /Algorithm-based systems.
Template-Based Systems Template-supported visualization generation systems use an existing visualization as a template and generate a new visualization with the same style for a given input data. Harper (Harper & Agrawala, 2017) presented a technique for converting a basic D3 chart into a reusable style template and then generating a chart for the input data given in the style of that template. The proposed algorithm extracts components from D3 charts, and the representation aptly captures various chart structures, translatable into Vega-lite’s mapping-based format.
Data-based scrollytelling has grown in popularity because of its capacity to effectively communicate data insights. Despite its success, the process can be time-consuming due to the requirement to collect, analyze, and show data in an appealing and engaging manner. Lu (Lu et al., 2021) presented an automatic method to generate expressive scroll telling visualization, which can present easy-to-understand data facts through a carefully arranged sequence of views. The proposed method uses data mining to extract data facts from the tabular data given as input. Facts are divided into two categories: presentational (i.e., value, proportion, aggregation, and rank) and computational facts (i.e., distribution, difference, trend, association, extreme, and outlier). It computes the importance of the extracted facts, and arranges them in sequence, and then uses templates to generate visualization stories.
Visualization captions could assist analysts in quickly summarizing and interpreting visualizations. AutoCaption system presented a new method for automatically creating captions for visualization charts. A multilayer perceptron classifier to identify visual marks, visual channels, and associated text information in the charts. A 1-D convolutional residual network is then used to analyze relationships between visual elements and recognize important features. Finally, a template-based approach is employed to generate full descriptions of the visual charts (Liu et al., 2020).
444 Uppalapati and Sun
Infographic bar charts are extensively used to communicate numerical information, but changing or reusing them requires time-consuming and error-prone human editing. Cui (Cui et al., 2021) proposed an approach whereby, when given an infographic bar chart, visual elements are collected. Features are extracted from them, and several trained decision tree models were employed to identify corresponding information and recover data from the given chart. While users are operating the data, the algorithm detects the changes and updates the visual elements in the chart accordingly.
Algorithm-Based/Rule-Based Systems This section reviews the systems that use an algorithm or technique that is not ML-based.
Data storytelling helps people comprehend and communicate data insights. Creating engaging narratives from raw data makes complex information more understandable. Calliope is a data story generation system that creates visual data stories from an input spreadsheet through an automatic process. The system adopted a special algorithm called Monte Carlo tree search. It creates story pieces and data facts that are arranged in a logical order. The importance of the generated facts in each search step will be estimated by their information quantity, which is calculated based on the information theory and their pattern significance using auto-insight techniques (Shi et al., 2020).
Voyager is a system that aims to complement the manual construction of charts with an interactive gallery of automatically generated visualizations. Voyager employs a mixed-initiative approach, meaning it combines human input with automated assistance. It recommends charts based on statistical and perceptual measures. The system supports faceted browsing by allowing users to explore and navigate the recommended visualizations (Wongsuphasawat et al., 2015). (Srinivasan et al., 2018) presented Voder, a system that lets users interact with the automatically generated data facts in exploring both alternative visualizations and conveying a data fact presented by a set of embellishments within a visualization.
Like ML-based systems, Chartseer (Zhao et al., 2020) and MultiVision (Wu, Wang, Zhou, et al., 2021), Voyager (Wongsuphasawat et al., 2015), and Voder (Srinivasan et al., 2018) assist the users in exploring and selecting relevant visualizations.
ML-based techniques frequently function as black boxes, making it difficult to comprehend why a certain visualization is suggested, potentially restricting their widespread adoption. To fill this gap, Li (Li et al., 2021) presented KG4Vis, a Knowledge Graph (KG)-based approach for visualization recommendation. The recommendation algorithm uses embedding-based methods and the widely recognized embedding approach, TransE. TransE learns the embedding vectors of entities and relations in the KG, automatically generates meaningful rules, and then suggests suitable visualizations based on data. This approach aligns with ncNet (Luo et al., 2021) and NL4DV (Narechania et al., 2020) in leveraging semantic understanding for visualization recommendation.
Automated Visualization for Visual Analytics: Trends, Challenges, and Opportunities 445
CHALLENGES AND OPPORTUNITIES In this section, we highlight the challenges of automated visualization systems. By doing this, we aim to provide a holistic view of the current state of the field and inspire future research efforts to overcome existing limitations and advance the capabilities of automatic visualization systems.
In this study, the challenges encountered by machine learning (ML) based systems can be generalized into five categories. These include Scope limitations, Data understanding and representation, Interaction and flexibility, Creativity and Generalization and Technical limitations.
Scope Limitations: Many systems are constrained by their choice of visualizations, the types of datasets they handle, or the complexity of the tasks they support. For instance, Data2Vis sometimes selects fields with low information values, resulting in simplistic visualizations (Dibia & Demiralp, 2019). Deepeye only supports four types of visualizations (pie chart, bar graph, line chart, and scatterplot), limiting its adaptability to complex datasets (Luo et al., 2018). VizML favours Plotly datasets and focuses on a subset of tasks in visualization recommendation, potentially limiting its applicability to diverse datasets and tasks (Hu et al., 2019).
Data Understanding and Representation: Challenges arise in interpreting the semantics of the data and representing it effectively in visualizations. This includes issues such as overlooking semantic meanings between data points, bias in fact generation, and limitations in handling diverse or complex data transformations. For example, Datashot evaluates data in tables individually, ignoring semantic meanings between data during fact sheet generation, leading to potential inaccuracies (Wang et al., 2019). Data Formulator focuses on fundamental transformations, potentially limiting its ability to handle diverse and complicated data transformations (Wang et al., 2023). Chartseer recommended charts have limited effectiveness due to its inability to display temporal details (Zhao et al., 2020).
Interaction and Flexibility: Systems that enable natural language interaction or dashboard generation may face limitations in handling iterative queries, semantic parsing, inefficient algorithms for large datasets or providing flexibility in visualization choices. For example, ncNet is limited to processing single queries, limiting its usability for iterative or complex data analytics tasks (Luo et al., 2021). Chat2VIS and Advisor systems lack flexibility since they have semantic parsing limitations (Liu et al., 2021; Maddigan & Susnjak, 2023). NL4DV faces challenges in handling complex query structures (Narechania et al., 2020). MultiVision training time increases with column count, which can limit its scalability for large-dimensional data (Wu et al., 2021). Dashbot considers diversity and parsimony between charts but lacks consideration for the effectiveness of charts in dashboard creation, limiting flexibility in dashboard design (Deng et al., 2022).
Creativity and Generalization: Systems for infographic generation or visualization enhancement may struggle with creativity and generalization. This involves challenges such as limited dataset support, understanding the learning process of models, and the need for broader support for various
446 Uppalapati and Sun
types of visualizations. For example, Text-to-Viz Capable of handling only proportional assertions, limiting the creativity of infographics (Cui et al., 2019). Chen (Chen et al., 2019) model’s reliance on limited datasets and the learning process being a ‘black box’ may hinder generalization and understanding of the model. The system Qian (Qian et al., 2020) presented is limited to proportion-related infographics, requiring generalization to support other types. Storylines created by the Plotthread system lack creativity (Tang et al., 2020).
Technical Constraints: Limitations in handling poor-quality inputs, inefficient techniques or accommodating diverse user preferences, also play a significant role in hindering system performance and effectiveness. For example, the oversimplified scoring techniques in Qian (Qian et al., 2021) proposed system result in visualizations with the same score, making it difficult to rank them. The Viscode system struggles with deformed input images, and there is a limit to the amount of information that can fit into visualizations (Zhang et al., 2020). The Infocolorizer struggles to recommend proper color palettes for data charts in infographics (Yuan et al., 2021).
Even though each system may face a unique set of challenges, there are some common ones. For example, many systems have difficulty scaling, especially when confronted with complex tasks or large datasets. Many systems struggle with flexibility and adaptability, particularly when dealing with changing user needs, preferences, and data types.
The challenges associated with systems that do not use machine learning models are as follows. Template-based methods, in general, have a limited ability to represent diverse visualization types, lack flexibility, struggle with handling dynamic visualization elements, require manual corrections, and may produce less accurate and detailed captions. For example, the tool introduced by Harper and Jonathan (Harper and Jonathan, 2017) demonstrates limitations in representing complex visualizations and struggles with handling dynamic visualization elements. Lu’s (Lu et al., 2021) approach is frequently criticized for its repetition and lack of flexibility in visualizations. AutoCaption faces issues regarding the accuracy and complexity of generated captions for visualizations (Liu et al., 2020). Cui’s (Cui et al., 2021) system faces a significant challenge in managing chart-level elements and requires manual corrections.
Algorithm based/ Rule-based systems, in general, lack the adaptability to deal with complicated data or tasks that require expert knowledge. They may suffer from scalability, interactivity, and incorporation of effective semantic understanding. For example, Calliope generated captions are overly rigid and lack semantic depth (Shi et al., 2020). Datashot has scalability issues with large multidimensional datasets (Wongsuphasawat et al., 2015). Voyager systems have limited effectiveness in performing specific tasks and lack interactivity in visualizations (Srinivasan et al., 2018). KG4Vis faces issues with adaptability to deal with complicated tasks that require expert knowledge; it has limited visualization design choices and lacks flexibility (Li et al., 2021).
Automated Visualization for Visual Analytics: Trends, Challenges, and Opportunities 447
DISCUSSIONS AND LIMITATIONS OF SURVEY In this section, we discuss the findings of our survey and their implications. From closely looking at the current automated visualization systems most of them often provide predefined templates or algorithms for generating visualizations, which may limit the level of customization possible. The majority of existing autonomous data visualization systems use simple chart formats such as line charts, bar charts, pie charts, and scatter plots. While these chart formats are useful for expressing specific types of data, they may not be able to visualize complex datasets. One of the most significant shortcomings of these systems is they lack the contextual understanding of the data that human analysts possess. Ignoring context between the data might result in visualizations that fail to properly express significant aspects of the data. Without regard for the meaning behind the data points, visualizations may appear disconnected or misleading, making it difficult for users to analyze and derive useful insights. Some of the systems deal with empty values and avoid such rows from the tables, but the majority of the systems do not deal with data quality before generating the visualizations. For example, If the data is incomplete, inconsistent, or contains errors, it can lead to inaccurate or misleading visualizations. Most of the generated visualizations lack interactivity. None of the visualization systems focus on the security aspect when dealing with sensitive data. Hierarchical data visualization allows for easy comparison between different levels of hierarchy, enabling users to identify similarities, differences, and patterns across various parts of the data. Notably, the major finding of our survey is that there is a significant gap in the automated visualization of hierarchical data, which suggests promising directions for future work.
The survey we conducted is not exhaustive. We excluded theory and evaluation publications from our research. Evaluating the generated visualization is a crucial aspect in knowing the effectiveness of the visualizations. Automatic data visualization is an active research topic with significant potential in the field of visual analytics, and we anticipate many more studies will be undertaken to improve our understanding.
CONCLUSION
In this study, we reviewed 31 top-tier papers related to current methods in automated data visualization. We focused on the aspects of automating related to data visualization to get a comprehensive overview. Then we divided the existing systems into ML-based approaches, template-based approaches, and rule-based approaches that use a certain technique/ algorithm. We highlighted the challenges of the field and potential research prospects in autonomous data visualization based on our study of the papers. This survey will provide important insights into autonomous data visualization and encourage further research.
448 Uppalapati and Sun
REFERENCES
Chen, Z., Wang, Y., Wang, Q., Wang, Y., & Qu, H. (2019). Towards automated infographic design: Deep learning-based auto-extraction of extensible timeline. IEEE transactions on visualization and computer graphics, 26(1), 917–926. Cui, W., Wang, J., Huang, H., Wang, Y., Lin, C.-Y., Zhang, H., & Zhang, D. (2021).
A mixed-initiative approach to reusing infographic charts. IEEE Transactions on Visualization and Computer Graphics, 28(1), 173–183. Cui, W., Zhang, X., Wang, Y., Huang, H., Chen, B., Fang, L.,... Zhang, D.
(2019). Text-to-viz: Automatic generation of infographics from proportion- related natural language statements. IEEE transactions on visualization and computer graphics, 26(1), 906–916. Deng, D., Wu, A., Qu, H., & Wu, Y. (2022). Dashbot: Insight-driven dashboard generation based on deep reinforcement learning. IEEE Transactions on Visualization and Computer Graphics, 29(1), 690–700. Dibia, V., & Demiralp, Ç. (2019). Data2vis: Automatic generation of data visualizations using sequence-to-sequence recurrent neural networks. IEEE computer graphics and applications, 39(5), 33–46. Harper, J., & Agrawala, M. (2017). Converting basic D3 charts into reusable
style templates. IEEE transactions on visualization and computer graphics, 24(3), 1274–1286. Hu, K., Bakker, M. A., Li, S., Kraska, T., & Hidalgo, C. (2019). Vizml: A machine learning approach to visualization recommendation. Proceedings of the 2019 CHI Conference on Human Factors in Computing Systems. Li, H., Wang, Y., Zhang, S., Song, Y., & Qu, H. (2021). KG4Vis: A knowledge
graph-based approach for visualization recommendation. IEEE Transactions on Visualization and Computer Graphics, 28(1), 195–205. Liu, C., Han, Y., Jiang, R., & Yuan, X. (2021). Advisor: Automatic visualization answer for natural-language question on tabular data. 2021 IEEE 14th Pacific Visualization Symposium (PacificVis). Liu, C., Xie, L., Han, Y., Wei, D., & Yuan, X. (2020). AutoCaption: An approach
to generate natural language description from visualization automatically. 2020 IEEE Pacific visualization symposium (PacificVis). Lu, J., Chen, W., Ye, H., Wang, J., Mei, H., Gu, Y.,... Ma, K.-L. (2021). Automatic generation of unit visualization-based scrollytelling for impromptu data facts delivery. 2021 IEEE 14th Pacific visualization symposium (PacificVis). Luo, Y., Qin, X., Tang, N., & Li, G. (2018). Deepeye: Towards automatic
data visualization. 2018 IEEE 34th international conference on data engineering (ICDE). Luo, Y., Tang, N., Li, G., Tang, J., Chai, C., & Qin, X. (2021). Natural language to visualization by neural machine translation. IEEE Transactions on Visualization and Computer Graphics, 28(1), 217–226. Maddigan, P., & Susnjak, T. (2023). Chat2vis: Generating data visualisations via
natural language using chatgpt, codex and gpt-3 large language models. IEEE Access. Narechania, A., Srinivasan, A., & Stasko, J. (2020). NL4DV: A toolkit for generating analytic specifications for data visualization from natural language queries. IEEE Transactions on Visualization and Computer Graphics, 27(2), 369–379. Qian, C., Sun, S., Cui, W., Lou, J.-G., Zhang, H., & Zhang, D. (2020). Retrieve-then-
adapt: Example-based automatic generation for proportion-related infographics. IEEE Transactions on Visualization and Computer Graphics, 27(2), 443–452.
Automated Visualization for Visual Analytics: Trends, Challenges, and Opportunities 449
Qian, X., Rossi, R. A., Du, F., Kim, S., Koh, E., Malik, S.,... Chan, J. (2021). Learning to recommend visualizations from data. Proceedings of the 27th ACM SIGKDD Conference on Knowledge Discovery & Data Mining. Shi, D., Xu, X., Sun, F., Shi, Y., & Cao, N. (2020). Calliope: Automatic visual
data story generation from a spreadsheet. IEEE Transactions on Visualization and Computer Graphics, 27(2), 453–463. Srinivasan, A., Drucker, S. M., Endert, A., & Stasko, J. (2018). Augmenting visualizations with interactive data facts to facilitate interpretation and communication. IEEE transactions on visualization and computer graphics, 25(1), 672–681. Tang, T., Li, R., Wu, X., Liu, S., Knittel, J., Koch, S.,... Wu, Y. (2020). Plot Thread:
Creating expressive storyline visualizations using reinforcement learning. IEEE Transactions on Visualization and Computer Graphics, 27(2), 294–303. Teng, Z., Fu, Q., White, J., & Schmidt, D. C. (2021). Sketch2Vis: Generating data visualizations from hand-drawn sketches with deep learning. 2021 20th IEEE International Conference on Machine Learning and Applications (ICMLA). Wang, C., Thompson, J., & Lee, B. (2023). Data Formulator: Ai-powered concept-
driven visualization authoring. IEEE Transactions on Visualization and Computer Graphics. Wang, Q., Chen, Z., Wang, Y., & Qu, H. (2021). A survey on ML4VIS: Applying machine learning advances to data visualization. IEEE transactions on visualization and computer graphics, 28(12), 5134–5153. Wang, Y., Sun, Z., Zhang, H., Cui, W., Xu, K., Ma, X., & Zhang, D.
(2019). Datashot: Automatic generation of fact sheets from tabular data. IEEE transactions on visualization and computer graphics, 26(1), 895–905. Wongsuphasawat, K., Moritz, D., Anand, A., Mackinlay, J., Howe, B., & Heer, J. (2015). Voyager: Exploratory analysis via faceted browsing of visualization recommendations. IEEE transactions on visualization and computer graphics, 22(1), 649–658. Wu, A., Wang, Y., Shu, X., Moritz, D., Cui, W., Zhang, H.,... Qu, H. (2021).
Ai4vis: Survey on artificial intelligence approaches for data visualization. IEEE Transactions on Visualization and Computer Graphics, 28(12), 5049–5070. Wu, A., Wang, Y., Zhou, M., He, X., Zhang, H., Qu, H., & Zhang, D.
(2021). MultiVision: Designing analytical dashboards with deep learning-based recommendation. IEEE Transactions on Visualization and Computer Graphics, 28(1), 162–172. Yuan, L.-P., Zhou, Z., Zhao, J., Guo, Y., Du, F., & Qu, H. (2021). Infocolorizer: Interactive recommendation of color palettes for infographics. IEEE Transactions on Visualization and Computer Graphics, 28(12), 4252–4266. Zhang, P., Li, C., & Wang, C. (2020). Viscode: Embedding information in
visualization images using encoder-decoder network. IEEE Transactions on Visualization and Computer Graphics, 27(2), 326–336. Zhao, J., Fan, M., & Feng, M. (2020). Chartseer: Interactive steering exploratory visual analysis with machine intelligence. IEEE Transactions on Visualization and Computer Graphics, 28(3), 1500–1513. Zhu, S., Sun, G., Jiang, Q., Zha, M., & Liang, R. (2020). A survey on automatic
infographics and visualization recommendations. Visual Informatics, 4(3), 24–40.
LISTED IN THE AHFE DIGITAL BOOKSTORE CATALOGUE
Explore the complete digital volume
Human Interaction and Emerging Technologies (IHIET 2024)
Read this individual research paper free through the original publisher, or explore the full digital proceedings book.
ISBN 978-1-964867-33-5
Explore this ISBN in the AHFE Bookstore ↗Listed in the July 2026 bookstore catalogue; search by ISBN to confirm current availability · Digital book purchase optional