Ze Wang, Hongyue Wu, Yunfeng Chen, Jiansong Zhang, James L Jenkins (2024). Exploring Driving Style Variations When Driving in Work Zone: A Driving Simulation Study. In: Human Factors in Design, Engineering, and Computing. AHFE Open Access, vol. 159, pp. 2076–2086. https://doi.org/10.54941/ahfe1005775
Traffic safety hinges on individual driving styles, which can vary within a single trip through a work zone. A work zone, with its limited visibility, heavy machinery, and unexpected traffic flow, is a major contributor to a high number of traffic accidents. Driving style has a significant effect on driving behavior and directly impacts driving safety. However, studies on the variation in driving styles in the specific scenario of driving through a work zone are still missing. Also, most studies used either surveys or machine learning methods for classifying driving styles, while there is a lack of comparison between these two classification methods. To address the gaps, this study aims to detect and classify variations in driving styles when driving through a work zone and compare the results obtained from the self-evaluation method with those from the machine learning method. Firstly, a lane closure work zone was simulated by Webots and SUMO, based on a real-world case of an urban road section in Indiana state. Daytime and nighttime scenarios were included to analyze variations in driving styles. Secondly, sixteen participants were invited to drive through the road section with a lane closure work zone using a driving simulator. Their driving speed, as well as acceleration and deceleration, were collected by Webots. Then, the K-means algorithm was used to classify three types of driving styles (aggressive, normal, or calm) based on the total non-linear traits in the driving data (eg, speed, acceleration). Finally, a self-evaluation survey on driving styles was conducted after the driving simulation experiment, and a comparative analysis was performed between the self-evaluation survey data and the driving simulation data. The results show that 1) The percentage of aggressive driving style was 51.6%. Participants tended towards a calm driving style at nighttime compared to daytime, and the normal driving style remained consistent across both daytime and nighttime; 2) There were significant differences between self-evaluation and K-means method on driving styles. Compared to the results from the K-means method, drivers tended to overestimate their normal driving style and underestimate their aggressive driving style based on the results from the self-evaluation method.; and 3) There was an observed increase in calm driving style before and during the work zone, contrasting with a rise in aggressive driving tendencies after exiting. The results may help understand the variance of driving styles in a work zone and improve the classification accuracy of driving styles by comparing the differences between driving data evaluation and post-survey data evaluation.
Exploring Driving Style Variations When Driving in Work Zone 2077
INTRODUCTION
A work zone is an area in a road section where construction, maintenance, or utility work activities are taking place, which is increasingly common and pose potential safety hazards (Yang et al., 2015). Some studies have analyzed the impact of work zones on driving behaviors. For instance, Banerjee & Jeihani (2019) studied the impact of different work zone barriers on driver behaviors using a driving simulator. Lu et al. (2021) investigated the impact of work zone crossovers on traffic safety, revealing significant differences in driving behaviors at different work zone positions. However, the study of driving style variation in a work zone is still lacking. Driving style is a different concept compared to driving behavior (Shi et al., 2015); it is complex and dynamic, which could vary within a single trip and could be influenced by factors such as time of day, road conditions, etc. Identifying and classifying driving styles is crucial for transportation efficiency and safety because some studies suggest that it can be a predictor of accidents (Wijnands et al., 2018).
Previous studies defined driving style based on drivers’ experience and character, including habits and attention levels (Fazeen et al., 2012; Kaplan et al., 2015). Currently, two typical methods are used for identifying and classifying driving styles: subjective questionnaires and machine learning techniques. On the one hand, Xu et al. (2023) utilized the Chinese version of the Multidimensional Driving Style Inventory (MDSI) scale (MDSI-C) to classify driving styles based on drivers’ self-evaluation data. Useche et al. (2019) used Qualtrics to collect data from Colombian drivers according to the MDSI and found a significant relationship between MDSI factors (reckless & careless, anxious, angry & hostile, and patient & careful) and driving anger, job strain, and occupational driving crashes. Li et al. (2017) used the confirmatory factor analysis (CFA) method to analyze underlying factors of driving styles based on data from driver behavior questionnaires administered to non-professional drivers in Beijing. However, self-evaluation reports may lead to some incorrect classifications of driving style because drivers might forget some details of their driving behaviors. On the other hand, some studies focus on using machine learning methods to determine driving styles based on driving data (Chang & Edara, 2017; Marina Martinez et al., 2018). For example, Wang et al. (2017) classified normal and aggressive driving styles using two SVM models, one with an RBF kernel and the other with a linear kernel, reporting accuracies of 0.772 and 0.86, respectively. Meseguer et al. (2013) developed an artificial neural network (ANN) with a single hidden layer containing nine neurons to classify driving style into three categories (aggressive, normal, or quiet) based on vehicle speed and acceleration data, reporting an accuracy of 0.77. Some studies use fuel consumption as an indicator of driving styles (Corti et al., 2013). Mei et al. (2023) classified the driving styles from three types of road conditions based on two machine learning methods (K-means and K-medoids). Many studies have also used different machine learning algorithms to classify driving styles, such as fuzzy logic, Random Forest, ANN, and SVM (Dorr et al., 2014; Silva & Eugenio Naranjo, 2020). However, the classification results based on
machine learning algorithms are inconsistent and difficult to understand from a non-statistical perspective. In addition, both survey and machine learning methods can detect and identify driving styles, but the classification results are unstable and inconsistent between these two methods. There is still a lack of studies comparing survey self-evaluation methods with machine learning based on driving data methods. It is crucial to accurately explore driving styles by establishing a connection or identifying the differences between the two methods.
To address these research gaps, this study aims to explore the driving style variation in a work zone and compare the results of driving style based on survey self-evaluation and machine learning methods. Firstly, participants were invited to complete a driving simulation experiment and a post-survey. Subsequently, different driving styles of participants were classified based on the driving data (using machine learning method) and post-survey data (using self-evaluation method), respectively. Finally, the variations in driving styles in a work zone were analyzed, and the results from different methods were compared.
METHODOLOGY
This section introduces the research methodology. Firstly, driving scenarios were generated using Webots and Simulation of Urban Mobility (SUMO) software, simulating a real-world road section. Secondly, sixteen participants completed the driving simulation experiment and a post-survey. Thirdly, a machine learning algorithm, the K-means method, was used to classify driving styles based on total driving data, including longitudinal acceleration and speed collected from the simulator. And the self-evaluation method was applied to classify driving styles based on the post-survey data. Finally, the results of driving style classification from different methods were compared.
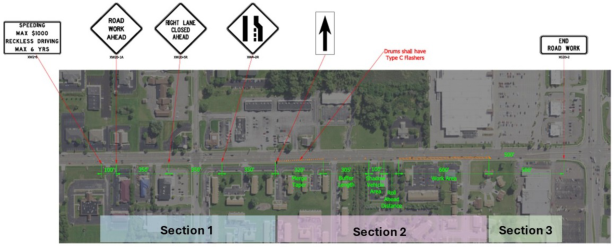
Driving Scenarios and Styles A driving simulator was used in this study because it is an ideal tool for collecting driving data and for creating more realistic driving scenarios (Cheng et al., 2018; Wang et al., 2017). A specific urban roadway section was selected based on crash analysis from a previous study (Wu et al., 2024). This roadway section is in Indiana, spans 3,860 feet, has five lanes (including a dual-turn lane in the middle) in two directions, with speed limit of 40 mph, and includes three sections (1, 2, and 3) representing the areas before, within, and after the work zone, as shown in Figure 1. A standard work zone layout, including traffic drums, traffic signs, and arrow board devices, was set up according to the Indiana Manual on Uniform Traffic Control Devices (MUTCD) (INDOT, 2022), Work Zone Traffic Control Guideline in Indiana, and Indiana Standard Drawings. Moreover, the number of vehicles traveling in the opposite direction at a speed of 40 mph (the road speed limit) was simulated based on Annual Average Daily Traffic (AADT) data from the Indiana Traffic Management System.
Exploring Driving Style Variations When Driving in Work Zone 2079
Figure 1: The map and layout of the work zone scenario.
A study notes that driving styles differ for each driver and reflect stable habits over time and a driver’s driving style can change within a single trip and on the same roadway section (Sagberg et al., 2015; Silva & Eugenio Naranjo, 2020). In this paper, the driving style is defined as three types (calm, normal, aggressive) according to a previous study (Murphey et al., 2009). These types correspond to self-evaluated points on a scale from 1 to 9. This scale is divided into three stages with intervals of 3, representing calm, normal, and aggressive driving styles, respectively, with higher points indicating more aggressive driving styles. In addition, the time of the day (daytime or nighttime) was taken into consideration in this study because it is a key factor that affects driving styles (Huang et al., 2011).
Participants and Data Collection Sixteen participants with normal eyesight were invited to this driving simulation test through social media and flyers. All participants possess a valid driver’s license, with ages ranging from 19 to 63 years. The average age of the participants is 40 years, with a standard deviation of 14.27.
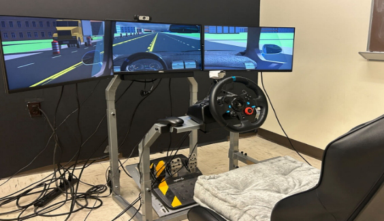
The driving simulator used in this study includes three monitors and a Logitech G29 racing wheel, as shown in Figure 2. Webots and SUMO software were used to create driving scenarios, including road, traffic conditions, weather, buildings, and vehicles, based on real-world roadway information. Drivers use the steering wheel and pedals from the G29 device to control the vehicle in the Webots platform.
Figure 2: Driving simulator for the experiment.
The experiment uses a Latin square design for both daytime and nighttime to balance the learning effect on the driving test. Before the formal driving simulation test, there was a training section to familiarize participants with the driving simulator. The final step was a post-survey, where participants self-evaluated their driving style. All driving data, including speed and acceleration, were collected by Webots with a frequency of 32 Hz in the driving simulator.
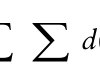
CLASSIFICATION K-means method, which is an unsupervised method for clustering data into k clusters (Mantouka et al., 2019), is used to classify the driving styles (Mohammadnazar et al., 2021). For the dataset, the objective function is used, given by:
k X
Equation reproduced from the original PDF.
Binary indicator variables rnk ∈{0, 1}, the K is the number of clusters. C1, . . . , CK, µ (Ci) means the centroid of cluster Ci, and the (x, µ (Ci)) means the distance between the observation x and µ(Ci). The speed and longitudinal acceleration are selected as feature vector parameters (C1, C2) for classification because they directly indicate driving preferences (Xu et al., 2023).
RESULTS AND DISCUSSION
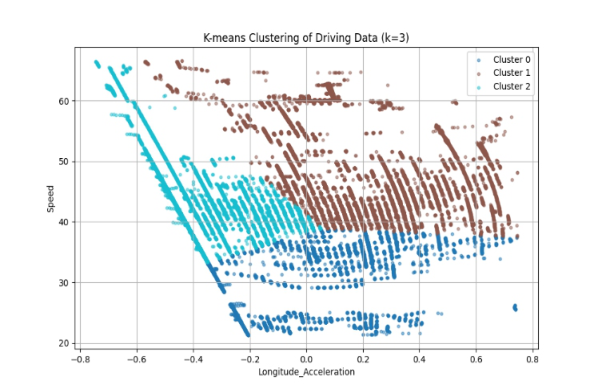
The classification results of driving styles using the K-means method are shown in Figure 3, based on the total driving data, including both daytime and nighttime. The clustering results highlight distinct driving styles, with Cluster 0 drivers tending to drive slower and brake more often, Cluster 1 drivers exhibiting higher speed and variable acceleration behavior, and Cluster 2 drivers maintaining moderate speed with consistent deceleration. Additionally, this study also used the combination of longitudinal acceleration and speed to describe different driving styles. A low speed with a large acceleration indicates aggressive driving. Conversely, low speed with a small acceleration indicates calm driving (Wang & Xi, 2016). Therefore, clusters 0, 1, and 2 correspond to calm, aggressive, and normal driving styles, respectively.
The statistical characteristics of the driving data features are shown in Table 1. The P-values of the features for both longitudinal acceleration and speed are <0.01, indicating that these two features are significantly different based on the Analysis of Variance (ANOVA) test results. This also indicates that driving styles vary significantly in this specific scenario, a lane closure work zone.
In addition, Table 2 shows the different percentages of each cluster for daytime and nighttime. The percentages of clusters 0 to 2 (calm, aggressive, and normal) are 18.25%, 51.61%, and 30.13%, respectively. The percentage of nighttime in cluster 0 is 10.40%, which is higher than the daytime
Exploring Driving Style Variations When Driving in Work Zone 2081
percentage of 7.85%. Conversely, the percentage of nighttime in cluster 1 is 24.41%, which is lower than the daytime percentage of 27.20%. It indicates that driving styles vary between daytime and nighttime: 1) Nighttime driving tends to be calmer, with a higher percentage of drivers in Cluster 0 compared to daytime; 2) Daytime driving sees more aggressive driving behaviors, with Cluster 1 being more prominent during the day; 3) The distribution of normal driving styles (Cluster 2) remains relatively consistent across both daytime and nighttime. This data also suggests that drivers are generally more cautious at night, possibly due to lower visibility, leading to a higher percentage of calm driving style.
Figure 3: The results of the driving styles classification based on the K-means method.Table 1. The statistical metrics of classification features in each cluster.
Table available in the original PDF paper.
Dimension Cluster F P-value
0 1 2
Acceleration std 0.21 0.20 0.17 24654 <0.01 mean 0.08 0.16 -0.31 median 0.06 0.12 -0.36 Speed std 5.26 6.46 5.04 19703 <0.01 mean 31.30 46.38 41.89 median 33.53 44.14 40.99
Table 2. The percentage of different types of driving styles.
Table available in the original PDF paper.
Day of Time Cluster 0 Cluster1 Cluster 2 Total Daytime 7.85% 27.20% 14.96% 50.02% Nighttime 10.40% 24.41% 15.17% 49.98% Total 18.25% 51.61% 30.13% 100.00%
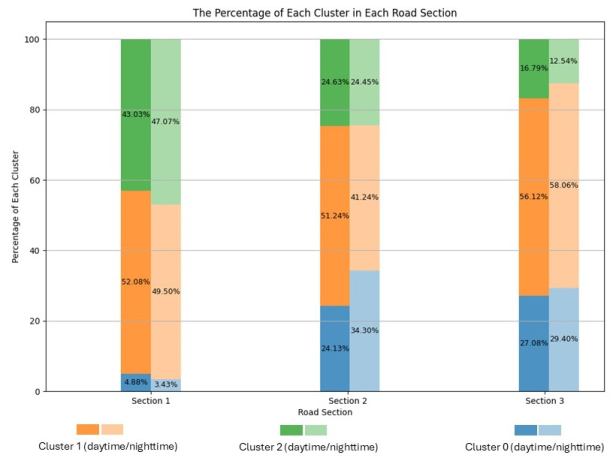
Moreover, the roadway was divided into three sections based on the layout in Figure 1. Section 1 represents the roadway before entering the work zone area, Section 2 represents the work zone area itself, including the buffer length and merging length, and Section 3 represents the roadway after exiting the work zone area. The proportion of each driving style varies between these sections, as shown in Figure 4. Cluster 0 generally increased from Section 1 to Section 3, with nighttime percentages consistently lower than daytime in Section 1 but higher in Sections 2 and 3. Cluster 0 peaked in section 2 compared to other sections, which means drivers were driving calmer. Cluster 1 dominated across all sections, with slightly lower percentages at nighttime compared to daytime. Cluster 1 peaked in Section 3, indicating a higher tendency for aggressive driving post-work zone. Cluster 2 generally decreased from Section 1 to Section 3, with higher percentages in Section 1 indicating more normal driving style before entering the work zone. These results show an increase in calm driving (Cluster 0) and a decrease in normal driving (Cluster 2) from Section 1 to 3, suggesting drivers become calmer through the work zone, especially at nighttime, with normal driving further dropping in the post-work zone, replaced by a higher percentage of aggressive driving style (Cluster 1).
Figure 4: The percentage of each cluster in each road section.
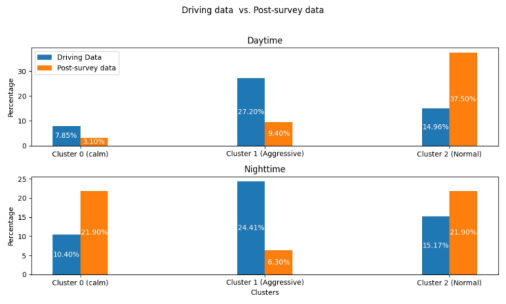
Figure 5 shows the classification differences in driving styles between the self-evaluation method and the K-means method. The distribution of the K-means method shows that the aggressive driving style has the highest representation (51.61%) across both daytime and nighttime. This indicates that the aggressive driving style is the most prevalent in this experiment, which may be caused by the perception of speed being slower in the driving
Exploring Driving Style Variations When Driving in Work Zone 2083
simulator compared to real driving. However, the normal driving style plays a key role, with a proportion of 59.4% based on the self-evaluation method. This reveals notable differences in driving style classification between the self-evaluation method and the K-means method. Secondly, during the daytime, the self-evaluation method shows 37.50% of normal driving style, compared to 14.96% from the K-means method, while aggressive driving style is classified at 9.40% versus 27.20% separately. For nighttime, the self- evaluation method results show 21.90% for calm driving style and 6.30% for aggressive driving style, compared to 10.40% and 24.41% from the K- means method, respectively. The discrepancies between actual driving data and survey data suggest that drivers may have a skewed perception of their driving styles, often perceiving themselves as driving more normally and calmly rather than aggressively.
Figure 5: The comparison of each driving style between the two methods.
CONCLUSION
This research aims to detect and classify the driving styles of participants driving through a work zone based on driving data and compare the difference between machine learning and self-evaluation methods on classifying driving styles. This study utilized the K-means clustering method to categorize driving styles based on driving data collected in driving simulation experiments during both daytime and nighttime. The results show that the aggressive driving style, at 51.61%, had a higher proportion compared to the other two driving styles. Additionally, nighttime driving tended toward a calmer driving style, while daytime driving exhibited a more aggressive driving style. The comparison between self- evaluation (i.e., survey data after experiment) and driving data evaluation highlighted discrepancies, suggesting that drivers may not accurately perceive their driving styles, particularly overestimating normal driving style and underestimating aggressive driving style. These insights help understand the gap between self-perception and actual driving style, which may improve driver awareness and align perceptions with actual performance to enhance
work zone safety. In addition, different roadway sections in a work zone had varying driving styles, with an increase in calm driving before and during the work zone (Sections 1 and 2) and a shift towards aggressive driving after exiting (Section 3), highlighting the influence of work zone on driver styles. This study provides new insights into driving styles by combining self-evaluation and machine learning methods. In practice, understanding the variations in driving styles when driving through a work zone can enhance work zone safety. Additionally, this research can help establish a connection between drivers’ self-perception and their actual driving style performance.
ACKNOWLEDGMENT
The authors would like to acknowledge the support of the Indiana Department of Transportation (INDOT). We also extend our gratitude to the participants who took part in the driving simulation experiment, including the driving test and experimental survey.
REFERENCES
Banerjee, S., & Jeihani, M. (2019). Influence of Mobile Work Zone Barriers on Driver Behavior on Freeways: A Driving Simulator Study. 235–246. https://do i.org/10.1061/9780784482575.023 Chang, Y., & Edara, P. (2017). Predicting hazardous events in work zones
using naturalistic driving data. 2017 IEEE 20th International Conference on Intelligent Transportation Systems (ITSC), 1–6. https://doi.org/10.1109/ITSC .2017.8317847 Cheng, Z.-J., Jeng, L.-W., & Li, K. (2018). Behavioral Classification of Drivers for Driving Efficiency Related ADAS Using Artificial Neural Network. 2018 IEEE International Conference on Advanced Manufacturing (ICAM), 173–176. https: //doi.org/10.1109/AMCON.2018.8614836 Corti, A., Ongini, C., Tanelli, M., & Savaresi, S. M. (2013). Quantitative Driving
Style Estimation for Energy-Oriented Applications in Road Vehicles. 2013 IEEE International Conference on Systems, Man, and Cybernetics, 3710–3715. https: //doi.org/10.1109/SMC.2013.632 Dorr, D., Grabengiesser, D., & Gauterin, F. (2014). Online driving style recognition using fuzzy logic. 17th International IEEE Conference on Intelligent Transportation Systems (ITSC), 1021–1026. https://doi.org/10.1109/ITSC.2014. 6957822 Fazeen, M., Gozick, B., Dantu, R., Bhukhiya, M., & González, M. C. (2012). Safe Driving Using Mobile Phones. IEEE Transactions on Intelligent Transportation Systems, 13(3), 1462–1468. https://doi.org/10.1109/TITS.2012.2187640 Huang, X., Tan, Y., & He, X. (2011). An Intelligent Multifeature Statistical
Approach for the Discrimination of Driving Conditions of a Hybrid Electric Vehicle. IEEE Transactions on Intelligent Transportation Systems, 12(2), 453–465. IEEE Transactions on Intelligent Transportation Systems. https://doi.org/10.1109/ TITS.2010.2093129 INDOT. (2022, October 19). Work Zone Safety. INDOT. https://www.in.gov/indot/s afety/work-zone-safety/ Kaplan, S., Guvensan, M. A., Yavuz, A. G., & Karalurt, Y. (2015). Driver
Behavior Analysis for Safe Driving: A Survey. IEEE Transactions on Intelligent
Exploring Driving Style Variations When Driving in Work Zone 2085
Transportation Systems, 16(6), 3017–3032. IEEE Transactions on Intelligent Transportation Systems. https://doi.org/10.1109/TITS.2015.2462084 Li, P., Shi, J., & Liu, X. (2017). Driving Style Recognition Based on Driver Behavior Questionnaire. Open Journal of Applied Sciences, 07(04), 115–128. https://doi.or g/10.4236/ojapps.2017.74010 Lu, L., Sheng, Y., Song, C., Li, Y., & Guo, Z. (2021). Driving Safety Assurance
Method in Work Zone Crossovers of Highway Reconstruction and Expansion Project. Journal of Advanced Transportation, 2021, 1–12. https://doi.org/10. 1155/2021/5708779 Mantouka, E. G., Barmpounakis, E. N., & Vlahogianni, E. I. (2019). Identifying driving safety profiles from smartphone data using unsupervised learning. Safety Science, 119, 84–90. https://doi.org/10.1016/j.ssci.2019.01.025 Marina Martinez, C., Heucke, M., Wang, F.-Y., Gao, B., & Cao, D. (2018). Driving
Style Recognition for Intelligent Vehicle Control and Advanced Driver Assistance: A Survey. IEEE Transactions on Intelligent Transportation Systems, 19(3), 666– 676. https://doi.org/10.1109/TITS.2017.2706978 Mei, P., Karimi, H. R., Huang, C., Yang, S., & Chen, F. (2023). A Learning-Based Driving Style Classification Approach for Intelligent Vehicles. In H. R. Karimi & N. Wang (Eds.), Sensor Systems and Software (Vol. 487, pp. 179–190). Springer Nature Switzerland. https://doi.org/10.1007/978-3-031-34899-0_12 Meseguer, J. E., Calafate, C. T., Cano, J. C., & Manzoni, P. (2013). DrivingStyles:
A smartphone application to assess driver behavior. 2013 IEEE Symposium on Computers and Communications (ISCC), 000535–000540. https://doi.org/10. 1109/ISCC.2013.6755001 Mohammadnazar, A., Arvin, R., & Khattak, A. J. (2021). Classifying travelers’ driving style using basic safety messages generated by connected vehicles: Application of unsupervised machine learning. Transportation Research Part C: Emerging Technologies, 122, 102917. https://doi.org/10.1016/j.trc.2020.102917 Murphey, Y. L., Milton, R., & Kiliaris, L. (2009). Driver’s style classification using
jerk analysis. 2009 IEEE Workshop on Computational Intelligence in Vehicles and Vehicular Systems, 23–28. https://doi.org/10.1109/CIVVS.2009.4938719 Sagberg, F., Selpi, Bianchi Piccinini, G. F., & Engström, J. (2015). A Review of Research on Driving Styles and Road Safety. Human Factors: The Journal of the Human Factors and Ergonomics Society, 57(7), 1248–1275. https://doi.org/10. 1177/0018720815591313 Shi, B., Xu, L., Hu, J., Tang, Y., Jiang, H., Meng, W., & Liu, H. (2015). Evaluating
Driving Styles by Normalizing Driving Behavior Based on Personalized Driver Modeling. IEEE Transactions on Systems, Man, and Cybernetics: Systems, 45(12), 1502–1508. https://doi.org/10.1109/TSMC.2015.2417837 Silva, I., & Eugenio Naranjo, J. (2020). A Systematic Methodology to Evaluate Prediction Models for Driving Style Classification. Sensors, 20(6), 1692. https: //doi.org/10.3390/s20061692 Useche, S. A., Cendales, B., Alonso, F., Pastor, J. C., & Montoro, L. (2019). Validation
of the Multidimensional Driving Style Inventory (MDSI) in professional drivers: How does it work in transportation workers? Transportation Research Part F: Traffic Psychology and Behaviour, 67, 155–163. https://doi.org/10.1016/j.trf. 2019.10.012 Wang, W., & Xi, J. (2016). A Rapid Pattern-Recognition Method for Driving Types Using Clustering-Based Support Vector Machines. 2016 American Control Conference (ACC), 5270–5275. https://doi.org/10.1109/ACC.2016.7526495
Wang, W., Xi, J., Chong, A., & Li, L. (2017). Driving Style Classification Using a Semisupervised Support Vector Machine. IEEE Transactions on Human-Machine Systems, 47(5), 650–660. https://doi.org/10.1109/THMS.2017.2736948 Wijnands, J. S., Thompson, J., Aschwanden, G. D. P. A., & Stevenson, M. (2018).
Identifying behavioural change among drivers using Long Short-Term Memory recurrent neural networks. Transportation Research Part F: Traffic Psychology and Behaviour, 53, 34–49. https://doi.org/10.1016/j.trf.2017.12.006 Wu, H., Chen, Y., Zhang, J., & Jenkins, J. L. (2024). Key Factors and Representative Scenarios in Work Zone Safety: Indiana Crash Data Analysis. EPiC Series in Built Environment, 5, 939–947. https://doi.org/10.29007/pggc Xu, X., Zhang, Q., Mao, Y., Cheng, Z., & Ma, L. (2023). Consistency Analysis of
Driving Style Classification Based on Subjective Evaluation and Objective Driving Behavior. In H. Krömker (Ed.), HCI in Mobility, Transport, and Automotive Systems (Vol. 14049, pp. 58–71). Springer Nature Switzerland. https://doi.org/ 10.1007/978-3-031-35908-8_5 Yang, H., Ozbay, K., Ozturk, O., & Xie, K. (2015). Work Zone Safety Analysis and Modeling: A State-of-the-Art Review. Traffic Injury Prevention, 16(4), 387–396. https://doi.org/10.1080/15389588.2014.948615
LISTED IN THE AHFE DIGITAL BOOKSTORE CATALOGUE
Explore the complete digital volume
Human Factors in Design, Engineering, and Computing
Read this individual research paper free through the original publisher, or explore the full digital proceedings book.
ISBN 978-1-964867-35-9
Explore this ISBN in the AHFE Bookstore ↗Listed in the July 2026 bookstore catalogue; search by ISBN to confirm current availability · Digital book purchase optional