Li Jie Zeng, Xin Hu (2024). Interaction design of youth community in the context of service design. In: Human Factors in Design, Engineering, and Computing. AHFE Open Access, vol. 159, pp. 349–358. https://doi.org/10.54941/ahfe1005600
With the development of urbanization, more and more young people are pouring into first-tier cities, but the existing youth communities started late and are not perfect and cannot adapt well to the physical and mental demands of the current young groups. Therefore, starting from the Start with the concept transformation of youth apartments into youth communities, this paper studies the development and design of youth communities based on service design according to the needs and preferences of youth groups and combined with the challenges and opportunities of the development of the times, in order to improve the living conditions of urban youth groups. Through the investigation of the current working and living status of young people, the living needs of young residents are summarized by user interviews and questionnaires. Through the Kano model, the living, living, social, psychological and health needs of young people are prioritized, and the service blueprint is used to build a youth community service system. According to the living needs of urban youth, a community that meets the needs of urban youth is established. The Kano model can effectively analyze the functional demand priorities of community residents for the community. Combining offline and online scenarios, according to the service design concept, the design strategy analysis and design practice of the youth community system are completed, providing convenient, fast and comfortable community services for urban youth, and enhancing the happiness and sense of belonging of urban youth.
Cities have become the areas with the most concentrated and most active youth population. According to the data of the seventh national census, the urbanization rate of the permanent youth population in my country reached 71.1%. This data shows that cities are increasingly attractive to young people, especially megacities such as Beijing, Shanghai, Guangzhou, and Shenzhen. Taking Shenzhen as an example, the permanent population of young people aged 14 to 35 reached 8.019 million, accounting for 45.66% of the city’s permanent population. Youth is a key force in the process of urban modernization. The concentration of young people in cities not only reflects the attractiveness of cities to young people, but also reflects the importance of youth to urban development. Cities attract a large number of young talents by providing a good living and development environment, but also face the challenge of how to better serve young people and promote their development.
The conference commemorating the 100th anniversary of the May Fourth Movement pointed out that “efforts should be made to create good development conditions for young people, so that they can feel that care is around them and care is in front of them”. The 2023 government work report also clearly stated that “it is necessary to strengthen the construction of the housing security system, support rigid and improved housing needs, and solve the housing problems of new citizens, young people, etc.” Youth housing directly affects the sense of security, belonging, gain, and happiness of young people in urban life. It is an important issue to promote the high- quality development of cities, and it is also related to the long-term stability of the country and society (Editorial Department of this Journal 2023). In recent years, various places have carried out the construction of youth development cities, and created a series of measures in the field of youth housing, such as talent apartments, youth hostels, and affordable rental housing.
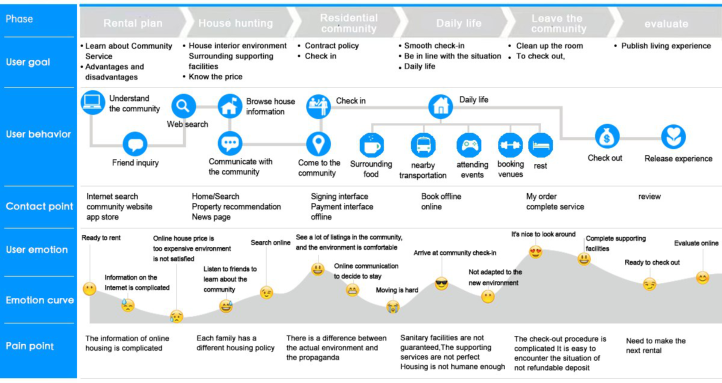
YOUTH COMMUNITY SERVICE FLOWCHART The following will use the service user journey map in service design to visualize the user life process of the youth community. This map can be said to be one of the most widely used methods in service design. It can visualize the relevant information of youth community users in their daily life in the community, clearly reproduce the problem in the form of a chart, and more intuitively analyze the user behavior, service touchpoints, and design pain points of community residents before, during, and after their stay, and then determine the design opportunities, providing a basis for further research.
Figure 1: User journey map of the youth community (drawn by the author, 2024).
Interaction Design of Youth Community in the Context of Service Design 351
KANO MODEL OVERVIEW The Kano model is a qualitative analysis tool proposed by Japanese scholar Noriaki Kano. It can understand user needs through questionnaires and rank them in order of importance (Zhengang, 2022). The Kano model can help designers understand customer service and improve user satisfaction with the product based on user needs. Based on the principle of Professor Noriaki Kano’s KANO model, we can divide service needs into positive and negative questions and distinguish them by having and not having them. And set five options: “I am very satisfied”, “As it should be”, “It doesn’t matter”, “Reluctantly accept”, and “I don’t like it very much”. Classify service quality characteristics according to the answers to positive and negative questions (as shown in Table 1).
Table 1. Kano questionnaire format (author, 2024).
Table available in the original PDF paper.
Problem Setting Question Answer Positive Questions How do you feel when a product has a certain function?
Reverse Problem
“I am very satisfied”, “As it should be”, “It doesn’t matter”, “Reluctantly accept”, “I really don’t like it”
“I am very satisfied”, “As it should be”, “It doesn’t matter”, “Reluctantly accept”, “I really don’t like it” How do you feel when a product doesn’t have a certain feature?
Based on the user’s satisfaction with the product or service, the model divides the demand into five categories: Must-have attributes (M), Attractive attributes (A), Expected attributes (O), Indifferent attributes (I), Reverse attributes (R). Among them, user satisfaction will be improved if attractive demands are met, and user satisfaction will not be affected if attractive demands are not provided; whether or not indifferent demands are provided does not affect user satisfaction; Reverse demands are not user demand attributes, and providing them will affect the product experience (Pan Qiucen, 2016). When classifying, first refer to the KANO two-dimensional attribute classification matrix table (as shown in Table 2), summarize the answers to each question in the questionnaire, and select the maximum value, that is, which type of attribute of each demand in the KANO model is the most, to classify the product demand.
Question Reverse Problem I am very satisfied As it should be It doesn’t matter
Reluctantly accept
I don’t like it very much
Positive Questions
R R R R Q
I am very satisfied Q A A A O As it should be R I I I M It doesn’t matter R I I I M Reluctantly accept R I I I M I don’t like it very much
352 Lijie and Xin
These five categories help designers understand the impact of user needs on satisfaction, thereby optimizing product design and service strategies. Zhang Ningning effectively analyzed the priority of community residents’ functional needs for physical examination cabins through the Kano model and completed the design of the community health examination system. Xiao Zhen used the Kano model to classify and sort user demand attributes and explored the design strategy for the Qinhuai Lantern Festival Intangible Cultural Heritage Tourism Service System. This article will also analyze the priority of youth community users’ needs for community services through the Kano model, thereby providing theoretical support for the creation of youth communities.
SURVEY DESIGN In this study, the questionnaire design mainly includes two parts. The first part is demographic characteristics, including gender, age, occupation, housing budget, and cities with housing experience. The second part is the kano questionnaire, which is designed from five service types.
DATA SAMPLING After the questionnaire was designed by WJX, it was distributed on the online platform. The distribution time was from July 15, 2024 to July 27, 2024. A total of 123 questionnaires were collected. After eliminating 16 invalid and suspicious questionnaires, 107 valid questionnaires were obtained, and the questionnaire efficiency was 86.99%.
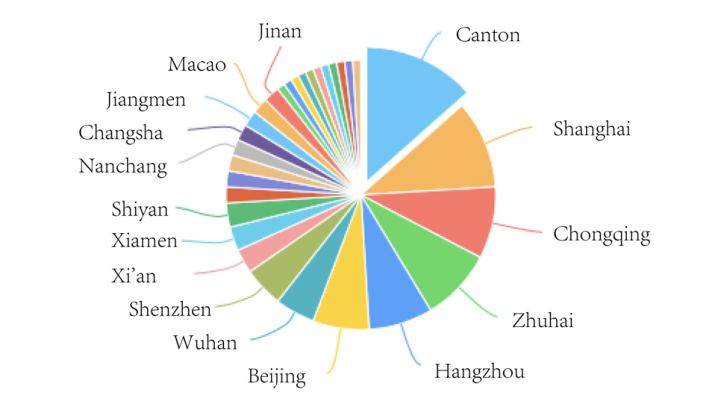
DESCRIPTIVE ANALYSIS In terms of gender, there are 61 females and 46 males in this questionnaire, accounting for 57% and 43% respectively, and the number of females is slightly higher than that of males. In terms of age, there are 3 people under 18 years old, accounting for 2.8%, 74 people aged 18 to 25, accounting for 69.16%, 29 people aged 26 to 35, accounting for 27.1%, and one person aged 35 or above, accounting for 0.93%. From the age, we can see that the number of people aged between 18 and 35 in this questionnaire is as high as 96%, which is very consistent with the target group of this study. In terms of occupation, students and company employees have the largest number of people, with 58 students accounting for 54% and 33 company employees accounting for 30.8%. Among the other occupations, there is 1 self-employed person, accounting for 0.93%, 5 freelancers, accounting for 4.67%, 3 teachers, accounting for 2.8%, and 7 party and government officials, accounting for 6.54%. In terms of housing budget, 24 people accounted for 22.43% of the total, 62 people accounted for 57.94% of the total, 12 people accounted for 11.21% of the total, and 9 people accounted for 8.41% of the total. In terms of cities with rental experience, Guangzhou, Shanghai, and Chongqing accounted for 14, 11, and 9 people, respectively. The following pie chart was drawn based on the data of cities with rental experience in the questionnaire (see Figure 2).
Interaction Design of Youth Community in the Context of Service Design 353
Figure 2: Pie chart of rental city distribution data (drawn by the author, 2024).
USER NEEDS ANALYSIS OF KANO MODEL The questionnaire design refers to the research on the current housing supply and demand status of newly employed college students in Xu Jufen paper (Xu Jufen, 2014), explores the needs of young community residents for community services, preliminarily draws up a youth service project library, and summarizes, classifies, and numbered the projects to facilitate the design of the KANO questionnaire (see Table 3).
Table 3. Youth community service primary entry pool (author, 2024).
Table available in the original PDF paper.
Service Type Serial Number Service Terms Residential services A1 Housing price A2 Flexible housing lease A3 Comfortable environment A4 Security system A5 Cleaning service Domestic services A6 Canteen, cafe, supermarket and convenience store A7 Reading room, gym, activity center A8 Outdoor sports field A9 Outdoor activity green space A10 Convenient transportation A11 Intelligent management system Social Services A12 Technical training services A13 Youth talent market services A14 Cultural and sports activities A15 Public welfare services Psychological services A16 regular psychological counseling services Health Services A17 Medical services A18 Chronic disease prevention and treatment services A19 Physical health management A20 Massage and acupuncture services
354 Lijie and Xin
KANO QUESTIONNAIRE AND DATA ANALYSIS In order to test the validity and usability of the data collected by the questionnaire for this study, I imported all the data into SPSS software to test the reliability and validity of the data. The Cronbach’s alpha values of forward questions, reverse questions, and questionnaires are 0.93, 0.86, and 0.83 respectively (see Table 4). The credibility is greater than 0.8, which proves that the collected data has good credibility. The significance of Bartlett’s sphericity test of the questionnaire is 0.000<0.1, indicating that the validity of the questionnaire is good. The KMO value of the questionnaire is 0.748, ranging from 0.7 to 0.8. The above data shows that this questionnaire has good reliability and validity and can be analyzed in the next step.
Scale Cronbach’a Number of Items Overall questionnaire 0.82 44 Forward questions 0.93 20 Reverse questions 0.86 20
Then, the attributes of youth community service needs were classified according to the Kano questionnaire comparison table, and the specific functional demand coefficients were obtained through Better-Worse calculations, which were organized into the following table (see Table 5).
Table 5. Kano questionnaire (author, 2024).
Table available in the original PDF paper.
Number M O A I R Type Better Worse A1 33.33% 19.79% 19.79% 26.04% 1.04% M 40% –53.68% A2 14.58% 27.08% 33.33% 23.96% 1.04% A 61.05% –42.11% A3 26.04% 41.67% 21.88% 10.42% 0% O 63.54% –67.71% A4 25% 44.79% 17.71% 10.42% 2.08% O 63.83% –71.28% A5 9.38% 22.92% 47.92% 19.79% 0% A 70.83% –32.29% A6 9.38% 23.96% 48.96% 17.71% 0% A 72.92% –33.33% A7 3.13% 9.38% 60.42% 25% 2.08% A 71.28% –12.77% A8 6.25% 12.50% 51.04% 30.21% 0% A 63.54% –18.75% A9 11.46% 21.88% 55.21% 9.38% 2.08% A 78.72% –34.04% A10 19.79% 50% 19.79% 9.38% 1.04% O 70.53% –70.53% A11 9.38% 8.33% 62.50% 19.79% 0% A 70.83% –17.71% A12 5.21% 5.21% 45.83% 42.71% 1.04% A 51.58% –10.53% A13 4.17% 10.42% 58.33% 26.04% 1.04% A 69.47% –14.74% A14 1.04% 2.08% 56.25% 37.50% 3.13% A 60.22% –3.23% A15 3.13% 6.25% 50% 39.58% 1.04% A 56.84% –9.47% A16 4.17% 1.04% 57.29% 34.38% 3.13% A 60.22% –5.38% A17 11.46% 29.17% 45.83% 12.50% 1.04% A 75.79% –41.05% A18 3.13% 16.67% 65.63% 14.58% 0% A 82.29% –19.79% A19 4.17% 15.63% 58.33% 21.88% 0% A 73.96% –19.79% A20 3.13% 10.42% 63.54% 20.83% 2.08% A 75.53% –13.83%
Interaction Design of Youth Community in the Context of Service Design 355
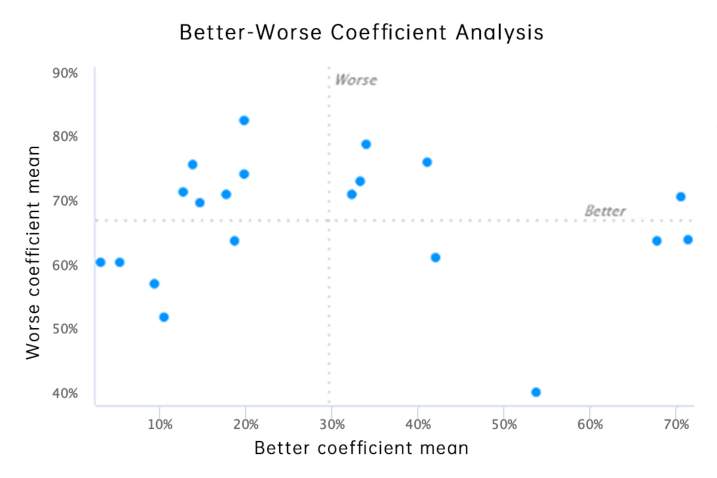
KANO MODEL QUADRANT DIAGRAM ANALYSIS Draw a scatter plot based on the absolute values of the Better coefficient and Worse coefficient of the service, and divide the quadrants according to the average values of all services (see Figure 3). With Worse value as the horizontal axis and Better value as the vertical axis, the first quadrant is the expected attribute, the second quadrant is the attractive attribute, the third quadrant is the indifferent attribute, and the fourth quadrant is the necessary attribute. The attributes of the youth community service project can be intuitively seen through the quadrant distribution chart.
Located in the first quadrant are the expected attributes, with high Better values and high absolute Worse values. The demand attributes in this quadrant should be met first. Located in the second quadrant are the attractive attributes, with high Better values and low absolute Worse values. The services in this quadrant should be met as much as possible, and providing this type of service can improve user satisfaction. The third quadrant is the indifferent attribute, with low Better value and low absolute Worse value. The indifferent attribute means that there is no obvious difference in user satisfaction whether it is provided or not, so this type of service can usually be not provided. The fourth quadrant is the essential attributes, with a low Better value and a high Worse value. Services with essential attributes must be met. If they are not met, the satisfaction level will drop significantly. Based on the above, we can know that in terms of the priority of providing functional attributes, essential attributes are usually given priority, followed by expected attributes, and then attractive attributes, and finally indifferent attributes.
According to the above data, we can see that the service needs of youth communities can be roughly divided into three categories.
Necessary needs: reasonably priced housing. For young people who have just entered society, economic problems are the primary problem faced by young people. Young people are separated from their families and lack social experience. This leads to the fact that young people are relatively tight in terms of finances, so this requires that youth communities must have reasonably priced housing to meet the daily housing needs of young people and enable young people to afford the necessary expenses of community life.
Expected needs: convenient transportation, professional and sound security system, and comfortable housing environment. According to the attribute classification of the Kano model questionnaire results, it can be known that the charm demand refers to the Dangdang community providing this type of service, which can improve the satisfaction of community residents. When the community cannot provide this type of service, the satisfaction will drop significantly. According to the existing youth community survey, we know that the existing youth community does not meet the expected needs of young residents very well. Usually because of price issues, this year’s community often does not have a comfortable housing environment, the geographical location is relatively remote, and the security system is not valued by the youth community.
356 Lijie and Xin
Figure 3: Scatter plot of absolute values of better coefficient and worse coefficient (drawn by the author, 2024).
Charm demand: According to the questionnaire, except for the above services, the rest of the services are charm demand. When the community does not have this type of demand, the user’s satisfaction will not be significantly affected, but when the community has the following needs, the user’s satisfaction will increase significantly. In order of importance, they are chronic disease prevention and treatment services, outdoor green space, medical services, acupuncture and massage services, physical health management services, the community has canteens, cafes, supermarkets and convenience stores, the community has reading rooms, gyms and activity centers, regular sanitation and cleaning services, intelligent management systems, talent market services, outdoor activity venues, flexible housing leases, psychological counseling services, organization of cultural and sports activities, organization of public welfare activities, and technical training services. Based on the above, we can know that for young people, the more types of community services there are, the higher their satisfaction with the community.
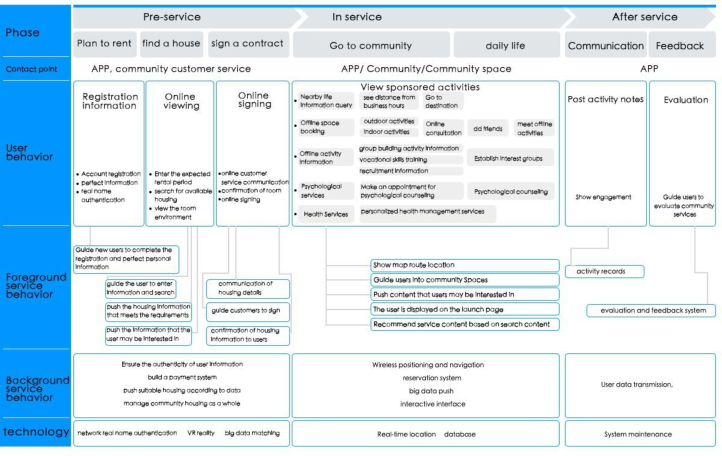
YOUTH COMMUNITY SERVICE BLUEPRINT Service Blueprint can visualize the relevant elements in service design (Kimbell, 2011). According to the user needs of the youth community residents, this community should use a design form that combines online and offline. By sorting out the touch points, interaction points, front-end and back-end, system and other service elements of community users when receiving services (Lin Nan, 2022), the community service can be improved
Interaction Design of Youth Community in the Context of Service Design 357
through the user service blueprint, thereby improving the satisfaction of community residents and the quality of service (see Figure 4).
Figure 4: Youth community service blueprint (drawn by the author, 2024).
With the increase in urban youth’s demand for housing, the youth community industry has also developed. In order to better serve the youth group, we must keep abreast of the needs and psychological changes of the urban youth group. At present, there is still room for improvement in the standardization of youth community construction, standardized management, and service level (Huang Li, 2020). This article puts forward several opinions and suggestions to further optimize services, strengthen management, and promote youth communities to be standardized, humanized, and digitalized.
Implement necessary needs and ensure the housing needs of young people.For young people who are in the development stage, housing prices are their focus. Only housing with appropriate prices can meet the housing requirements of young people (Li Wanying, 2015).
Improve expected attributes and increase services for young people.As the expected attributes in the model, youth communities should have convenient transportation, comfortable housing environment, and reassuring security systems that can bring convenience to young people’s lives while reducing their dissatisfaction.
Create unique special services based on charm attributes.The KANO model shows us that personalized special services are the quality attributes that can most impress customers and bring surprises to customers, so they are classified as charm needs. According to the survey on youth service needs, we can consider meeting the life needs of young people by increasing services
358 Lijie and Xin
such as chronic disease prevention and treatment, outdoor green spaces, acupuncture and massage.
CONCLUSION
This study takes the urban youth community as the starting point and studies the service needs of the youth group for the youth community. The article sorts out the residents’ physical examination service touchpoints and opportunity points, and uses the KANO model to construct a standardized scale based on the design service needs of urban youth. The service needs of the youth community are determined according to the results. It brings thoughts to the subsequent construction of youth communities, promotes the development and innovation of youth communities, and also hopes to attract the attention of relevant scholars to other needs of young people, improve the quality of life of urban youth groups, and promote the harmonious development of society. However, there are also some shortcomings, such as: the number of people in the surveyed group during the research process is small, and the data obtained has certain limitations.
REFERENCES
Editorial Department of this Journal. (2023). Voices from the Two Sessions: 2023 Real Estate Keywords. Urban Development. Huang Li, Yu Yating, Fu Liping, Yu Jiao, Zhang Lei & Wen Yan. (2020). Research
on service improvement strategies for elderly apartments based on KANO model analysis. Journal of Panzhihua University (03), 58–63. Kimbell, L. (2011). Designing for service as one way of designing services. International journal of design, 5(2). Lin Nan. (2022). Research on the service design of the mutual living center of youth talent apartments based on the co-living model (Master’s thesis, China Academy of Art). Li Wanying. (2015). Analysis of the impact of youth groups on social stability
during China’s transition period and countermeasures (Master’s thesis, Taiyuan University of Technology). Pan Qiucen, Zhang Lixin, Zhang Chao & Li Haiqing. (2016). Kano model evaluation of academic journal website functional service requirements. Chinese Journal of Science and Technology Research (06), 617–623. Qiucen, P. A. N. (2016). Research on the User Experience Elements of Academic. Xu Jufen, Hu Yue & Zhu Jie. (2014). Research on the current situation and
characteristics of housing supply and demand for newly employed college students: A survey based on Nanjing. Modern Urban Studies (10). Zhengang, Z., Taiye, L. (2022). Product demand analysis based on online review data mining and Kano model. Management Review, 34(11), 109.
LISTED IN THE AHFE DIGITAL BOOKSTORE CATALOGUE
Explore the complete digital volume
Human Factors in Design, Engineering, and Computing
Read this individual research paper free through the original publisher, or explore the full digital proceedings book.
ISBN 978-1-964867-35-9
Explore this ISBN in the AHFE Bookstore ↗Listed in the July 2026 bookstore catalogue; search by ISBN to confirm current availability · Digital book purchase optional