Harald Devriendt, Mathieu Sarrazin, Thomas D'hondt, Konstantinos Gkentsidis, Karl Janssens (2025). A Multimodal Sensor Setup for In Situ Comparison of Driving Dynamics, Physiological Responses and Passenger Comfort in Autonomous Vehicles. In: Intelligent Human Systems Integration (IHSI 2025): Integrating People and Intelligent Systems. AHFE Open Access, vol. 160, pp. 475–485. https://doi.org/10.54941/ahfe1005852
With the growing integration of automated driving (AD) functions in passenger vehicles, it is essential to focus not only on safety but also on passenger comfort which is often overlooked in the design process. Integrating this in the design cycle requires a thorough understanding of the relation between objective metrics and the subjective passenger response. This paper introduces a novel multimodal measurement platform for efficient measurement of objective metrics and subjective comfort in a representative AD setting. The platform, built on a commercially available electric vehicle, contains sensors to concurrently capture data on vehicle dynamics, environmental conditions, and passenger physiological responses. An automated data processing pipeline has been developed to compute and visualize metrics related to both vehicle performance and passenger comfort. The platform has been utilized in a proving ground jury test, with preliminary qualitative analyses identifying potential comfort-related indicators, such as Time-to-Collision and Galvanic Skin Response. The platform and its processing pipeline will be the basis for further investigation into objective-subjective comfort correlation and prediction in the future.
As the automotive industry moves toward fully autonomous vehicles (AVs), it is essential to consider not only vehicle safety but also passenger comfort. Safety considerations establish the functional boundaries within which passenger comfort should be ensured. This is crucial for customer acceptance of AVs, which remains hesitant (Deichmann et al., 2023). Consequently, incorporating passenger comfort prediction early in the design process can significantly reduce development times.
A key concept in this context is the definition of the term ‘comfort’. Various interpretations exist, often specific to particular applications. In a review study, De Looze et al. (2003) identified three common aspects of comfort: i) it is subjective and may vary among individuals, ii) experiencing comfort is
always a reaction and iii) it can be influenced by external factors. In addition to defining comfort precisely, other research explores the relation between comfort and discomfort and whether these exist on the same continuum (e.g., Peng et al., 2024).
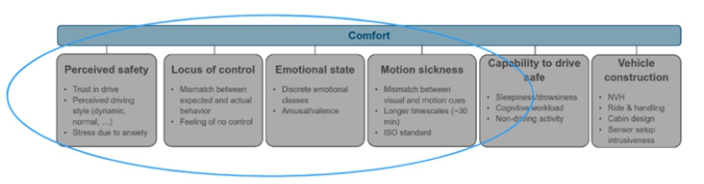
Given that comfort is dependent on the specific setting, it is essential to explore this concept within the context of (autonomous) driving. Traditionally, the focus has been on ride comfort which considers design aspects such as suspension, tires and seat ergonomics (Deubel et al., 2023). However, more general approaches to comfort in AD have emerged in recent studies (Peng et al., 2024), (Telpaz et al., 2018), (Su et al., 2021). Other recent research has focused on specific subdimensions of comfort, including motion sickness (Irmak et al., 2022), loss of control and predictability (Ekman et al., 2017, Bellem et al., 2017), trust (Giron et al., 2024) and anxiety (Dillen et al., 2020). In this work, an expert panel discussed the previously proposed definitions and subdimensions of comfort in AD and identified the most relevant ones for the current study (see Figure 1). Additionally, the decision was made to consider comfort and discomfort as two extremes on the same continuum.
Figure 1: Comfort subdimensions in AD. The key dimensions for this study are marked within the blue circle.
Several methods exist for assessing comfort. Often, questionnaires and intensity scales are used. A recent overview of their application in AV is provided by Peng (Peng, 2024). Efforts have been made to correlate this subjective response with objective measurements. Traditionally, the focus of these objective metrics has been on vehicle dynamics measurements, such as accelerations and jerks (e.g. Bellem et al., 2017). More recently, comfort has been correlated with environmental perception metrics, utilizing on-board or high-precision sensors such as cameras or LiDARs (e.g. Telpaz et al., 2018). Additionally, methods from psychobiology have been applied to assess passengers’ physiological and emotional state (Giron et al., 2024; Dillen et al., 2020). As the specific AV setting influences comfort, a realistic test setup is essential. Full AVs, as defined in SAE level 5 (SAE, 2014), are not yet commercially available nor legally permitted on public roads. Consequently, test setups often involve driving simulators (Bellem et al., 2017) or experimental AVs on a closed circuit (Dillen et al., 2020). Alternatively, expert drivers can operate a vehicle with a test participant in the passenger seat,
A Multimodal Sensor Setup for In Situ Comparison of Driving Dynamics 477
allowing for public road testing (Meng et al., 2024). In some instances, the driver is concealed from the test participant in a so-called Wizard-of-Oz setup (Telpaz et al., 2018). Test trajectories primarily focus on commonly occurring traffic scenarios rather than edge cases, as in the latter safety has priority over comfort.
In this work, a multimodal measurement platform is developed that integrates a variety of objective measurements with user comfort evaluations in an AV. This platform will be utilized to investigate potential correlations between objective metrics and passenger comfort, ultimately contributing to the development of a comfort prediction metric. First, an overview of the test platform and the processing pipeline is provided, followed by the design and initial results from a jury test. The findings of this research are summarized in the final section.
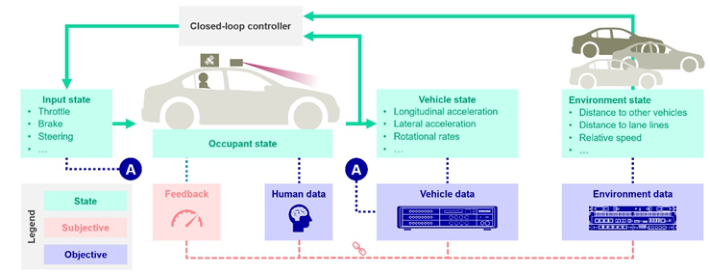
AV Test Platform An overview of the full measurement framework is presented in Figure 2. Data on vehicle dynamics, environmental conditions and human factors are collected along with passenger feedback on comfort and perceived safety. This information is integrated into the control loop to ensure that vehicle behaviour is perceived as comfortable and safe by the passenger.
Figure 2: Full measurement framework, including subjective, objective and state data.
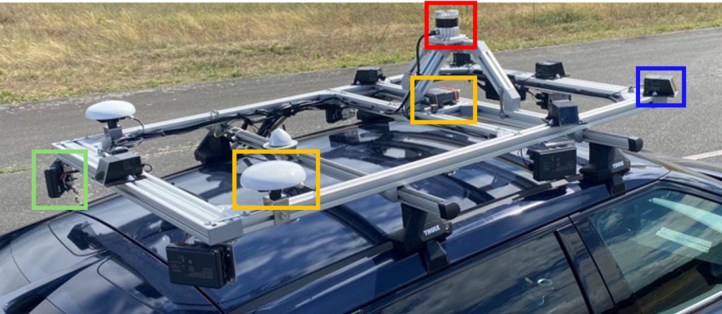
Test Vehicle A commercially available electric vehicle has been equipped with a roof rack to support sensors (see Figure 3) and a device rack in the trunk for auxiliary equipment. An opaque screen can be inserted between the driver and passenger if a Wizard-of-Oz setup is required.
Sensorization Comfort can be correlated with several types of objective measurements, including vehicle surroundings, dynamics and passenger physiology. The sensors utilized in this study for these various measurement types are summarized in Table 1.
Table 1. Sensor overview, transfer mode to logging device and timing pulse protocol used.
The vehicle surroundings are measured using a combination of various technologies. The sensors are strategically positioned to ensure a robust and accurate registration of the driving environment across a wide range of operational conditions.
Six cameras are installed on the roof rack (Figure 3), proving a 360 degrees field of view. Additionally, five radars are incorporated to improve speed estimation of any external moving object and to ensure robust measurements in limited visibility conditions. A spinning LiDAR generates a 3D representation of the environment, which is essential for 3D object detection and simultaneous localization and mapping (SLAM). For precise localization, a high-precision GPS device is also utilized.
Vehicle dynamics are captured using the internal IMU of the GPS, supplemented by two extra 3D accelerometers mounted on the roof rack and seat rail to enhance robustness and precision.
Figure 3: Roof rack detail. Indicated are one camera (blue), the LiDAR (red), one radar (green), the GPS device and one antenna (yellow).
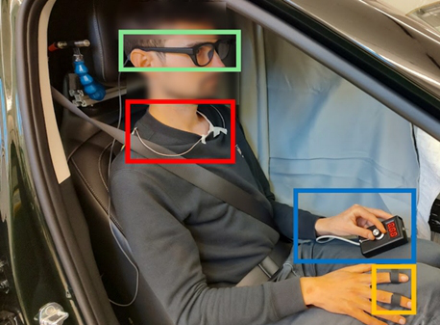
The passenger’s physiological state is characterized using three measurements (Figure 4). Electrocardiography (ECG) measures heart pulse, while Galvanic Skin Response (GSR) registers electric skin conductivity.
A Multimodal Sensor Setup for In Situ Comparison of Driving Dynamics 479
Additionally, an eye tracking device utilizes infra-red cameras to monitor pupil movement in combination with a forward-facing RGB camera to capture gaze direction. These measurements are selected based on their observed correlation with stress and arousal in previous studies (e.g. Giron et al., 2024; Dillen et al., 2020).
Subjective comfort is assessed in two ways. A hand-held dial knob is developed for the passenger to continuously rate their level of comfort during the drive (Figure 4). A ten-point scale is utilized, with ‘maximum discomfort’ and ‘maximum comfort’ representing the two extremes. Additionally, a post- drive questionnaire is created, containing questions specifically related to the comfort subdimensions of interest, as illustrated in Figure 1.
Figure 4: Passenger instrumentation, featuring eye tracker (green), ECG (red, actual sensors not visible), comfort rating dial knob (blue) and GSR (yellow).
The various data streams are captured using multiple data acquisition systems. This approach is necessary due to differences in sample rates, data volume and device-specific compatibility constraints (see Table 1 for an overview). The BPlus Data recorder BRICK manages and locally stores high-throughput digital data from the environmental sensors. Eye tracking images are transferred and stored onto a companion Android smartphone. In contrast, the Simcenter SCADAS and Mindmedia NeXus 10 middleware devices function as analog-to-digital signal converters, transferring their digitized output to a Windows 10 measurement laptop.
The measurements are time-synchronized in that all devices share a common time base, although not all measurements are triggered simultaneously. A grand master clock device uses GPS time as an input to orchestrate the various timing pulses, as not all devices accept the same synchronization protocol. Details are provided in Table 1.
DATA PROCESSING From the various measurements, a set of metrics proposed for comfort correlation is computed (see Table 2). Vehicle dynamics and physiological
data metrics can be derived directly from the raw sensor output. However, a perception pipeline is required for processing the environmental data. Further details are provided in the following paragraph.
Table 2. Computed metrics per measurement type. The time-aggregated computation used is indicated in brackets.
Table available in the original PDF paper.
Measurement type Computed metric
Distance from left and right lane
Vehicle dynamics Ego velocity (max, min) Longitudinal and lateral acceleration (max) Yaw rate (max) Lane detection (environmental) Longitudinal and lateral distance from target actor (min) Road curvature (max) Object detection (environmental)
Relative speed (max) Time-to-collision TTC (min, time-integrated, time-exposed) Time headway (min) Physiological data Total and phasic GSR (average, number of peaks) Heart rate (average) Heart rate variability (average RMSSD) Eye blink rate (average) Passenger feedback Comfort knob score (min)
Perception Pipeline In the first step of the perception pipeline, 3D object detection is performed using LiDAR data. Since no annotated data is available for this task, the unsupervised domain adaptation pipeline Multi-Source 3D by Tsai et al. (2023) is deployed. Models pretrained on a single publicly available dataset typically perform poorly on unseen target data; therefore, an ensemble of pretrained models from multiple publicly available datasets is utilized. The various 3D detection proposals generated by these models are fused using a Kernel Box Fusion (KBF) method, resulting in more accurate pseudo-labels. Subsequent refinement of the 3D object temporal trajectories is achieved with a SimpleTrack object tracker (Pang et al., 2021). Finally, the 3D tracked objects are fused with the object list from the radar sensors using proximity metrics to improve object speed estimation.
In parallel, camera data are used to detect lane lines and traffic signs/lights with a YOLOPv2 and YOLOv8 model, respectively.
MEASUREMENTS Study Design
A jury test is conducted at the Griesheim proving ground of the TU Darmstadt, involving 23 participants, all of whom are adults with valid
A Multimodal Sensor Setup for In Situ Comparison of Driving Dynamics 481
driving license. Care is taken to ensure a balanced representation of males and females, as well as diverse age groups and varying levels of technical experience.
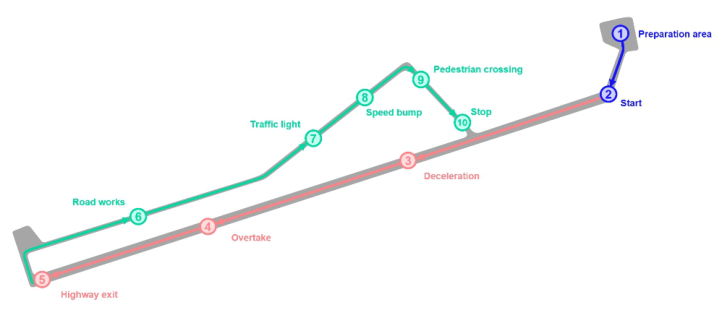
The test trajectory includes a series of traffic scenarios commonly encountered in urban or highway driving (e.g. Dillen et al., 2020; Bellem et al., 2018) as illustrated in Figure 5. These scenarios are recreated on a closed track to maximize repeatability and ensure the safety of the experiments. An expert driver is trained to navigate this track consistently in three different driving styles: defensive, normal and aggressive. Additionally, a second vehicle is manually driven using cruise control for the ‘deceleration’ and ‘overtake’ scenarios.
The course of the study is structured as follows: First, participants complete a questionnaire with questions on general demographics, driving experience and style, openness to new technologies, motion sickness sensitivity and current stress level. Next, participants take place in the passenger seat while three laps are driven, covering each driving style in random order. This test is then repeated in a different order using a Wizard-of-Oz setup. After each series of three laps, participants complete a questionnaire to evaluate various comfort subdimensions of interest. Motion sickness, stress, proximity to their own driving style and trust are rated on a 10-point scale. More general findings are reported using open-ended and multiple-choice questions.
Figure 5: Test track with designed scenarios for highway (red) and urban (orange) driving.
RESULTS
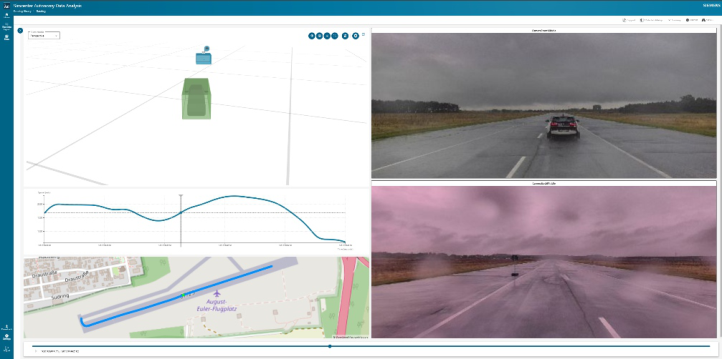
The outputs from the sensors and the perception pipeline as well as other processed parameters can be visualized together using Simcenter Autonomy Data Analysis solution (Figure 6). This capability facilitates visual inspection of all recorded signals and processed results, enabling user-based manual detection of events of interest.
Figure 6: Software prototype graphical interface displaying a pedestrian crossing scenario featuring camera visuals, speed profile, vehicle and human 3D boxes and accurate GPS localisation.
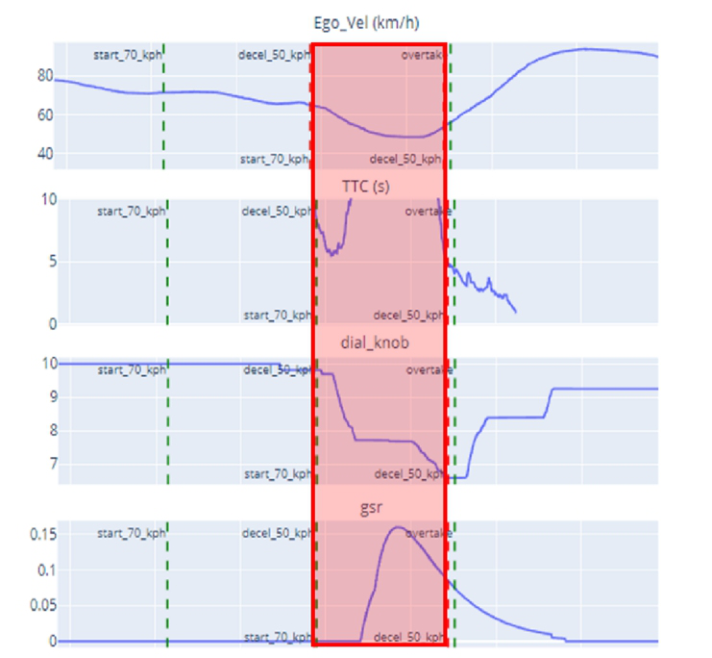
The time traces for all proposed metrics (recall Table 2) are collected in a single database. Since these share a synchronized time base, correlations and comparisons can be made at specific times, scenes or events. Figure 7 illustrates an example where time traces from vehicle, environmental, physiological, and subjective response data are plotted simultaneously. During the deceleration phase, the TTC shows a short decrease followed by an increase due to the relative velocity and distance to the target vehicle changing. Simultaneously, the comfort score decreases, and afterwards, the total GSR signal increases. This indicates a possible correlation between TTC, GSR and comfort, which has been observed in previous studies (Telpaz et al., 2018; Dillen et al., 2020; Giron et al., 2024). However, further analysis on a larger jury group is necessary to draw more general conclusions.
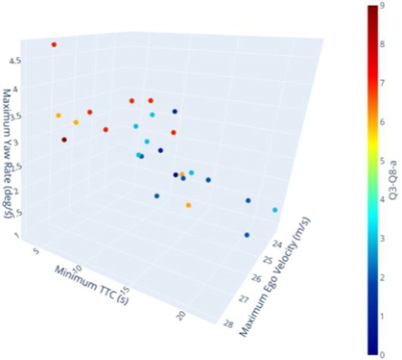
Alternatively, trends within the respondent group can be examined for metrics that are time-aggregated over an entire scenario or lap, as illustrated in Figure 8 for the overtaking scenario. In this example, a tendency of higher reported stress levels corresponding to lower TTC and higher maximum speed is observed. Notably, significant variation in responses across the group exists, indicating the need for more comprehensive statistical analysis.
The computed variables will be employed for a more rigorous objective- subjective correlation and the development of comfort metrics. Dedicated statistical analyses will be conducted to test for significant differences in responses or response groups across different driving styles. Furthermore, machine learning (ML) techniques will be utilized to classify scenario variables based on subjective reactions and to forecast subjective responses using only objective data.
A Multimodal Sensor Setup for In Situ Comparison of Driving Dynamics 483
Figure 7: Time-aligned metrics (top to bottom): ego vehicle velocity, TTC, subjective dial knob score and GSR. The red area indicates the time interval of the deceleration scenario.Figure 8: Scatter plot of aggregated parameters for overtaking scenario. The color bar indicates the passenger responses to the question. ‘What was the maximum level of stress encountered (0-10)?’
CONCLUSION
This paper presents a multimodal measurement platform developed for passenger comfort research in AVs. The platform integrates synchronized measurements of vehicle dynamics, environmental conditions, physiological responses, and subjective comfort assessments into a test vehicle. A data processing pipeline has been developed to transform all sensor data into a set of metrics proposed for comfort correlation studies. Qualitative analyses can be performed through a custom-built visual interface, while algorithmic data manipulation can be conducted on the comprehensive database of computed variables.
The platform has been deployed in a jury test conducted on a driving circuit featuring recreated traffic scenarios common in in urban or highway driving. Three different driving styles have been adopted by an expert driver. Qualitative analyses of the results demonstrate how the tool can be used to identify trends and relations among the proposed metrics. These findings serve as a foundation for further development of a more rigorous objective- subjective correlation tool, ultimately aiming to establish a comfort and perceived safety prediction metric.
ACKNOWLEDGMENT
This research is supported by VLAIO (Flanders Innovation & Entrepreneurship Agency) within the BECAREFUL (Belgium consortium for enhanced safety & comfort perception of future autonomous vehicles) project, no. HBC.2021.0939 and by the European Union’s Horizon Europe research and innovation program under grant agreement No. 101076754 – project AIthena.
REFERENCES
Bellem, H., Klüver, M., Schrauf, M., Schöner, H., Hecht, H., Krems, J. (2017).
Can we study autonomous driving comfort in moving-base driving simulators? A validation study. Human Factors, 59(3), 442–456. Bellem, H. (2018). Comfort in automated driving: analysis of driving style preference in automated driving. PhD thesis, Technische Universität Chemnitz. Deichmann, J., Ebel, E., Heineke, K., Heuss, R., Kellner, M. and Steiner, F. (2023)
Autonomous driving’s future: Convenient and connected. McKinsey Center for Future Mobility report. McKinsey & Company. De Looze, M. P., Kuijt-Evers, L. F. M., van Dieën, J. (2003). Sitting comfort and discomfort and the relationships with objective measures. Ergonomics, 46, 985–997. Deubel, C., Ernst, S., Prokop, G. (2023). Objective evaluation methods of vehicle
ride comfort – a literature review. Journal of Sound and Vibration, 548, 117515. Dillen, N., Ilievski, M., Law, E., Nacke, L., Czarnecki, K., Schneider, O. (2020). Keep calm and ride along: Passenger comfort and anxiety as physiological responses to autonomous driving styles. In Proceedings of the CHI Conference on Human Factors in Computing Systems, HI, USA. Ekman, F., Johansson, M., Bligård, L.-O., Karlsson, M., Strömberg, H. (2019).
Exploring automated vehicle driving styles as a source of trust information. Transportation research Part F: Traffic Psychology and Behaviour, 65, 268–279.
A Multimodal Sensor Setup for In Situ Comparison of Driving Dynamics 485
Giron, J., Sela, Y., Barenboim, L., Gilboa-Freedman, G., Amichai-Hamburger, Y.
(2024). Persona-PhysioSync AV: Personalized interaction through personality and physiology monitoring in autonomous vehicles. Sensors, 24, 1977. Irmak, T., Kotian, V., Happee, R., de Winkel, K., Pool, D. (2022). Amplitude and temporal dynamics of motion sickness. Frontiers in Systems Neuroscience, 16, 866503. Meng, H., Zhao, X., Chen, J., Wang, B., Yu, Z. (2024). Study on physiological
representation of passenger cognitive comfort: An example with overtaking scenarios. Transportation research Part F: Traffic Psychology and Behaviour, 102, 241–259. Pang Z., Li, Z., Wang, N. (2021). SimpleTrack: understanding and rethinking 3D multi-object tracking. ArXiv Computer Vision and Pattern Recognition, 2111.09621. Peng, C. (2024). Understanding and improving user comfort in automated driving.
PhD thesis, University of Leeds. Peng, C., Horn, S., Madigan, R., Marberger, C., Lee, J., D., Krems, J., Beggiato, M., Romano, R., Wei, C., Woolridge, E., Happee, R., Hagenzieker, M., Merat, N. (2024) Conceptualising user comfort in automated driving: findings from an expert group workshop. Transportation Research Interdisciplinary Perspectives, 24, 101070. SAE International (2014). Taxonomy and definitions for terms related to on-
road motor vehicle automated driving systems: Standard J3016. SAE website: https://www.sae.org/standards/content/j3016_201806/. Su, H., Jia, Y. (2021). Study of human comfort in autonomous vehicles using wearable sensors. IEEE Transactions on Intelligent Transportation Systems, 23(8), 11490–11504. Telpaz, A., Baltaxe, M., Hecht, R., Cohen-Lazry, G, Degani, A., Kamhi, G. (2018).
An approach for measurement of passenger comfort: real-time classification based on in-cabin and exterior data. In Proceedings of 21st International Conference on Intelligent Transportation Systems (ITSC), HI, USA. Tsai, D., Berrio, J., Shan, M., Nebot, E., Worrall, S. (2023). MS3D: Leveraging multiple detectors for unsupervised domain adaptation in 3D object detection. ArXiv Computer Vision and Pattern Recognition, 2304.02431.
LISTED IN THE AHFE DIGITAL BOOKSTORE CATALOGUE
Explore the complete digital volume
Intelligent Human Systems Integration (IHSI 2025): Integrating People and Intelligent Systems
Read this individual research paper free through the original publisher, or explore the full digital proceedings book.
ISBN 978-1-964867-36-6
Explore this ISBN in the AHFE Bookstore ↗Listed in the July 2026 bookstore catalogue; search by ISBN to confirm current availability · Digital book purchase optional