Xuanang Zhao, Wu Zhuoxun, Zhao Wenqi (2025). Cognitive workload among orthopaedic nurses during the morning rush hours: results from field survey and lab-simulated eye-tracking evaluation. In: Neuroergonomics and Cognitive Engineering. AHFE Open Access, vol. 167, pp. 44–53. https://doi.org/10.54941/ahfe1006126
This research sets out to analysis the effect of noise on cognition of nurses in morning shift by simulating eye tracking in laboratory. Background: National health center is planning to further improve the current patient safety management system in the next three years. A policy was made to primarily focusing on the continuous improvement of the system infrastructure by smoothing the working procedures and mechanisms and eliminating all related risk factors in the healthcare delivery system as well as enhancing the overall patient experience during this process. This project is in line with the National Health Commission's plan to keep patients safe by eliminating risk factors in healthcare delivery. Methods: Laboratory simulations were performed using the DG-3 eye tracker, in which blink rate and pupil area were used for cognitive analysis. Physiological indexes of nurses were collected by bracelet equipment. Python and MATLAB language used by researchers to analysis obtained data in lab. Results: Noise generally reduces workers' concentration; White noise in the environment can make workers resistant to complex noises. Conclusion: This study reveals the effect of noise on cognitive load, which has important significance for optimizing nursing operation and improving patient safety. This study has made a major breakthrough in the application of eye tracking technology in the assessment of cognitive load.
This research explores the cognitive workload of clinical nurses during morning rush hours. It focuses on orthopaedic nurses. The study is titled “Cognitive workload among orthopaedic nurses during the morning rush hours: results from field survey and lab-simulated eye-tracking evaluation.” It uses wearable sensors, such as a heart rate monitor, and noise surveys to see how environmental factors affect nursing operations. The research had two parts: field surveys at West China Hospital over two months and lab-based simulations. In the field surveys, we measured ambient noise during different shifts and used eye-tracking in a simulated hand-eye dexterity test to check nurses’ cognitive workload. We used Python and MATLAB to process and
Cognitive Workload Among Orthopaedic Nurses During the Morning Rush Hours 45
analyze data. The results show that noise usually lowers attention levels. But moderate noise with a secondary task can help people stay focused. This suggests that noise can influence cognitive workload and might help us improve nursing operations and patient safety.
Medical malpractices, such as misdiagnosis, missed diagnosis, and improper nursing infections, have big social and economic effects. In orthopaedics, common risks include healing dysfunction and errors in nursing operations (Ye et al., 2021). The heavy workload and complex environment of top-tier hospitals like West China Hospital (WCH) make it important to study nurses’ cognitive workload to reduce medical errors (Qian et al., 2014). This research looks at how nurses handle cognitive workload during morning rush hours to reduce these risks.
Morning rush hours at WCH have high noise and multitasking, which make cognitive workload more demanding. Nurses must care for patients and teach trainees, which adds more complexity (Cohen et al., 2017). Cognitive workload is hard to measure directly. Many ergonomic assessment methods, such as heuristic evaluation, checklists, and posture-focused approaches (Berlin & Adams, 2017), help spot workplace risks. But modern methods, just like eye-tracking technology, can provide more precise and quicker ways to measure cognitive workload, by analysis the eye movement of human.
Former research on ambient noise shows that moderate levels (around 70dB), may improve creativity and thinking by causing slight processing difficulty, while high levels (about 85dB) can harm cognitive performance (Mehta, Zhu, & Cheema, 2012). Our study wants to see how noise affects cognitive workload in a healthcare setting, which is not often studied. Eye- tracking technology has grown quickly and is used in psychology, education, and medicine. Studies show that higher cognitive demands link to changes in eye movement, such as blink rate and pupil size (Biondi et al., 2023). Our research uses eye-tracking to see how noise affects nurses’ cognitive workload in simulated tasks. Eye-tracking can show real-time data on attention, and it is more objective than self-reports (Biondi et al., 2023). If we use eye-tracking in ergonomic evaluations, we could design work environments that lower cognitive overload and improve safety and job performance.
Many studies focus on eye-tracking and cognitive workload, but fewer look at how noise affects cognition in healthcare. Biondi et al. (2023) found that manufacturing workers’ eye movements change when facing different cognitive demands. Our study is new because it uses eye-tracking to examine how noise affects nurses’ cognitive workload. This may guide future research in healthcare ergonomics.
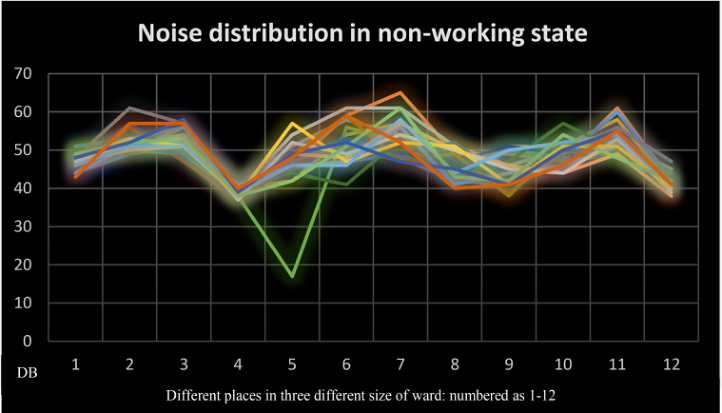
EXPERIMENT SETTING AND DATA COLLECTION This study focused on clinical nurses’ cognitive workload and how it is affected by ambient noise. To measure the workload directly, eye-tracking technology was used along with a field survey. Four nurses wore Huawei bracelets during their work shifts for one month to track their heart rate, pressure index, and blood oxygen saturation. The field survey gathered information about the hospital’s layout, architecture, and noise levels.
Figure 1: Noise distribution line comparison diagram.
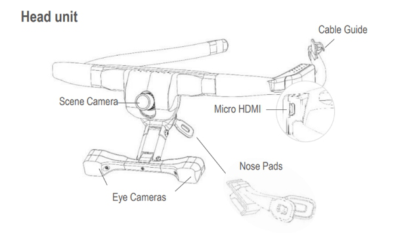
The basis and logic to using eye-tracking technology is that it can provide information about the eye structure and movement, such as the pupil, blinking, and focusing of the wearer very efficiently and accurately, and this information may directly reflect the current cognitive workload of the wearer. In our study, the DG-3 eye-tracking device was used to measure participant’s pupil size, eye fixation position, duration of eye fixation, blink duration, and blink frequency. These parameters served as a foundation for subsequent analyses aimed at quantifying the cognitive load experienced by subjects during operative tasks
The lab experiment used the O’Connor Finger Dexterity Test to measure cognitive pressure during tasks with different levels of difficulty. We used computation questions to give participants a certain amount of cognitive stress and were very much in line with what nurses would do in a real setting. They need to communicate with patients while performing operations, and our computational problems can simulate the real scenes that happen to
Cognitive Workload Among Orthopaedic Nurses During the Morning Rush Hours 47
them in the hospital, to obtain the most realistic data to analysis the factors that nurses may make mistakes. We focused on reproducing a room of orthopaedic department in our laboratory, and 1:1 reproduction of the procedures and equipment that nurses operate in the department. In this endeavour, we procured a medical trolley mirroring the dimensions and stature of those utilized at West China Hospital to replicate the dressing change and infusion operation. A corresponding script to simulate the conversational exchanges during the operation. To intensify the impact of infusion or dressing changes on the cognitive system, we integrated two hand dexterity test pads presenting a distinct level of complexity in two drawers of the trolley that we brought earlier. Employing a stochastic selection process, we analyze their cognitive performance at different levels of difficulty, especially when they are affected by noise.
Given that we obtained the ambient noise during the quiet period and the ambient noise during the non-quiet period of the hospital, we set up a control group and an experimental group of noise. The control group followed the noise level of the quiet period, while the experimental group performed the corresponding operation in a noisy environment. To refine our analysis of cognitive impact, we developed another control subsets and put them into our experiment. This group was given simple math problems (i.e., addition and subtraction of 2-digit numbers). We controlled the cognitive stress received by the participants during the operation by controlling whether or not the mental problem was given to them, which enabled us to evaluate their cognitive stress responses via eye-tracking technology, thereby quantifying the influence on cognitive performance. As a result, our experiment generated four distinct groups to evaluate the impact of noise and calculation problems. The four categories were: I. Control Group A: No ambient noise and no calculation tasks. II. Control Group B: Ambient noise present without calculation tasks. III. Experimental Group A: No ambient noise with calculation tasks. IV. Experimental Group B: Both ambient noise and calculation tasks.
DATA PROCESSING AND ANALYSIS Based on literature search and scientific evidence, an individual’s degree of fatigue or concentration may be reflected by the blink rate, that is, as the fatigue degree increases, the concentration degree decreases. We hypothesized that to increase concentration and maintain working performance, individuals may increase the frequency of blinking to relieve fatigue and to achieve the effect of refocusing the individual’s attention.
In the data obtained by the eye tracker, if the Boolean value of whether or not the gaze is true, it is considered that the volunteer’s gaze falls within the working area, and its visual field data is normal, so other data are usually reasonable. On this basis, the data used to determine whether the blink state is the height of the pupil and the width of the pupil. As the height and width of eyeballs are affected by the eye state of volunteers, all on the existence of such circumstances, the eyeball area is regarded as the product of eyeball width
and eyeball height, and during the experiment, if the product is significantly lower than a certain threshold, the volunteer is identified as blinking at that point in time. Therefore, to facilitate subsequent data analysis, this step will obtain the eye area of each volunteer during each unit time of time.
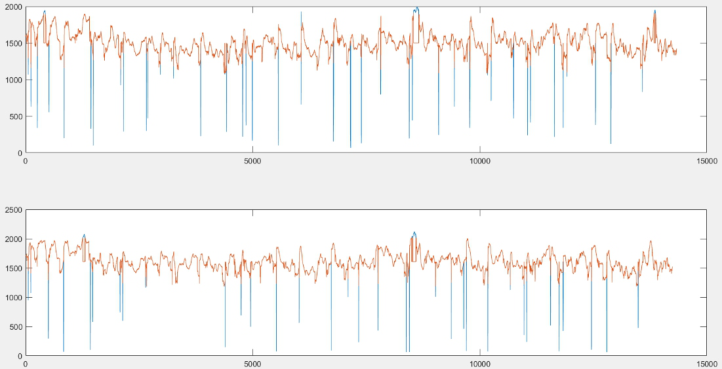
When a person blinks, the eyelid will drop at a very rapid rate and block the pupil, and the identifiable pupil area exposed will drop sharply. Therefore, compared to the pupil area data when the eye is open, the pupil area data when the eye is blinked will be very small, and even drop by one or two orders of magnitude. Therefore, for a set of pupil area data, the pupil area during blinking will be much lower than the average and can be identified as an outlier. If these outliers are eliminated, the minimum value of the remaining value is the minimum value of the pupil area of the open eye state. But that’s not the only way to confirm blinking. Due to equipment reasons, the eye tracker may not be able to identify the pupil in the squinting state, so we need to find the point in time when the data suddenly drops and exclude outliers.
Figure 3: A comparison of the distribution of eye area data on the time scale before and after the exclusion of outliers.
Based on the above table, confirm the number of outliers that are removed and the corresponding serial number. The number of outliers represents the number of times the volunteer blinked during the experiment, and the corresponding serial number can confirm the blink time and calculate the blink frequency and time interval. Only four of these columns are needed to analyze the blink rate of each volunteer in response to noise interference in different situations. Finally, we collected the required data in the new table and corresponded them according to the serial number of the volunteers. The result is shown in the figure.
Cognitive Workload Among Orthopaedic Nurses During the Morning Rush Hours 49
Table 1. Extract the part of the experimental data that is valid or awaiting data analysis.
Based on the data in the above table, we obtained the line chart of the blink rate of each volunteer in the four groups of experiments to obtain the general rule of the influence of noise on the concentration degree of workers. After the data capture is completed, the first thing to confirm is whether the impact of noise on the concentration of workers is significant. We compare the changes in the blink rate of the same volunteers in each experiment. If the blink rate of volunteers increases with the increase of noise interference, then we believe that noise will accelerate the fatigue state of volunteers and further reduce the concentration degree of volunteers.
We calculate the proportion of volunteers that meet our expectations. The characteristic of these volunteers was that with the increase of noise interference, the blink rate increased and the working state decreased. The final value is 72.7%, that is, 70% or more of the volunteers apply to the rule that “the increase in the size and complexity of noise will lead to the acceleration of the decline of workers’ attention degree”, which is fit for our forecast. Therefore, we believe that the experimental results are significant and have a certain universality.
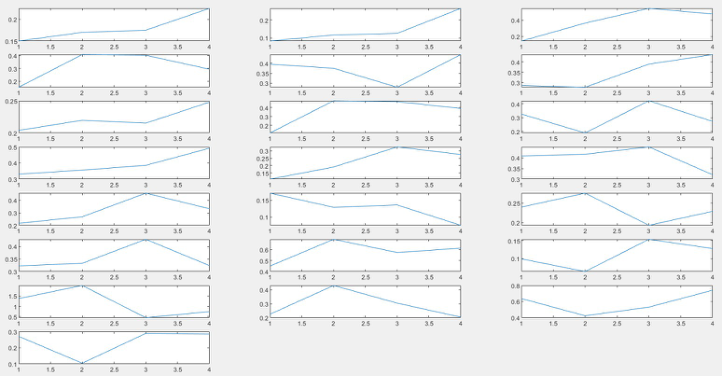
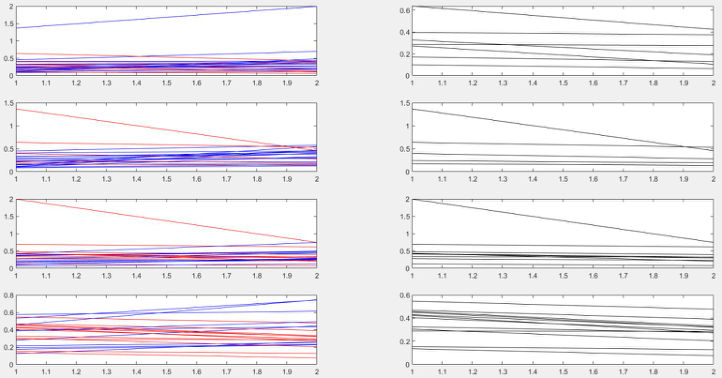
To describe the experimental results more intuitively, we printed the blink rate of the volunteers participating in the experiment as line charts. The purpose of this step is to achieve the effect of the trend line of blink rate in the above square bar chart and to visually observe the changing trend of the data of each volunteer for further analysis.
Figure 4: A line chart of comparing blink rate data from all four groups of volunteers.
In order to express the results more intuitively and orderly, it is also necessary to obtain the general trend of each set of data. We graph all data in each set in order to further analysis the trend within different set and compare each set with others. The trend is presented in the figure below. It can be clearly seen that the first type of data accounts for a relatively high proportion and most people’s data in a similar range. However, the proportion of the second and third types of data is relatively low, and the distribution of the third type of data is chaotic, which is speculated to be caused by the error of the experimental process or the error of the eye tracker data due to squinting or the equipment itself.
Figure 5: A comparison diagram of the four sets of experiments with all the samples after excluding outlier data and error data.
Cognitive Workload Among Orthopaedic Nurses During the Morning Rush Hours 51
The first and second sets of data were compared to represent the blink rate change of workers from a noiseless environment to a working environment with ambient noise. The first and third sets of data were compared to represent the blink rate change of workers from a noiseless environment to a working environment with questioning noise. The second and fourth sets of data were compared, representing the blink rate change of the worker from the environment with ambient noise to the working environment with both ambient noise and questioning noise. The third and fourth sets of data were compared, representing the blink rate change of workers from the environment with questioning noise to the working environment with both ambient noise and questioning noise. We use the percentage of fatigue level change within each individual. And we calculate and import these data into an EXCEL table for observation. The final table is shown below.
Table 2: Noise distribution line comparison diagram.
Table available in the original PDF paper.
Situation 1: From a noiseless environment to a no-noise environment Ambient noise, environmental transformation
Situation 2: From a noiseless environment to a no-noise environment Question Asked Noise Environment Shift
Situation 3: By ambient noise environment There is ambient noise and there is noise to ask questions Environmental shifts
Situation 4: There is a noisy environment There is ambient noise and there is noise to ask questions Environmental shifts
Proportion of
66.67% 80.95% 61.90% 42.86%
individuals with increased fatigue levels Percentage of
33.33% 19.05% 38.10% 57.14%
individuals with reduced fatigue levels
CONCLUSION
Finding 1: Noise generally reduces the concentration of workers. The results of the experiment showed that in about 70% of the workers, while performing the same type of work when the noise of the work environment became louder and more complex, the workers blinked more frequently. This also means that for workers in the operation process, the loss of energy will be intensified, that is, they will enter the fatigue state at a faster rate. Moreover, in the process of the worker experiment, we summarized the correct rate of each volunteer’s answer to the simple two-digit addition and subtraction problem. Under the complex noise, the volunteers’ answer accuracy decreased significantly, and some low-level mistakes occurred. These experimental phenomena also imply that the effect of noise on the concentration of workers is significant and can worsen the mental state of workers.
Finding 2: White noise of environmental noise can make workers have a certain resistance to more complex noise to a certain extent.
Noise is not always a negative factor. For groups with high daily work pressure, they often need some white noise assistance when falling asleep, such as the sound of rain, blowing, ASMR, and so on.
Imagine the following scenario: if a person plays a low white noise at the head of the bed before falling asleep, then if a larger noise occurs suddenly in the process of falling asleep, such as the sound of a neighbor knocking over a chair, then because the white noise gives the sleeping person resistance to noise, then the sudden sound of knocking over a chair will not make him have a larger reaction, such as waking up or frightening.
This theory is also reflected in this experiment. For a considerable number of volunteers, the statistical graph of blink rate showed a line graph that rose first and then fell. The blink rate of the volunteers who played the ambient noise of the hospital during the operation was significantly higher than that in the noiseless environment. Of course, this turn can only show that the noise has a negative effect on it. However, the blink rate of the volunteers who were exposed to ambient noise and had to answer questions decreased compared to the volunteers who were exposed to no ambient noise and only had to answer questions, and most of them answered the questions correctly. This seemingly irregular line illustrates the conclusion: white noise of ambient noise can make workers have a certain resistance to more complex noise, in other words, white noise can help workers resist complex noise.
ACKNOWLEDGMENT
Each author’s contribution in this article is the same.
First, we would like to express our gratitude to our advisor Dr. Rio Tang, from whose lectures we benefited greatly. The Human Factors Engineering and Introduction to Ergonomics courses we took have drawn our interest to the related topics. With our strong interests in human factors and ergonomics. We would like to thank Dr. Tang for his guidance throughout the whole process. Our project benefited from thorough and in-depth discussions about the research methodology and critical thinking.
After that, we are grateful for ourselves. Our project showcased true teamwork, diligent effort from the all members. Our project was a collaborative work. Despite some heated exchanges of opinions and sporadic disagreements, our love for each other and trust in teamwork triumphed. We deeply cherish this friendship and sincerely hope we can all become the ones we want to be. The achievement of our senior project belongs to us, testifying to our cooperation, our diligence, persistence, and perpetual friendship.
REFERENCES
Biondi, F. N., Saberi, B., Graf, F., Cort, J., Pillai, P., & Balasingam, B. (2023).
Distracted worker: Using pupil size and blink rate to detect cognitive load during manufacturing tasks. Applied Ergonomics, 106, 103867. https://doi.org/10.1016/ j.apergo.2022.103867 Cohen, J., LaRue, C., & Cohen, H. H. (2017). Attention Interrupted: Cognitive Distraction & Workplace Safety. Prof. Safety, 62, 28–34.
Cognitive Workload Among Orthopaedic Nurses During the Morning Rush Hours 53
Liu, Y. C., Huang, P. C., Lee, Y. C., Chu, C. L., Yang, Y. K., Chen, P. S., & Lin, K. C.
(2020). Effects of adding a concurrent cognitive task on manual dexterity in people with schizophrenia: Implications for performance of daily life activities. Asian Journal of Psychiatry, 54, 102456. https://doi.org/10.1016/j.ajp.2020.102456 Fan, Z., Yang, X., Wu, H., Li, A., Xu, P., & Lian, B. (2009). Cluster analysis of medical risk survey results. China’s Health Quality Management, (4), 8–10. https://doi.org/10.13912/j.carol.carroll.nki. CHQM.2009.04.015 Gui, C., & Sun, M. (2017). A review of medical risk and its influencing factors in
China. China Health Resources, (3), 272–275 + 280. https://doi.org/10.13688/ j.carol.carroll.nki. CRH.2017.15331 He, H., & Huang, J. (2021). Eye tracking in human-computer interaction control.
Journal of Shandong University (Engineering Science), 51(2), 1–8. Huang, L. (2021). A study on the reliability and validity of three sports bracelets in the center rate and step count index of variable direction running test [D]. The Shanghai Sports Institute. https://doi.org/10.27315/, dc.nki. Gstyx.2021.000183 Jin, H., & Liu, Y. (2018). Eye movement index testing control fatigue performance
study. Journal of Safety and Environment, 19(3), 1004–1007. https://doi.org/ 10.13637/j.issn.1009–6094.2018.03.033 Liang, W. (2017). Sports wristbands may provide inconsistent heart rate data.
Cardiovascular Disease Prevention Knowledge (Popular Science Edition), (21), 60. Liu, J. (2019). Analysis of eye movement research in China in the past 10 years.
Journal of Nanjing University of Posts and Telecommunications (Social Science), 21(2), 70–77. Franciotta, M., Maestri, R., Ortelli, P., Ferrazzoli, D., Mastalli, F., & Frazzitta, G.
(2019). Occupational Therapy for Parkinsonian Patients: A Retrospective Study. Parkinson’s Disease, 2019, Article ID 4561830. https://doi.org/10.1155/2019/ 4561830 Pliego Prim, I. (2019). Research of driver’s perception of novel traffic signals using an eye tracker [Master’s thesis, University of Ljubljana]. Repository of the University of Ljubljana. Qian, B., Wu, B., & Zhou, D. (2014). Explore the causes of medical disputes and
their impact on medical behavior. Medical Information: Medicine and Computer Applications, (28), 1. Choi, H., Seo, K. C., Kim, T. U., Lee, S. J., Hyun, J. K., & Hyun, J. K. (2019).
Repetitive Transcranial Magnetic Stimulation Enhances Recovery in Central Cord Syndrome Patients. Annals of Rehabilitation Medicine, 43(1), 62–73. https:// doi.org/10.5535/arm.2019.43.1.62 Shi, Y. (2023). Study on the influence of sports bracelet monitoring on the physical training effect of high school female basketball players [D]. Shanxi University. https://doi.org/10.27284/, dc.nki. Gsxiu.2023.000796 Wang, S. (2023). A study on the reliability and validity of two smart bracelets
for monitoring heart rate in different sports [D]. Capital Institute of Physical Education. https://doi.org/10.27340/, dc.nki. Gstxy.2023.000106 Ye, J., Jia, X., & Wu, S. (2021). Analysis of 96 cases of orthopedic medical malpractice. Journal of Traditional Chinese Medicine Administration, (20), 242–244. https://doi.org/10.16690/j.cnki.1007–9203.2021.20.118 Yu, X., Sun, J., Ye, C., et al. (2022). Eye movement experiment based mobile
shopping APP cart button location design. Journal of Human Ergonomics, 28(01), 59–63. https://doi.org/10.13837/j.issn.1006–8309.2022.01.0011 Zele, A. J., & Gamlin, P. D. (2020). Editorial: The Pupil: Behavior, Anatomy, Physiology and Clinical Biomarkers. Front. Neurol., 11, 211. https://doi.org/ 10.3389/fneur.2020.00211
LISTED IN THE AHFE DIGITAL BOOKSTORE CATALOGUE
Explore the complete digital volume
Neuroergonomics and Cognitive Engineering
Read this individual research paper free through the original publisher, or explore the full digital proceedings book.
ISBN 978-1-964867-43-4
Explore this ISBN in the AHFE Bookstore ↗Listed in the July 2026 bookstore catalogue; search by ISBN to confirm current availability · Digital book purchase optional