Zi-hao Liu, Zhizi Liu, Tao Chen, Liang Zhang (2025). A Vehicle Dashboard Dataset Towards Visual Complexity Design. In: Advances in Human Factors of Transportation. AHFE Open Access, vol. 186, pp. 301–310. https://doi.org/10.54941/ahfe1006519
With the expansion of the in-vehicle information system features, there are more and more new elements integrated into modern dashboards, which may lead to an increase in their visual complexity and additionally threatens drivers’ safety. To establish the cognitively efficient dashboards, protect driving safety and performance, it is essential for researchers and designers to identify what objective features increase the visual complexity of dashboard. However, due to various reasons, useful experiment materials of modern dashboards are rare for researchers and designers. To fill the gap, present study collected 1400 images of vehicle dashboards from 170 different brands online, then filtered, cropped the poor-quality images, and used the super-resolution technique to improve the images’ resolution with a self-made Python program. After pre-processing and evaluating objective visual complexity (OVC), present study recruited 160 participants to rate image’s subjective visual complexity (SVC), and finally form a vehicle dashboard dataset of 100 high-quality images with both SVC and OVC scores. Present study also conducted eye-track experiments to examine the validity of dataset. The result showed that 1) dashboards with high SVC would increase participants’ information searching time, deteriorate their searching accuracy; 2) In terms of gaze duration, top three influential objective features are: maps or vehicle state models, warning icons, chunks of information. In short, present study provide a useful vehicle dashboard dataset towards visual complexity design for researchers and designers, which may also be helpful for user-experience, ergonomics, or Human vehicle interaction research.
Vehicle dashboard is one of the main components of the in-vehicle information system (IVIS), which functioning crucially between human-car interactions (ISO 15008, 2017). With the development of technology, there are more and more features, elements and functions are integrated into the dashboards, which in turn increase the visual complexity, hamper humans’ limited information-processing capacities, effect drivers’ performance and even poses a serious threat to driving safety (Engström et al., 2005; Lee et al.,
2019; Snodgrass and Vanderwart, 1980). Therefore, it is essential to explore what factors are associated with modern vehicles’ dashboard visual complexity.
Visual complexity is dependent on the dashboards’ inherent visual features as well as the perceivers’ mental processes (Bai et al., 2023). Thus, the visual complexity could be further divided into objective visual complexity (OVC) and subjective visual complexity (SVC, also called as perceived visual complexity, PVC). The OVC is an emerging design metric, which mainly based on 14 objective visual features of the dashboard itself (Kim et al., 2015; Yoon et al., 2015). Due to the characteristics of modern dashboard, animation effects (component animation and background animation) and colours need to be calculated for OVC (Bai et al., 2023). As for SVC, it is individuals’ subjective awareness of the complexity of visual components on the dashboard (Yoon et al., 2015). Except for the subjective experience of dashboard (i.e., visual complexity experience, preference), there are three basic factors may affect the overall SVC: the number of visual elements, the variety of visual elements and the spatial relation between visual elements (Xing et al., 2004).
Previous research investigated the measurements of OVC and SVC, contributed to improving and designing vehicle dashboard (Bai et al., 2023; Ye et al., 2023). However, most of them only focused visual complexity from the perspective of objective or subjective, which may result in biased conclusion. Moreover, the dataset’s validity needs to be verified, especially whether they are related to visual complexity design. Lastly, due to the unique nature of dashboard materials, it is hard for designers or researchers to find a usable, large, systematic dataset of vehicle dashboard.
To fill these gaps, present study assembled a vehicle dashboard dataset for visual complexity design. Compared with others, present study’s dataset collected materials based on real-world modern dashboard design, which provides the practical value for researcher or designer. The dataset in present study could not only provide valuable materials for related research but also be widely applied in user-experience-design, human-car interaction design and so on. The sample could be download for free (https://github.com/Psy- lzh), and the complete dataset could be obtained through corresponding author (Zhangliang@psych.ac.cn).
THE DATASET Building dataset contains 4 main steps: materials collection (including: filtering, cutting, pre-processing), objective visual complexity calculation, subjective visual complexity evaluation, and ecological validity check.
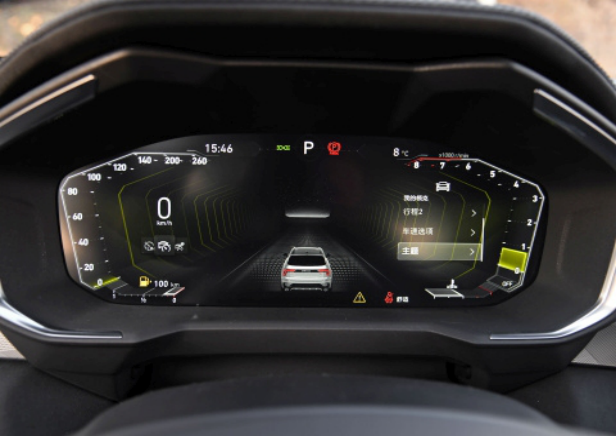
Materials Collection Initially, 1400 images of vehicle dashboards from 170 different brands were collected from a major online vehicle forum in China (PCauto Vehicle Forum; Figure 1).
A Vehicle Dashboard Dataset Towards Visual Complexity Design 303
Figure 1: An example of a raw vehicle dashboard image.
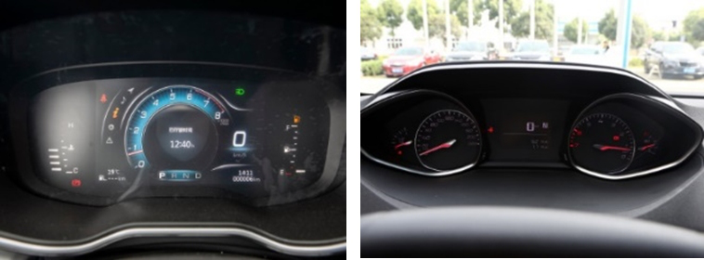
The raw dashboard images come from different resource: most of them are taken and uploaded by car enthusiasts’ own or model cars at automobile sales service shops, while some were advertisement/prototype concept pictures from vehicle manufacturers. Though all raw images were selected with first- person perspective of driver to ensure the follow-up processing, there still have 3 common issues that may additionally influence visual complexity: insufficient image resolution, too much reflection that made dashboard elements indistinguishable, highly distinct dashboard size or shape (Figure 2).
Figure 2: Example of the issues with raw images. Left: too much reflection. Right: distinct dash-board shape.
In order to improve the quality of raw images, present study firstly excluded the images with too low resolution (below 480*360 pixels). Then 6 trained research assistants worked in groups of two for further filtering. If a group disagreed on the eligibility of an image, a third research assistant
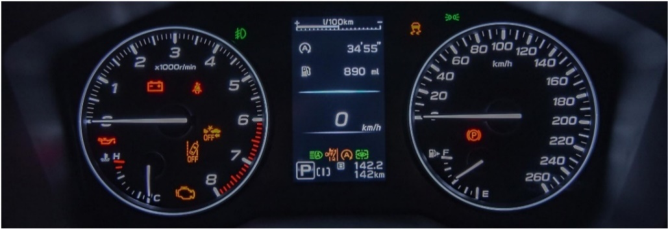
would make the decision. A total of 200 images were determined to be eligible for subsequent processing. Figure 3 showed an example of an image after the preliminary editing. The steering wheel and the irrelevant background were adjusted with screenshot so that only prominent dashboard area.
Figure 3: An example of an image after the preliminary editing.
Next, the research assistants labelled the core area and elements of dashboard with LabelMe 5.0 (Russell et al., 2008), and calculated their sizes with self-made Python programs. They also added a black background to each to ensure the unified appearance of materials (Figure 4).
Figure 4: An example of processing a dashboard image. Left: the mask of cutting of images. Right: the materials after cutting and adding the black background.
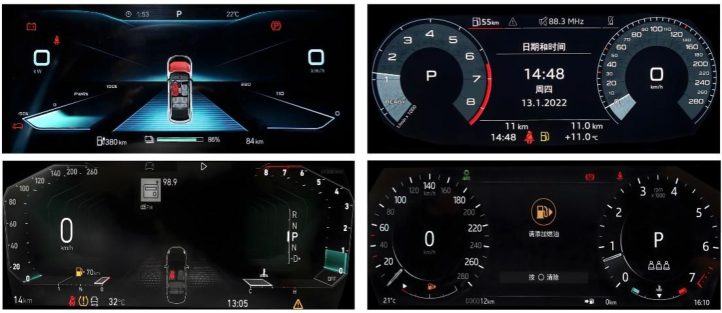
Furthermore, Real-ESRGAN algorithm was used for improving the materials’ resolutions. The algorithm is different from classic Real-ESRGAN because of employing the U-Net discriminator to replace the original VGG discriminator and introducing spectral normalization to make training more stable and reduce artifacts, additionally, the synthesized data and a “second- order” degradation model were used for training so that the algorithm could repair in real-world scenarios (Wang et al., 2021). After super-resolution reconstruction, materials were converted to 2560*1080 pixels resolution, the still blurry materials would be removed from final dataset, and eventually, the dataset of 100 materials was confirmed (Figure 5). After assembling the dataset, present study further calculated its visual complexity in both objective and subjective.
A Vehicle Dashboard Dataset Towards Visual Complexity Design 305
Figure 5: Some examples of the final dataset.
Objective Visual Complexity Measures. In line with previous studies, 14 objective indicators were included as the basic features for measuring the dashboards’ objective visual complexity (e.g., the number/area of icons, charts, fonts; Kim et al., 2015; Yoon et al., 2015). Moreover, along with the research of Bai et al. (2023), 31 indicators (e.g., the category/area/ratio of a certain colour) related to animation effects and colours were also included.
Procedure. 6 research assistants were trained to evaluate the objective visual metrics of the dashboard with LabelMe 5.0. They marked each indicator manually in pairs and reached a consensus on evaluation at last. As for the colours dimension, all images format in dataset were transform from RGB to HSV, then a self-developed Python program was employed to judge the hue value of each pixel in the image automatically. Lastly, assistants in pairs divided these datasets into three groups (high, medium, low) based on each image’s own objective visual metrics in in the case of reaching an agreement.
Subjective Visual Complexity Participants: There are 160 participants (Age = 24 ± 4.21 years) were recruited online for a subjective visual complexity rating experiment. After screening out participants without driver’s licenses, the final sample is 134 participants (Age = 24.1 ± 4.19 years).
Measures: The subjective visual complexity was measured by a Chinese- version perceived visual complexity questionnaire (Lee et al., 2016; Yoon et al., 2015). The questionnaire measures SVC in 4 aspects (i.e. quantity, variety, layout of the displayed visual elements, and overall complexity) with 13 items (3 items for each aspect, and an additional item to measure participants’ general preference for a dashboard). Each of items was rated on 7-point scale. Procedure: Prior to their participation, research assistants provided detailed information about each study stage and emphasized participants’
right to withdraw at any time. Informed consents were obtained from all participants online. All eligible participants were asked to complete an online rating task according to their first impression through Tencent Meeting. Concerning the potential effect of display (Yared and Patterson, 2020), a self-designed program in Python was utilized to present the materials on participants’ computers, which would only start when setting window resolution to 1920*1080 pixels and layout zooming at 125%. Throughout the online experiment, participants were also asked to turn on their cameras and microphone for assistants to monitor their status and ensure their careful evaluation. After completing the experiment (25 materials, take about 50 mins), participants received about 35 RMB (≈$5) as their reward. Results: Present study tested the result of SVC questionnaires with R studio. Specifically, the Cronbach’s alpha of different SVC factors in this experiment is 0.881∼0.926, which indicated the reliability of the questionnaire. Besides, the well-fitting result of confirmatory factor analysis (CFA) showed structure validity (Table 1).
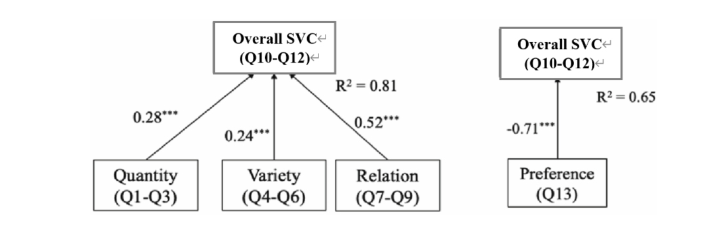
The regression result demonstrated relationship between overall SVC and 4 different SVC factors (Figure 6), also indicated the factors of SVC could explain the overall SVC to some extent.
Figure 6: Multiple regression results of SVC questionnaire. Note: the number and arrow are the beta coefficients; *p < 0.1; **p < 0.05; ***p < 0.01.
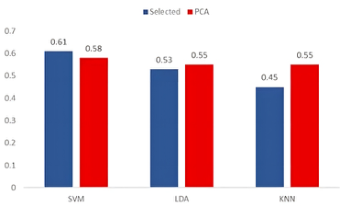
Present study also tried using the metrics of OVC to predict which group of SVC does the materials belong to through machine learning. The results of trained models indicated that OVC are closely, robust related to SVC, which also verified the potential values for visual complexity design to some extent (Figure 7).
A Vehicle Dashboard Dataset Towards Visual Complexity Design 307
Figure 7: Results of machine learning. Note: PCA means training data was processed by principal factor analysis (PCA). Selected means data was selected through variance selection, correlation analysis, chi-square test, and fisher score before training. SVM: Support Vector Machine. LDA: Linear Discriminant Analysis. KNN: K-Nearest Neighbours. X-axis: Model Type. Y-axis: Accuracy.
The Ecological Validity of Dataset To ensure the ecological validity of dataset, present study also conducted an eye-track experiments with drivers. Notably, given the sample size, the results could be regarded as exploratory.
Participants: 15 drivers were recruited for eye-track experiments through social media. As for driving experience, there were 10 participants had driving under 1000 km, 4 participants had driving 1000∼10000 km, only 1 participants driving over 10000 km. Measures: EyeLink 1000 (SR Research Ltd.) was used to track participants’ eye movements, including gaze duration, gaze location and first gaze location. Behaviour indicators (e.g., reaction time, accuracy) were recorded through E-prime3.0 (Psychology Software Tools, Inc).
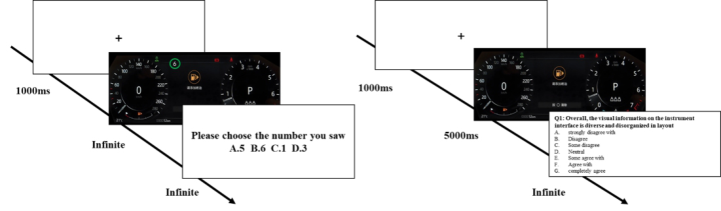
Procedure: After calibrating EyeLink 1000, all participants were asked to complete 2 eye-track experiments. The first experiment required participants to search the targeted number in each material as soon as possible. Then participants would start an evaluation task, in this task, they needed to view and make evaluations about material one by one. Each experiment contains 30 trials, the materials were randomly chosen from different visual complexity group in the dataset (Figure 8).
Figure 8: The procedure of eye-track experiments. Left: searching task, green circle means target. Right: evaluation task.
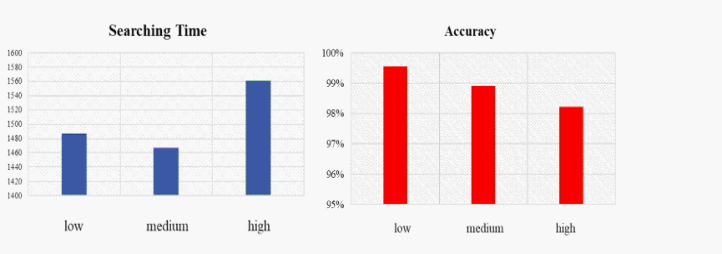
Results: The first experiment mainly focused on participants’ behaviours results, which indicated dashboards with high SVC would increase participants’ information searching time, deteriorate their searching accuracy (Figure 9).
Figure 9: The result of first experiment. Left: searching time. Right: searching accuracy. Note: low/medium/high means SVC group the materials belong to.
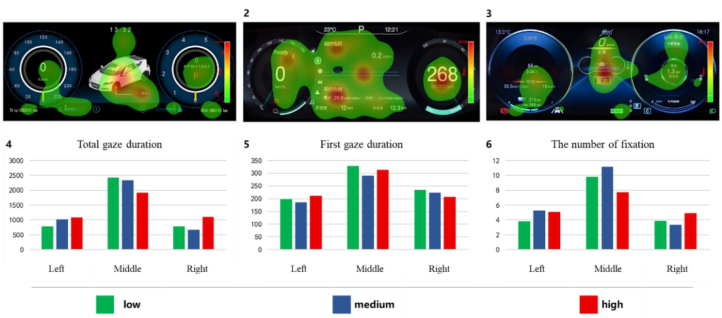
The second experiment using eye-track data demonstrated that 1) When browsing dashboard images, drivers would start with the middle of screen then move to the sides no matter what kind of information were presented in the middle. 2) In terms of gaze duration, top three influential objective features are: maps or vehicle state models, warning icons, chunks of information (Figure 10).
Figure 10: The eye-track result of second experiment. 1∼3: heat map of gaze in 5s. 4∼6: gaze indicators in different area with different visual complexity group. Note: low/medium/high means SVC group the materials belong to.
Discussion: As aforementioned, due to the limitation of sample size, the results of eye-track experiments didn’t find statistically significant difference between SVC groups, but there is still a tendency that higher SVC may hamper drivers’ searching performance. This result also verified the classification
A Vehicle Dashboard Dataset Towards Visual Complexity Design 309
based on OVC and SVC, identified the potential ecological validity of dataset. Besides, the result related to medium SVC is interesting, which may imply a potential nonlinear effect of SVC and need to be explore further in future.
CONCLUSION
Present study established and verified a vehicle dashboard dataset. Compared with others, the dataset is more comprehensive, which not only collected sufficient raw images, but also meticulously processed, sorted, verified the materials. Though the dataset is valuable, there are also several limitations should be acknowledged. Firstly, present study has relatively small sample size of evaluating SVC, each participants evaluated 25 overlapping images in dataset, future study could recruit more participants to increase the reliability of dataset. Secondly, present initially collected over 1400 raw images but limited by many reasons, the final dataset only contains 100 images with SVC, there are still many images could be modified to expand the dataset in future. Lastly, the Real-ESRGAN algorithm in present study based on default parameters, future research could make some customized adjustment to improve the materials. In short, present study provide a useful vehicle dashboard dataset towards visual complexity design for researchers and designers, which may also be helpful for user-experience, ergonomics, or Human vehicle interaction research.
ACKNOWLEDGMENT
The study was supported by Natural Science Foundation of Chongqing, China (CSTB2023NSCQ-LZX0161). The authors thank the team members of Chang ‘an and Institute of Psychology for their support in this work.
REFERENCES
Bai, H., Liu, Z., Fu, Z., Liu, Z., Zhang, H., Zhu, H., and Zhang, L. (2023). ‘Objective Metrics for Assessing Visual Complexity of Vehicle Dashboards: A Machine- Learning Based Study’. In: Krömker, H. (eds), HCI in Mobility, Transport, and Automotive Systems (pp. 103–113). HCII2023, Springer Nature Switzerland. Engström, J., Johansson, E., and Östlund, J. (2005). Effects of visual and cognitive
load in real and simulated motorway driving. Transportation research part F: Traffic psychology and behaviour, 8(2), pp. 97–120. ISO 15008. (2017) ‘Road Vehicles—Ergonomic Aspects of Transport Information and Control Systems—Specifications and Test Procedures for In-Vehicle Visual Presentation’, International Organization for Standardization, Geneva, Switzerland. Kim, J., Hwangbo, H., and Ji, Y. (2015). ‘Developing Visual Complexity Metrics
for Automotive Human-Machine Interfaces’. Journal of the Ergonomics Society of Korea. 34, pp. 235–245 Lee, S., Hwangbo, H., and Ji, Y. (2016). ‘Perceived Visual Complexity of In- Vehicle Information Display and Its Effects on Glance Behavior and Preferences’. International Journal of Human–Computer Interaction, 32(8), pp. 654–664.
Lee, S., Kim, Y., and Ji, Y. (2019). ‘Effects of visual complexity of in-vehicle information display: Age-related differences in visual search task in the driving context’. Applied Ergonomics, 81, Article 102888. PCauto Vehicle Forum, https://www.pcauto.com.cn/, last accessed 2025/3/11. Russell, B., Torralba, A., Murphy, K., and Freeman, W. (2008). ‘LabelMe: A
Database and Web-Based Tool for Image Annotation’. International Journal of Computer Vision, 77(1), pp. 157–173. Snodgrass, J., and Vanderwart, M. (1980). ‘A Standardized Set of 260 Pictures: Norms for Name Agreement, Image Agreement, Familiarity, And Visual Complexity’, Journal of Experimental Psychology: Human Learning and Memory, 6(2), pp. 174–215. Wang, X., Xie, L., Dong, C., & Shan, Y. (2021). ‘Real-esrgan: Training real-world
blind super-resolution with pure synthetic data’. In Proceedings of the IEEE/CVF International Conference on Computer Vision (pp.1905–1914). Xing, J. (2004). ‘Measures of Information Complexity and the Implications for Automation Design’. Yared, T., and Patterson, P. (2020). ‘The impact of navigation system display size and
environmental illumination on young driver mental workload’. Transportation Research Part F: Traffic Psychology and Behaviour, 74, pp. 330–344. Ye, C., Liu, Z., Dong, S., Shao, X., Chen, H., Zhu, H., and Zhang, L. (2023).
‘Measurements of Complexity in Vehicle Dashboards: Revision and Validation of the Perceived Visual Complexity Scale’. In: Kurosu, M. & Hashizume, A. (eds), Human-Computer Interaction (pp. 327–335) . HCII2023, Springer Nature Switzerland. Yoon, S., Lim, J., and Ji, Y. (2015). ‘Assessment model for perceived visual complexity of automotive instrument cluster’. Applied Ergonomics, 46, pp. 76–83.
LISTED IN THE AHFE DIGITAL BOOKSTORE CATALOGUE
Explore the complete digital volume
Advances in Human Factors of Transportation
Read this individual research paper free through the original publisher, or explore the full digital proceedings book.
ISBN 978-1-964867-62-5
Explore this ISBN in the AHFE Bookstore ↗Listed in the July 2026 bookstore catalogue; search by ISBN to confirm current availability · Digital book purchase optional