Danny Sarmiento, Vannessa Nguyen, Vinicius Dugue, Kim-Phuong L. Vu, Thomas Strybel, Vernol Battiste, Praveen Shankar, Panadda Marayong (2025). Evaluating Simple Vibrotactile Feedback for Manual Glideslope Landings in Urban Air Mobility Simulation. In: Human Factors in Design, Engineering, and Computing. AHFE Open Access, vol. 199, pp. 2034–2043. https://doi.org/10.54941/ahfe1007015
Urban Air Mobility (UAM) is a transportation system that integrates vertical takeoff and landing (VTOL) aircraft into the National Airspace System, with the goal of transporting passengers and small goods within metropolitan areas. Although the vehicles are capable of VTOL, a glideslope landing approach was studied due to its advantage over VTOL in air traffic management coordination, energy consumption and passenger comfort. This study evaluated whether vibrotactile feedback improved manual glideslope landing performance when applied to the wrist on the dominant versus non-dominant arm. Participants performed glide slope landing using recommended flight parameters provided on a glideslope display to descend and land at a vertiport. Using a CAVE virtual reality simulation, sixteen novice, non-pilot participants completed 18 simulated landings at three different vertiports along two arrival entry routes (clockwise and counterclockwise direction) under three tactile feedback conditions: no feedback, feedback on dominant arm, and feedback on non-dominant arm. Performance data and subjective ratings of workload, usability, and situational awareness were collected. There was no significant effect of feedback condition. However, participants found the wrist placement for the vibrotactile alerts to be comfortable and suggested that dynamic vibration cues could further improve guidance from the alerts. Additionally, participants made more forward speed errors when landing at specific vertiports in the clockwise direction, which may have been due to the route characteristics that increased the difficulty of maintaining a consistent forward speed. These findings suggest that route design is a critical factor to consider when planning the approach paths for UAM operations, and could inform future tactile feedback design for enhancing pilot performance.
Evaluating Simple Vibrotactile Feedback for Manual Glideslope Landings 2035
INTRODUCTION
Urban Air Mobility (UAM) uses vertical take-off and landing (VTOL) vehicles to provide fast, on-demand transport within metropolitan areas. Integrating these aircraft into the National Airspace System poses new challenges for air traffic management especially when landing at vertiports positioned near existing airports. In addition, the use of a glideslope landing approach is being studied due to its advantage in air traffic management coordination, energy consumption and passenger comfort over VTOL (Schmitz et al., 2025). However, manually controlling the glideslope descent path and airspeed requires the operator to make continuous adjustments, often leading to high workload. Thus, techniques that improve the precision of glideslope landings are needed to reduce operator workload and increase overall performance.
Vibrotactile alerts have been shown to enhance operator performance and situational awareness in a variety of high-demand tasks such as fighter pilots hovering over moving targets and maintaining precise navigational orientation (Kelly et al., 2013). However, their effectiveness in supporting manual glideslope landings remains largely unexplored. Research shows that tactile sensitivity is heightened in the lower arm, especially in areas where skin receptors are more concentrated (Pardo et al., 2022). Thus, vibrotactile cues can be delivered more effectively through the wrists than other parts of the body. Prior studies have explored complex spatial patterns, such as hexagonal vibrotactile arrays on the back and legs, to provide directional information. However, these approaches have resulted in increased cognitive workload and decreased spatial localization accuracy, making them less suitable for time-sensitive tasks like manual landing (Wenzel & Martine, 2021). Thus, we explore the use of simple vibrotactile feedback to alert the operator when the UAM vehicle is off the glide slope path.
In this study, we used a CAVE-based, virtual reality (VR) simulator to compare the effects of three vibrotactile feedback conditions–no feedback, vibration on the dominant arm, and vibration on the non-dominant arm during simulated UAM glide slope approaches for landing. A glideslope display was added to a virtual cockpit display to guide the pilot along the desired landing trajectory. When vibrotactile feedback was provided, a vibration was applied to the wrist of the participant’s dominant or non- dominant arm when a deviation of ±2 degrees from the desired glideslope trajectory occurred. It was hypothesized that tactile alert would allow the UAM operators to make the appropriate adjustments to remain on the recommended glideslope path, reducing the number of errors, the amount of deviation, and the correction time. We also examined whether there would be any difference in performance based on whether the tactile cue was presented on the dominant versus non-dominant arm.
SYSTEM OVERVIEW The VisCube CAVE VR system (VisBox, IL) consists of four panel displays with real-time body tracking to provide participants with an immersive VR experience. Our research group has developed a VR simulation of a VTOL
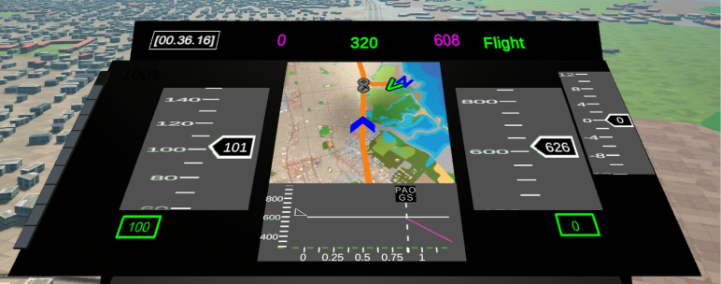
aircraft operating in the San Francisco Bay Area (Marayong et al., 2020). The operator controls the simulated aircraft through a flight control joystick. The virtual cockpit includes various user interfaces showing vehicle status, route status, a mini map, and a glideslope display (see Figure 1). Additionally, a haptic-feedback unit was added to deliver vibrational cues to the user when specific deviations occur. The following sections outlines the glideslope display’s components and functions, and describes the haptic unit for emitting vibrotactile alerts.
Figure 1: Cockpit interface display in the CAVE VR system showing the mini map and the glideslope display in the middle. The speed and altitude tapes are on the left and the right side, respectively.
Glideslope Display The glideslope display consisted of a VSD (Vertical Situation Display) which is a side view of the aircraft’s vertical path in space. The horizontal axis shows the distance along the route in nautical miles, relative to an approaching vertiport and waypoints along the route. The vertical axis shows the vehicle’s current altitude in feet. A fixed white triangle marks the aircraft’s position. The white line projects the aircraft’s predicted location 60 seconds ahead, based on its current speed and climb/descent rate. A magenta glideslope line provides visual guidance for the optimal descent path from the top of descent location down to the vertiport landing. Intermediate waypoints along the landing trajectory and the target vertiport are represented as vertical dotted lines on the VSD with its associated names (e.g., PAO for Palo Alto).
The desired forward speed is shown below the current forward speed in green text, and the desired rate of descent is shown below the current climb/descent rate in green text. Both values are calculated based on how far the pilot has progressed along the glideslope. As the aircraft descends, the desired speed and descent rate gradually adjust to maintain the correct descent angle and ensure a smooth approach. Overlapping of the white and the magenta line indicates that the pilot is on the desired glideslope trajectory. The mini map provides a bird’s eye view of the flight path, where the desired route is shown with the orange line, vertiports are marked with a green V, communication and navigational (e.g., a “T” for top of descent) markers are
Evaluating Simple Vibrotactile Feedback for Manual Glideslope Landings 2037
represented by grey circles, and a blue chevron represents the aircraft current position. The VSD along with the mini map provided participants with a complete picture of the route.
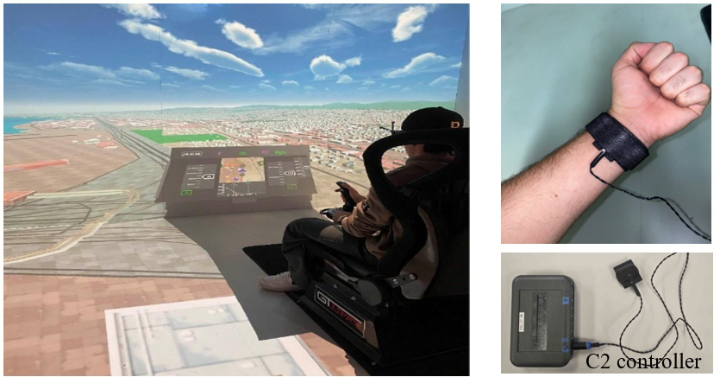
Haptic Feedback Unit The haptic feedback unit used was a single C2 tactor (Engineering Acoustics, Inc.) connected to a controller shown in Figure 2. Although the controller supported up to eight tactors, only one was used for this study. The controller allowed adjustments to vibration frequency, gain (intensity), and duration. For maximum sensitivity, the tactor was directly placed along the ventral side of the participants’ wrist, wrapped in place using a medical bandage.
Figure 2: (Left) experimental setup showing a participant performing a glideslope landing (right) tactile feedback unit placement on the wrist and the controller unit.
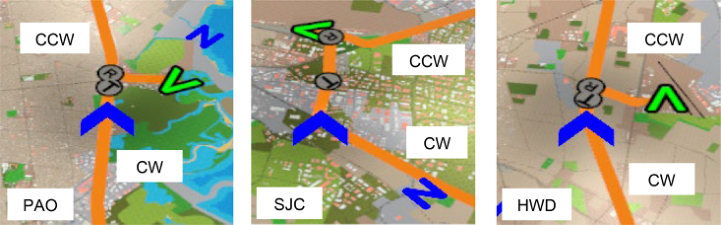
USER STUDY Three vibrotactile feedback conditions were tested: no feedback, feedback on the dominant arm, and feedback on the non-dominant arm. Figure 2 shows the system set up of the user study. Sixteen novice participants were asked to make glideslope landings at three different vertiports located in the San Francisco metropolitan area, near Palo Alto Airport (PAO), San Jose Mineta International Airport (SJC), and Hayward Executive Airport (HWD). Participants approached these vertiports in a clockwise or counterclockwise direction with respect to the vertiports as shown in Figure 3. This resulted in 18 counterbalanced conditions representing three tactile feedback conditions, three vertiports, and two routes (i.e., a 3 × 3 x 2 factorial design).
Prior to data collection, participants were given a 15-minute overview presentation explaining the purpose of the study, the procedure, and what to expect. They were also provided with a 15-minute practice session with the system, which included landing on a vertiport that was not used in the data analysis. During the experiment, participants wore noise-cancelling
headphones to prevent any influence of the auditory noise produced by the activated tactor. Each trial began with the participant positioned at a specified distance from the top of descent location for the vertiport (see Figure 3). Table 1 provides the characteristics of the route and the landing approach at each vertiport. Participants were instructed to follow the desired glideslope trajectory by adjusting flight parameters to match the recommended forward speed and rate of descent, and to land precisely on the designated vertiport. Tactile feedback was delivered as a non-directional vibration for one second at a frequency of 250hz with a gain of 255dB on the wrist each time the participant deviated from the desired glideslope angle by ±2 degrees.
Figure 3: CW and CCW routes to (Left) PAO, (middle) SJC, and (right) HWD vertiport. The vertiport location and the current aircraft position are shown on the mini map as a green V and a blue chevron, respectively. The T marker shows the top of descent location.
Performance metrics included the number of deviations, mean correction time, and mean speed error. A deviation was defined as any instance in which the participant veered more than ±2 degrees from the target glideslope angle. Correction time measured how long the participant took to return to the correct trajectory after each deviation. An occurrence of speed error was marked when the forward speed exceeded ±5% of the recommended value. The mean speed error was calculated by dividing the sum of the absolute value of forward speed errors by the number of instances that errors occurred.
After each condition, participants completed the NASA Task Load Index (NASA TLX), Situation Awareness Rating Technique (SART), and System Usability Scale (SUS) to assess their subjective evaluation of workload, situational awareness, usability, respectively. In addition, a post-experiment questionnaire was administered to gauge participants’ perceptions of comfort, usability, clarity, and the helpfulness of the vibrotactile feedback using a 7-point Likert scale, along with open-ended questions for qualitative feedback on potential tactor improvements.
Evaluating Simple Vibrotactile Feedback for Manual Glideslope Landings 2039
Table 1: Description of the route and landing approach characteristics of each vertiport.
Table available in the original PDF paper.
Vertiport Route and Starting Altitude
Approach Description
Distance from Top of Descent to First Turn into Vertiport (nm)
0.02
PAO Clockwise (600 ft) Turned 90
right into the vertiport
0.35
Counterclockwise (800 ft)
Turned 90
left into the vertiport
0.75
SJC Clockwise (600 ft) Turned 100
right into the vertiport
0.80
Counterclockwise (800 ft)
Turned slight right into the vertiport
0.21
HWD Clockwise (600 ft) Turned 90
right into the vertiport
0.14
Counterclockwise (800 ft)
Turned 100
left into the vertiport
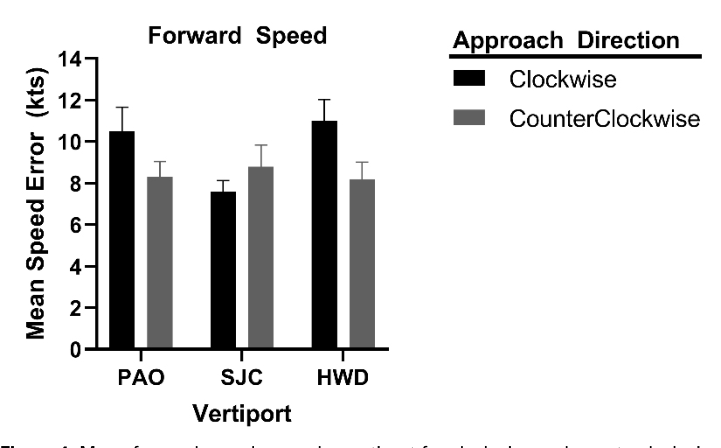
Figure 4: Mean forward speed errors by vertiport for clockwise and counterclockwise routes.
RESULTS
Three 3 (Feedback condition: no feedback, dominant arm, non- dominant arm) x 3 (Vertiport: PAO, SJC, HWD) x 2 (Route: clockwise, counterclockwise) within-subjects ANOVAs were conducted with the dependent variables of number of deviations, correction time, and speed error. Table 2 provides the mean number of deviations and correction times for each of the three Feedback conditions. There were no significant main effects or interactions for the number of deviations (Fs < 4.09, ps > .061)
and correction time (Fs < 3.16, ps > .096). While not statistically significant, vibrotactile feedback resulted in numerically shorter average correction times compared to the no feedback condition, but participants made lower number of deviations with the no feedback condition.
Speed error showed a significant two-way interaction of Vertiport and Route, (F(2, 30) = 6.246, p = .005), as shown in Figure 4. Simple effects analyses revealed that speed error differed significantly between clockwise and counterclockwise routes at the PAO (t(15) = 2.482 p = .025) and HWD (t(15) = 2.779, p = .014) vertiports but not SJC. Additionally, for the clockwise route, it differed significantly across the vertiports (F(2, 30) = 7.943, p = .002). Pairwise comparisons showed significantly lower speed error at SJC (M = 7.574, SE = .556) compared to PAO (M = 10.505, SE = 1.150, p = .037) and HWD (M = 11.013, SE = 1.021, p = .010) in the clockwise direction.
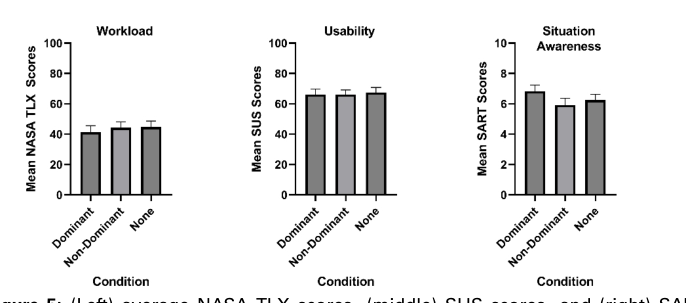
For the questionnaires, repeated measures ANOVAs with Feedback condition (dominant arm, non-dominant arm, or no feedback) as a factor were conducted on the NASA TLX, SUS, and SART scores, as illustrated in Figure 5. There were no significant effects for workload (F(2, 30) = .616, p = .547), usability, (F(2, 30) = 0.183, p = .834), or situational awareness (F(2, 30) = 3.108, p = 0.059).
Table 2: Mean number of deviations and correction time of each feedback condition.
Table available in the original PDF paper.
Feedback Condition Mean Number of Deviations Mean Correction Time (s) Dominant 5.53 13.56 Non-dominant 5.31 13.99 No feedback 5.02 16.42
Figure 5: (Left) average NASA TLX scores, (middle) SUS scores, and (right) SART scores across feedback conditions.
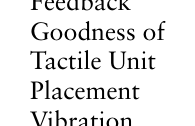
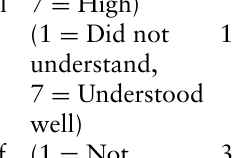
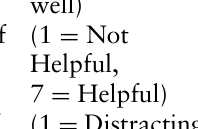
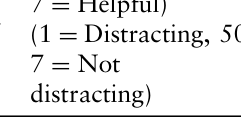
The post-experiment questionnaire data shown in Table 3, indicated that a majority (≥75%) of participants believed the vibrotactile feedback to be comfortable, positioned well on the wrist, and conveyed a clear meaning. Participants had varied responses regarding the level of intensity of the
Evaluating Simple Vibrotactile Feedback for Manual Glideslope Landings 2041
vibration, helpfulness of the vibrotactile feedback for landing, and its distraction during that phase of flight. Qualitative feedback also provided suggestions to improve the frequency of the vibrations to indicate the magnitude of deviation from the desired glideslope trajectory. For instance, several participants shared a similar viewpoint in which vibrotactile alerts could be enhanced through using different characteristics of the tactile cue, such as intensity or duration, or different vibrating patterns to indicate what adjustments to make and the magnitude of those adjustments.
DISCUSSION
Contrary to our hypotheses, vibrotactile feedback did not impact performance measures such as the correction time and number of deviations. Though not statistically significant, lower number of deviations and longer correction time observed in the no feedback condition as compared to the two tactile feedback conditions illustrate a speed-accuracy trade-off. A speed- accuracy trade-off describes the relationship between response speed and accuracy in which faster responses are at the expense of increased errors (Pew, 1969). Upon receiving the vibrational alert, participants may have hastily moved the joystick, leading to overadjustments beyond the 2-degree threshold from the desired glideslope angle. In doing so, precision was sacrificed for speed.
Table 3: Percentage of participant ratings on vibrotactile feedback conditions (N =16).
Equation reproduced from the original PDF.Equation reproduced from the original PDF.
12.50% 12.50% 75%
Meaning of Vibration
Equation reproduced from the original PDF.
37.50% 18.75% 43.75%
Helpfulness of Vibration
Equation reproduced from the original PDF.
50% 6.25% 43.75%
Distraction of Vibration
Equation reproduced from the original PDF.
The significant difference in speed error across Vertiports and Route may be attributed to the varying levels of difficulty when approaching the vertiports from clockwise versus counterclockwise directions. Higher error
observed in the approaches to PAO and HWD vertiports may have been due to the need to make a sharp right turn after the top of descent. This required more attention to the parameters of direction, speed, and rate of descent to follow the glideslope for landing at those vertiports. For SJC, the turns were wider and occurred at some distance from the top of descent making the approach easier to maneuver, explaining the lower speed error. The combination sharp turns and shorter distance between the top of descent and the first turn into the PAO and HWD vertiports along the clockwise directional route may have increased the difficulty of maintaining a consistent forward speed relative to the glideslope display. These findings suggest that route design is a critical factor to consider when deciding on the vertiport location and the approach paths taken to land at the vertiport.
Perceived workload, usability, and situational awareness did not differ significantly across the three feedback conditions. For the NASA TLX, the scores were within the 25–50% range of the cumulative frequency distribution for NASA TLX total workload scores across other pilot aircraft tasks (Grier, 2015). This may suggest that workload in the present simulation was neither excessively low nor high, but within a common and manageable range for aircraft operations.
Post-experiment responses showed that the majority of participants had a clear understanding of the vibrotactile feedback. In contrast to the no feedback condition, the alert served as a source of navigational information to signal deviations from the glideslope trajectory. Participants also indicated that altering the intensity, frequency, or pattern of vibration based on the magnitude of deviation may enhance correction accuracy and overall performance. The nonsignificant effect of the feedback location (dominant vs. non-dominant arm) may support placement of a tactile alert on the non-dominant side to avoid interference with other tasks performed by the dominant hand in an actual application. These factors could be examined in future studies to investigate the appropriate design of informational cues for UAM operations.
CONCLUSION
The study aimed to evaluate the use of a simple tactile alert during a glideslope landing approach for UAM. Vibrotactile feedback was provided to help the operator maintain the desired trajectory during a glideslope landing approach. The results showed that simple vibrotactile cues may not be sufficient; however, participants found vibrotactile feedback to be comfortable and easy to understand. Future studies should explore whether other characteristics of vibrotactile cues such as intensity, frequency, or vibration pattern are more effective in enhancing operators’ performance and situation awareness for UAM operations.
ACKNOWLEDGMENT
This research was supported in part by NSF Major Research Instrumentation award (Award #1626655) and San Jose State Research Foundation Grant
Evaluating Simple Vibrotactile Feedback for Manual Glideslope Landings 2043
#2116145736 (PI: Sean Laraway). We also thank Justin Cheung and Russell Ayala for their help with the simulation development and Andrew Alfaro- Arevalo for his help with the qualitative analysis.
REFERENCES
Grier, A. R. (October, 2015). How high is high? A metanalysis of NASA TLX global workload scores. Proceedings of Human Factors and Ergonomics Society Annual Meeting Volume 59, No. 1. https://doi:10.1177/1541931215591373. Kelley, M. A., Cheung, B., Lawson, D. B., Rath, E., Chiasson, J., Ramiccio, G. J., and
Rupert, H. A. (2013). Tactile cues for orienting pilots during hover over moving targets. Aviation, Space, and Environmental Medicine, Volume 84, No. 12. https: //doi.org/10.3357/asem.3669.2013. Maegan, S., Dugue, V., Cheung, J., Battiste, V., Marayong, P., Strybel, T., Shankar, P., and Vu, K. (August 2025). Vibrotactile navigational cues may be effective for specific urban air mobility operations. Proceedings of Human Factors and Ergonomics Society Annual Meeting. https://doi.org/10.1177/ 1071181325136947. Marayong, P., Shankar, P., Wei, J., Nguyen, H., Strybel, T., and Battiste, V. (2020).
Urban Air Mobility System Testbed using CAVE Virtual Reality Environment, IEEE Aerospace Conference. Pardo, L. A. (October 28, 2022). Vibrotactile mapping of the upper extremity: Absolute perceived intensity is location-dependent; perception of relative changes is not. Frontiers in Neuroscience Volume 16. https://doi:10.3389/ fnins.2022.958415. Pew, W. R. (1969). The speed-accuracy operating characteristic. Acta Psychologica
Volume 30, pp. 16–26. Wenzel, E. M., and Godfroy-Cooper, M. (April 1, 2021). The role of tactile cueing in multimodal displays: Application in complex task environments for space exploration. NASA Technical Reports Server (NTRS). http://www.ntrs.nasa.gov/ citations/20210017508.
LISTED IN THE AHFE DIGITAL BOOKSTORE CATALOGUE
Explore the complete digital volume
Human Factors in Design, Engineering, and Computing
Read this individual research paper free through the original publisher, or explore the full digital proceedings book.
ISBN 978-1-964867-75-5
Explore this ISBN in the AHFE Bookstore ↗Listed in the July 2026 bookstore catalogue; search by ISBN to confirm current availability · Digital book purchase optional