Kali Haneji, Kristine Leung, Alina Tran, Justin Cheung, William Deabaapilux, Panadda Marayong, Kim-Phuong L. Vu, Praveen Shankar, Thomas Strybel, Vernol Battiste (2023). Use of Tactile Alerts in Urban Air Mobility Vehicles. In: Human Factors in Transportation. AHFE Open Access, vol. 95, pp. 511–520. https://doi.org/10.54941/ahfe1003836
Urban Air Mobility (UAM) has been proposed as a solution to congested roads in cities. We tested an early concept of operation for UAM, where participants flew a simulated vehicle along a freeway route to and from two locations in the San Francisco area. We found that novice participants were able to pilot our UAM vehicle when it deviated from an automated route and return it back on course. Our study also provided a demonstration of how tactile cues can be used in UAM vehicles as part of an alerting system. We found little difference between whether the tactile alerts were administered on the arms or thighs or whether they provided directional information or not. The lack of an effect of directionality can be due to the low workload for the scenarios we examined. Future works should examine the effectiveness of the alerts in more complex task environments. However, the findings from the present study show that a tactile alerting system is feasible and that participants rated it high in terms of usability and trustworthiness.
Crowded cities and congested roads have led to the need for development of an air transportation system in these areas. Urban Air Mobility (UAM) refers to an emerging system of passenger and cargo air transportation that operates within an urban area. UAM is not a new concept but has been around for almost 75 years in the form of helicopter passenger transporta- tion. Guinn (1971) noted that early helicopter transportation of passengers to/from airports clearly reduced commute times, but the costs associated with its operations far exceeded the revenues produced from passenger fees. Guinn also indicated that the army’s use of helicopters to transport mail during this period also failed due to the cost of operation and several accidents. The advances in technology over the past several decades and successes in terms
of deployments of small Unmanned Aerial Vehicles (UAVs) and increasingly autonomous aerial operations brought renewed interest in UAM. Although advanced UAM will be supported by a mixture of onboard, remotely opera- ted, and autonomous unmanned aerial systems operations, early operations will likely employ human pilots operating UAM vehicles under conditions that are similar to current-day visual flight rule (VFR) operations (NASA, 2017). The present study examined the use of tactile feedback as an alerting system for a case of early UAM operations, where an onboard pilot operates a simulated UAM vehicle in a virtual environment with optimal VFR condi- tions (i.e., good visibility, no winds or other convective weather). Onboard pilots fly a designated route between two vertiports in the San Francisco area. The UAM vehicle is programmed to fly the route in an automated mode. However, the vehicle deviated from the flight path at various points along the route. When this happens, the automated mode disengaged, and the pilot needs to detect the deviation and manually bring the vehicle back to its inten- ded path. After doing so, the pilot needs to reach a designated point on the route to re-engage the autopilot.
To assist the pilots with detecting the flight deviations, we provided partici- pants with different types of tactile alerts. Tactile alerts were selected because haptic stimulation can be used effectively to signal unexpected events and provide users with a sense of position and movement. Moreover, tactile alerts often result in faster reaction time than visual and auditory alerts for time cri- tical tasks. For example, Sklar (1999) evaluated the effectiveness of different types of cues (visual only, tactile only, and a combination of tactile-visual) for signalling a mode change in a cockpit display during a simulated flight. The tactile alerts were administered on the wrist, with participants wearing a wri- stband with one tactor attached to each side of the wrist. Tactile stimulation to the inner wrist were used to indicate an auto throttle mode transition and stimulation to the outer wrist roll mode transitions. Sklar found that pilots receiving only visual cues detected about 83% of the unexpected mode transi- tions, but pilots receiving either type of tactile alerts were able to detect 100% them. Moreover, the tactile-visual alerts resulted in the most rapid detection times regardless of the pilots’ concurrent activities.
Salzer and Oron-Gilad (2015) examined the effectiveness of directional visual, tactile, and visuo-tactile alerts with the tactors on the thigh of a seated operator. Multiple tactors were placed on the thigh to provide directional cues. Participants performed a flight mission task, where they were asked to steer the aircraft toward landmark targets and had to identify and remember the target in a later memory test. In addition, the participants had to maintain aircraft’s altitude and engage in a directional Alerting Task where they had to respond to a directional visual, tactile, or visuo-tactile cue. The visual cue was a black arrow in the center of the compass rose pointing in one of the eight possible directions. The directional tactile cue was the vibration of one of eight vibrotactors placed around the thigh that corresponded to one of eight directions on a compass rose. Response time for the alerting task was longer for the visual condition (1.7 seconds) compared to the tactile (1.5 seconds) and visuo-tactile (1.4 seconds) conditions, which did not differ
Use of Tactile Alerts in Urban Air Mobility Vehicles 513
significantly from each other. However, accuracy was significantly higher for the visuo-tactile condition (95%) than the tactile only (82%) and visual only (85%) conditions, that did not differ significantly from each other.
Although tactile alerts have been shown to be effective helping pilots detect changes in the system’s state and provide directional information for navi- gation, it has not been explored in the UAM context, where pilots will be supervising more automation while using visual cues from the cockpit in addi- tion to the tactile cues. Thus, the present study examined the effectiveness of tactile cues to help pilots detect deviations from their vehicle’s flight path when using road structures (i.e., freeways) to navigate between two vertiports in an urban environment. Moreover, we examined whether the placement of the tactor (on the arms or thighs) impacted performance and whether a sin- gle tactor can provide directional information by stimulating the left or right side of the pilot.
METHODS
Participants Eleven participants were students recruited from the Mechanical and Aero- space Engineering and Psychology Departments at California State Uni- versity, Long Beach. None had participated in any prior study using our simulated virtual reality environment. Two of the participants indicated that they had prior aviation experience. Data from one participant was excluded due to incomplete trials, resulting in 10 participants (7 male, 3 female) in the analytical sample.
Apparatus and Simulation Environment The simulation was created in Unity3D and implemented in a VisCube Cave Automatic Virtual Environment (CAVE) VR system (Visbox, Inc.) of approximately 8ft (H) x 8ft (D) x 12ft (W), with an 8-camera Advanced Real-Time (ART) tracking system (Shankar, 2022 and Marayong, 2020). The virtual cockpit contains an integrated display for speed, altitude, and a mini- map showing the vehicle position. The map and airspace environment were created using the WRLD3D application programming interface.
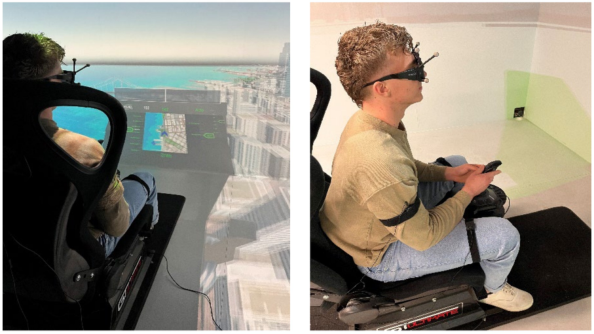
The tactile alerts were given to the pilot using C2 tactors (Engineering Acoustics, Inc.). The pilot wore 4 tactors, one on each thigh and upper arm, and 3D anaglyph glasses, which were used for head tracking with the ART system (Figure 1). The pilot used a Logitech Attack3 USB joystick to control the vehicle, which was limited to only planar steering for this study.
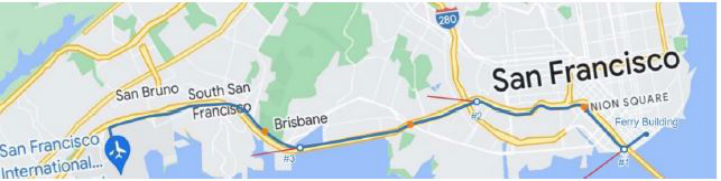
The flights were between the San Francisco Ferry Building and San Fra- ncisco International Airport (SFO) with the path following Interstate 80 and Highway 101, see Figure 2 for a sample flight path from the Ferry Building to SFO. The vehicle started in an autonomous flight mode and navigated along the designated path at a speed of 150 knots and altitude of 800 ft. To simulate the scenarios where pilots divert from the flight path, the autopilot was pro- grammed to veer off-course at three points on each route. After a 3-second delay, the tactile cue was turned on as the autopilot disengaged allowing the
Figure 1: Right: side view of pilot seated in the CAVE simulator with tactors placed on the arms and thighs. Left: back view of pilot seated in simulator with cockpit display and out-the-window view.Figure 2: Sample route, highlighted in blue, to/from the SFO airport and the Ferry vertiports with the diversion points indicated by the white circle along the route. The orange circles represent the target point to re-engage the autopilot.
pilot to manually steer the vehicle back towards the flight path and reach the designated target point (shown visually to the pilots as a yellow circle on the mini-map) and resume autonomous operation. The locations of the diversion points were different between each route.
The tactors were set to output at a frequency of 250Hz for 1.5 seconds at a gain of 255 (maximum amplitude). Two types of tactile cues were provided at the thighs and the upper arms: 1) non-directional alert where the pair on the left and the right side are turned on simultaneously and 2) directional alert where one tactor is activated on the side that corresponds to the corrective direction toward the path. For example, the tactor on the pilot’s right limb was activated if the vehicle must make a right turn to return to the path. For a given condition, tactors were activated either exclusively on the arms or on the thighs.
Study Design and Measures This study employed a 5 (Condition: no tactile cue, arms-non- directional alert, arms-directional alert, thighs-non-directional alert, and thighs-directional alert) x 3 (Target Number: first, second, or third) repeated
Use of Tactile Alerts in Urban Air Mobility Vehicles 515
measures design. Multiple dependent measures were obtained for performa- nce, and we report on the following for this study:
Mean Time to First Movement – This refers to the pilot’s response time computed as the difference between the time when the vehicle switches from autopilot after a diversion to manual mode (same instance as tactile feedback activation) and when the change in vehicle’s heading relative the diverted direction first occurs. A zero Time to First Movement indicates that the pilot started to turn the vehicle prior to the switch.
Accuracy of direction of first movement – The accuracy is determined by comparing the vehicle’s heading relative to the reference direction toward the path.
Time of Return ratio: After the diversion, the pilot can navigate back to the path at any point before the designated target location. The time of return, tr, is determined as the time between the point of tactile cue acti- vation to the first instance where the pilot reached within approximately 55 ft from the path. The time to target, tt, is the total time the pilot took between the point of tactile cue activation and reaching the designated target. The Time of Return ratio is computed as tr/tt. Smaller ratio indica- tes a quicker return to path whereas the ratio of 1 indicates that the pilot did not return to the path before reaching the designated target. Since the distance between different diversion point and target pairs varies, the ratio is used for comparison.
In addition, ratings of workload, trust in automation, and system usa- bility were obtained. Workload was measured using the NASA-TLX (Hart & Staveland, 1988). The NASA TLX measures subjective workload on six dimensions of mental demand, physical demand, and temporal demand, effort, performance, and frustration. Trust in the system was measure using the Trust in Automation Scale (Jian et al., 2000), which consists of 12 items. System Usability was measured using a 10-item System Usability Scale (SUS; Lewis, 2018).
Procedure All participants provided written informed consent upon arrival to the Beach- CAVE laboratory. Participants were provided with a 10-minute PowerPoint presentation that described the goals of the study and provided background information about the task (i.e., routes, displays, and tactile alert configu- rations and conditions). Participants were then seated in the simulator and fitted with the four tactors using Velcro straps. Tactors on the arms were additionally secured in place with Coban self-adherent tape. The participants also wore earplugs to minimize audio feedback during the trials. Then, par- ticipants engaged in two training trials to familiarize themselves with the simulation environment. For both training trials, the participant flew the segment from the Ferry Building to SFO. The flight path was highlighted by an orange overlay to help participants learn the route. Participants also expe- rienced non-directional alerts on the arms and directional alerts on the thighs during training.
After the training, participants engaged in 5 experimental trials, repre- senting each of the 5 cueing conditions (e.g., no cue, arms-non-directional, arms-directional, thighs-non-directional, and thighs-directional). The trials consisted of three routes from the Ferry Building to SFO airport and two returning routes, each with different sets of three diversion points. The order of the conditions was counterbalanced between participants. After each trial, the participants were asked to confirm the alert type that they felt and filled out the NASA TLX. After the last trial, the participants were given the Trust in Automation and SUS questionnaires.
RESULTS
Response Times and Accuracy to Deviations Mean Time to First Movement was submitted to a 3 (Target Number: first, second or third) x 5 (Condition: no tactile cue, arms-non-directional, arms- directional, thighs-non-directional, and thighs-directional) repeated measu- res ANOVA (see Table 1 for means and standard errors). Only the main effect of Target Number was significant, F(2, 18) = 4.07, MSE = 9.75, p = .035, where the Time to First Movement was shorter for the third target (M = 0.36 s) than first (M = 1.30 s) and second (M = 1.89 s) tar- gets. Although the interaction between target number and condition was not significant, we examined whether there were any trends towards statistical significance for condition at each target point. For the first target, the effect of Condition approached significance, F(4,36) = 2.49, p = .061, with the no tactile cue condition showing longer First Movement times compared to the other tactile cue conditions. There was no evidence of an effect for Condition at target locations 2 and 3, F< 1.0, ps > 0.59. There was no significant effect of Condition on the number of correct turns (see Table 2 for frequencies).
Efficiency of Returning to Flight Path Mean Time of Return ratio was submitted to a 3 (Target Number: first, second or third) x 5 (Condition: no tactile cue, arms-non-directional,
Table 1. Means and standard deviations for time to first movement and time of return ratio for each of the three targets in the trial.
Table available in the original PDF paper.
Condition Time to First Movement Mean
Time of Return Ratio Mean
(std. error)
(std. error) T1 T2 T3 Avg T1 T2 T3 Avg
No Tactile Cue 3.54 (1.73)
3.40 (1.87)
0.33 (0.15)
0.44 (0.11)
0.23 (0.09)
0.31 (0.05)
2.42 (2.60)
0.32 (0.07) Arms Non-Directional
0.93 (0.35)
0.56 (0.17)
0.44 (0.16)
0.35 (0.10)
0.24 (0.09)
0.30 (0.05)
0.65 (0.63)
0.29 (0.05) Arms Directional 0.61 (0.25)
2.16 (1.65)
0.31 (0.15)
0.24 (0.08)
0.18 (0.05)
0.37 (0.05)
1.03 (1.68)
0.26 (0.04) Thighs Non-Directional
0.77 (0.32)
0.64 (0.25)
0.37 (0.15)
0.27 (0.08)
0.14 (0.04)
0.35 (0.08)
0.59 (0.49)
0.25 (0.05) Thighs Directional
0.64 (0.31)
2.68 (1.98)
0.34 (0.11)
0.31 (0.11)
0.13 (0.04)
0.42 (0.07)
1.23 (2.12)
0.29 (0.04)
Use of Tactile Alerts in Urban Air Mobility Vehicles 517
Table 2. Frequency of incorrect and correct turns for each target in a trial.
arms-directional, thighs-non-directional, and thighs-directional) repeated measures ANOVA (see Table 1 for means and standard errors). Four par- ticipants did not reach the original flight path but travelled parallel to it for some of the targets (ratio of 1.0). Only the main effect of Target Number was significant, F(2,18) = 16.17, MSE = 0.24, p <.001. The Time of Return ratio was 0.32 for the first target, 0.18 for the second target and 0.35 for the third target.
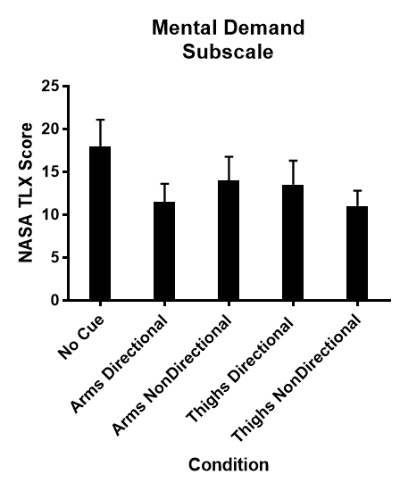
Ratings of Workload, Trust in Automation, and Usability A repeated measures ANOVA was performed with Condition (no tactile cue, arms-non-directional, arms-directional, thighs-non-directional alert, and thighs-directional) as the factor on composite and individual dimension TLX scores. There was a significant effect of Condition for the Mental Demand sub-scale of the TLX, F(4, 36) = 3.28, MSE = 23.42, p = .022 (see Figure 3).
Figure 3: Mean NASA TLX ratings for mental demand.Table 3. NASA TXL composite scores.
Table 4. Trust in automation scale (1 = very inaccurate; 4 = neutral; 7 = very accurate).
Table available in the original PDF paper.
Means for the first five items are not reverse coded in the table.
Sub-Dimensions Mean (sd)
1. The alerting system is deceptive. 2.10 (1.37)
2. The alerting system behaves in an underhanded manner. 2.20 (1.40) 2.00 (1.70)
3. I am suspicious of the alerting system’s intent, action or outputs.
4. I am wary of the alerting system. 2.20 (1.40) 1.30 (0.48)
5. The alerting system’s actions will have a harmful or injurious outcome.
6. I am confident in the alerting system. 6.00 (1.05)
7. The alerting system provides security. 6.10 (0.99)
8. The alerting system has integrity. 5.50 (1.43)
9. The alerting system is dependable. 6.30 (0.95)
10. The alerting system is reliable. 5.60 (1.78)
11. I can trust the alerting system. 5.60 (1.65)
12. I am familiar with the alerting system. 6.00 (1.05)
The effect of Condition was not significant for the other sub-dimensions of the NASA TLX or for the composite scores (see Table 3 for composite means).
The average SUS score was 86.5 (range: 72.50-97.50). Scores over 70 typi- cally indicate that the system is usable, with scores over 85 considered to be very good in terms of usability.
Table 4 shows the means for each of the 12 questions in the Trust in Auto- mation Scale (Jian et al., 2020). Items 1–5 was reversed scored to compute a mean trust score, where higher scores equal more trust. The mean trust score was 5.94 (sd = .96), which was significantly higher than a test value of 5.0 in the 7-point scale, t(9) = 3.11, p = .013.
DISCUSSION
Novice participants, with little training, were able to pilot our UAM vehicle when it deviated from it automated route and bring it back to course. The tactile alerts were more helpful in alerting participants of the first vehicle devi- ation but were less effective for subsequent deviations. This finding is likely due to the easy flight context of the current study. In this study, participants
Use of Tactile Alerts in Urban Air Mobility Vehicles 519
only had to monitor the vehicle for deviations and did not perform any other piloting tasks (e.g., communicate with air traffic control, avoid obstacles and other aircraft, avoid weather). In fact, the workload reported by participants was very low (grand mean of 11.5), which is less than the minimum score of 16 reported for pilots of aircraft in Grier’s (2015) meta-analysis of workload from the NASA TLX. The low workload likely allowed pilots to monitor the flight path and use the visual cues to detect the deviations prior to the tactile alerts, which activated only when the vehicle deviated from its path for more than 3 seconds. It is likely that the effects of the tactile alerts will be greater when pilots are performing other concurrent tasks or in conditions of high workload. The types of the tactile cues (non-directional and directional) and placement location (upper arm and thigh) also show no significant effects.
CONCLUSION
This study provided a demonstration of how tactile cues can be used in UAM vehicles as part of an alerting system. In our study, we found little difference between whether the tactile alerts were administered on the arms or thighs or whether they provided directional information or not. The lack of an effect of directionality can be due to the low workload and easy task employed in this study. Future works should examine the effectiveness of the alerts in more complex task environments. However, the findings from the present study show that a tactile alerting system is feasible and that participants rated it high in terms of usability and trustworthiness.
ACKNOWLEDGMENT
This research was supported in part by NSF Major Research Instrumenta- tion award (Award #1626655), San Jose State Research Foundation Grant #2116145736 (PI: Sean Laraway), and the National Institute of General Medical Sciences of the National Institutes of Health under Award Numbers; UL1GM118979; TL4GM118980; RL5GM118978. The content is solely the responsibility of the authors and does not necessarily represent the official views of the National Institutes of Health.
REFERENCES
Grier, R. A. (2015). How high is high? A meta-analysis of NASA-TLX global workload scores. In Proceedings of the Human Factors and Ergonomics Society Annual Meeting (Vol. 59, No. 1, pp. 1727–1731). Sage CA: Los Angeles, CA: SAGE Publications. Guinn, H. W. (1971, June). A study of the commercial helicopter passenger transpor-
tation industry (Thesis). George Washington University. Retrieved from: https: //archive.org/details/studyofcommerci00guin/page/n1/mode/2up Hart, S. G., & Staveland, L. E. (1988). Development of NASA-TLX (Task Load Index): Results of empirical and theoretical research. In Advances in Psychology (Vol. 52, pp. 139–183). North-Holland. Jian, J. Y., Bisantz, A. M., & Drury, C. G. (2000). Foundations for an empirically
determined scale of trust in automated systems. International Journal of Cognitive ergonomics 4.1, 53–71.
Lewis, J. R. (2018). The system usability scale: past, present, and future. International Journal of Human–Computer Interaction, 34(7), 577–590. Marayong, P., Shankar, P., Wei, J., Nguyen, H., Strybel, T. and Battiste, V. (2020)
Urban Air Mobility system testbed using CAVE virtual reality environment. IEEE Aerospace Conference, pp. 1–7. NASA (2017). NASA Embraces Urban Air Mobility, Calls for Market Study.
Retrieved from: https://www.nasa.gov/aero/nasa-embraces-urban-air-mobility Salzer, Y. & Oron-Gilad, T. (2015). Evaluation of an “On-Thigh” Vibrotactile Collision Avoidance Alerting Component in a Simulated Flight Mission. IEEE Transactions on Human-Machine Systems, vol. 45, no. 2, pp. 251–255. Shankar, P., Marayong, P., Strybel, T., Battiste, V., Nguyen, H., Cheung, J., and
Viramontes, J. (2022) Urban Air Mobility: Design of a Virtual Reality Testbed and Experiments for Human Factors Evaluation. ASME International Mechanical Engineering Congress and Exposition. In Advanced Materials: Design, Processing, Characterization and Applications; Advances in Aerospace Technology (Vol. 3). https://doi.org/10.1115/IMECE2022-95152 Sklar, A. & Sarter, N. B. (1999). Good vibrations: Tactile Feedback in Support of Attention Allocation and Human-Automation Coordination in Event Driven Domains. Human Factors, vol. 41, no. 4, pp. 543–552.
LISTED IN THE AHFE DIGITAL BOOKSTORE CATALOGUE
Explore the complete digital volume
Human Factors in Transportation
Read this individual research paper free through the original publisher, or explore the full digital proceedings book.
ISBN 978-1-958651-71-1
Explore this ISBN in the AHFE Bookstore ↗Listed in the July 2026 bookstore catalogue; search by ISBN to confirm current availability · Digital book purchase optional