Chang Shen, Hua Qin, Shijiao Li, Xipu Shi, CHUANYU ZOU, Linghua Ran (2026). Effect of AR-HUD Warning Information Presentation Modes on Driver Situation Awareness under Single-Hazard Scenarios. In: Usability and User Experience. AHFE Open Access, vol. 232, pp. 368–378. https://doi.org/10.54941/ahfe1008065
Drivers are prone to Cognitive Tunneling while driving. This study aims to discuss which Augmented Reality Head-Up Display (AR-HUD) warning information flashing mode can effectively break this effect when drivers face a single-hazard scenarios.Twelve drivers were recruited for a simulated driving experiment. The study used four warning information flashing modes (non-flashing, 25%, 50%, and 75% flashing duty cycles) and three secondary task immersion levels (low, medium, and high) as independent variables. Reaction time, subjective perception scores, and objective perception accuracy were quantitatively evaluated. The results showed that reaction times tended to increase as secondary task immersion became deeper. The non-flashing mode caused the most severe reaction delays under high immersion conditions. Comparisons revealed that Flashing Mode 2 (50% duty cycle) had the optimal intervention effect. It shortened reaction times by nearly half under high immersion and received the highest subjective scores. Conversely, Flashing Mode 3 (75% duty cycle) had the lowest objective accuracy, indicating that excessive flashing frequency causes visual interference. Therefore, the AR-HUD warning signal in Flashing Mode 2 is the most effective at breaking cognitive tunneling. It significantly shortens reaction times while maintaining high situation awareness. Future AR-HUD interface designs should prioritize this parameter. Designs should also avoid high-frequency flashing strategies that lead to misjudgment, in order to enhance driving safety in complex environments.
As autonomous driving technology advances, drivers increasingly engage in Non-Driving-Related Tasks (NDRTs) (Luo et al., 2024), which can induce cognitive tunneling—a dangerous reduction in environmental perception caused by high focus on secondary tasks (Yamin et al., 2024). To mitigate
Effect of AR-HUD Warning Information Presentation Modes 369 this, Augmented Reality Head-Up Display (AR-HUD) are utilized to enhance situation awareness, guiding drivers to refocus on sudden dangers and improving reaction speeds (Jozef et al., 2023; Deng et al., 2021).
AR-HUD effectively assist driving decisions (Yu et al., 2024). Consequently, current AR-HUD warning designs primarily focus on static presentation and semantic understanding. For instance, using red colors and familiar warning shapes instinctually captures attention (Ling et al., 2019). Furthermore, spatial and semantic consistency between AR-HUD signs and real-world scenes is crucial to prevent cognitive delays (Charissis et al., 2021). To avoid excessive cognitive load, researchers have also proposed optimizing layout and controlling information density (Yunuo et al., 2023; Ma et al., 2024).
However, these static or weakly dynamic designs assume drivers maintain normal attention. In Level 3 autonomous driving, drivers performing NDRTs often experience high cognitive load and cognitive tunneling, significantly reducing their environmental sensitivity (Wang et al., 2022; Hu et al., 2024). Under these conditions, traditional static icons lack the visual impact necessary to capture attention. Thus, the effectiveness of current AR-HUD warnings for highly immersed drivers requires reevaluation.
To address this, dynamic coding (such as flashing and motion) is essential to break cognitive tunneling, as it significantly shortens reaction times compared to static icons (Wu et al., 2024; Winkler and Soleimani, 2025). Current dynamic designs often indicate approaching danger through changing sizes or colors. However, detailed research on flashing frequency and duration is lacking. While flashing is a strong stimulus, overly complex or high-frequency effects can consume excessive cognitive resources and cause visual distractions (Feierle et al., 2019). Identifying an optimal flashing frequency that captures attention without causing discomfort remains an unsolved challenge.
In summary, rather than focusing on single static or dynamic modes, this study systematically investigates AR-HUD flashing modes under varying levels of secondary task immersion. By examining the impact of these modes on driver reaction time and situation awareness in single-hazard scenarios, this research aims to identify the most effective flashing design for breaking cognitive tunneling. Ultimately, this provides a theoretical and practical foundation for optimizing autonomous driving AR-HUD interfaces.
MATERIALS AND METHODS
This study investigates AR-HUD warning signal flashing modes to reduce driver reaction time and mitigate cognitive tunneling. We compared drivers’ reaction times and situation awareness capabilities across different flashing modes and secondary task immersion levels. Independent variables included warning signal flashing mode and secondary task immersion degree, while dependent variables were reaction time, scores on subjective situation awareness questionnaires, and the accuracy rates of objective situation awareness questionnaires.
Participants We recruited 12 university students (10 males, 2 females) in Beijing with valid driver’s licenses, averaging 24 years of age and 4 years of driving experience. All had normal visual acuity and no prior AR-HUD experience. Students were selected for their strong perceptual and cognitive abilities, ensuring accurate reflection of situation awareness changes under varying experimental conditions.
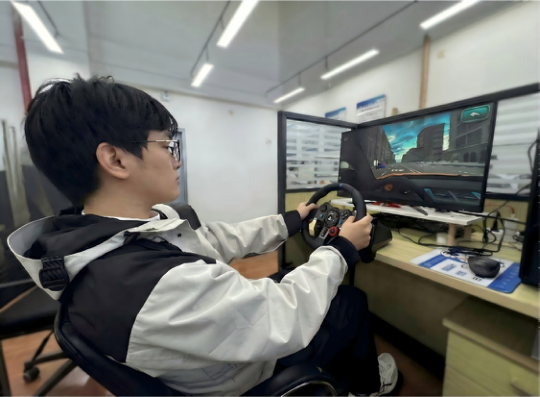
Experimental Platform This experiment utilized Unity 3D software to model the driving environment and warning icons. A total of 12 driving scenarios containing different road information were generated. The experiment aimed to enhance the realism of the autonomous driving simulation. The hardware included an AOC monitor and a Lenovo Legion desktop computer. The monitor size was 17 inches with a resolution of 2560×1440 pixels. The experiment took place in a closed, quiet, and well-lit room without external distractions. The experimental environment is shown in Figure 2.
Figure 2: Experimental environment.
Experimental Variables The experiment adopted a 4×3 two-factor mixed experimental design. The independent variables were the flashing mode of the warning signal and the level of secondary task immersion. Both were within-subject variables.
The display cycle of the warning signal was set to 2 s in the experiment. Its flashing mode was defined as the ratio of the flashing time to the total display cycle of the AR-HUD information. This variable was divided into four levels: No flashing mode (the warning signal neither flashes nor remains constant), Flashing Mode 1 (25% duty cycle), Flashing Mode 2 (50% duty cycle), and Flashing Mode 3 (75% duty cycle). The level of secondary task immersion
Effect of AR-HUD Warning Information Presentation Modes 371 refers to the investment of visual and cognitive resources by the driver during non-primary driving tasks. A higher level of immersion means the driver is more focused. In this experiment, different immersion levels were set primarily through auditory secondary tasks. This variable was divided into three levels: low immersion (no questions + pure music), medium immersion (non-intent- inducing questions + asking questions), and high immersion (intent-inducing questions + asking questions).
Dependent variables included simulator-recorded reaction time (milliseconds from hazard appearance to braking) and situation awareness questionnaire scores. Situation awareness was quantitatively assessed using adapted Situation Awareness Global Assessment Technique (SAGAT) subjective and objective questionnaires completed after each scenario.
Experimental Procedure Following informed consent and instructions, participants completed a pre- experiment to familiarize themselves with the simulator controls. The formal experiment consisted of 12 unique 90-second driving scenario videos, each featuring different hazards, flashing modes, and immersion levels to prevent learning effects. Participants performed corresponding non-driving tasks during the videos. After each video, participants completed the situation awareness questionnaires, followed by a 2-minute rest to alleviate fatigue. The experiment concluded once all 12 independent trials were finished.
RESULTS
Descriptive Statistics
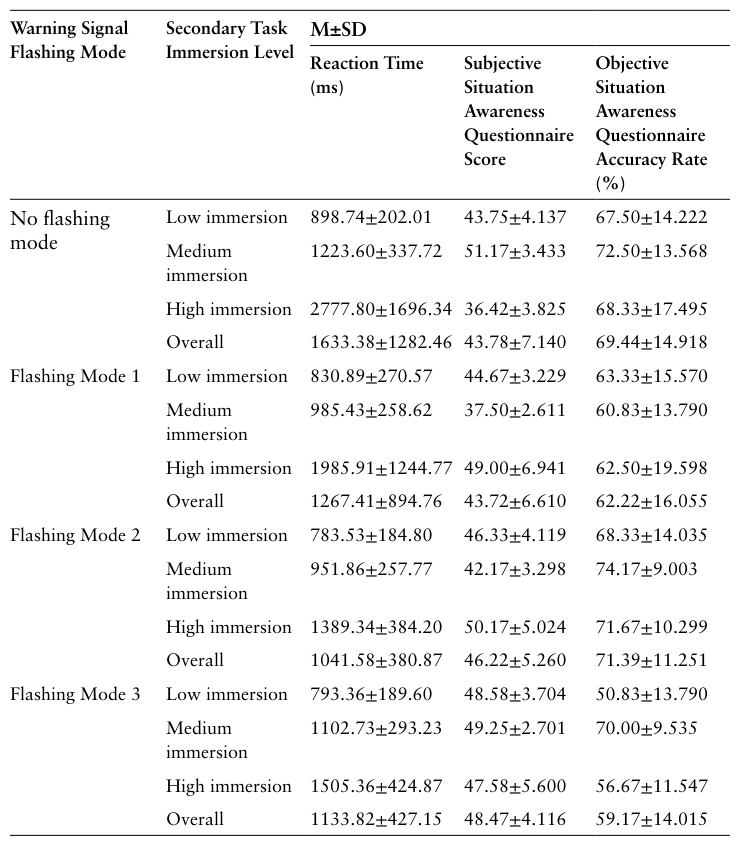
Table 1 presents the statistics for drivers’ reaction times, subjective perception questionnaire scores, and objective perception questionnaire accuracy under different warning signal flashing modes and secondary task immersion levels.
Regarding reaction time, durations extended as secondary task immersion increased. The No flashing mode exhibited the longest reaction time overall (M = 1633.38, SD = 1282.46), peaking under high immersion conditions (M = 2777.80, SD = 1696.34). Conversely, flashing modes effectively reduced reaction times. Flashing Mode 2 (50% duty cycle) yielded the best intervention effect , recording the shortest overall reaction time (M = 1041.58, SD = 380.87) and shortening the time to 1389.34 ms under high immersion. Flashing Modes 1 and 3 also outperformed the No flashing mode.
Regarding subjective perception questionnaire scores, the drivers’ subjective perception scores under the No flashing mode showed a trend of first increasing and then decreasing with increased immersion. The score under high immersion was the lowest (M = 36.42, SD = 3.825). This indicates that the drivers’ situation awareness was poor when there was no flashing mode and the cognitive load was high. In contrast, Flashing Mode 2 achieved the highest subjective score under high immersion, reaching 50.17 (SD = 5.024). This was higher than its scores under low immersion (M = 46.33, SD = 4.119) and medium immersion (M = 42.17, SD = 3.298). Furthermore, Flashing Mode 3 showed the highest overall stability, with the smallest score fluctuations across the three immersion levels.
Regarding objective perception questionnaire accuracy, the influence of secondary task immersion levels on accuracy showed a certain pattern. Accuracy under medium immersion was generally higher than under low and high immersion, demonstrating the best recognition performance. Among the comparisons of different flashing modes, Flashing Mode 2 maintained a high accuracy (M = 71.39, SD = 11.251) and reached the highest accuracy of 74.17% (SD = 9.003) under medium immersion. Additionally, the overall accuracy of the No flashing mode showed large fluctuations across different secondary task immersion levels. In contrast, Flashing Mode 3 (75% duty cycle) had the worst accuracy. Its overall mean was only 59.17% (SD = 14.015). Notably, under low immersion, the accuracy dropped to 50.83%. This indicates that excessively frequent flashing might produce some visual interference.
Table 1: Descriptive statistics results of various indicators under different AR-HUD warning signal flashing modes and secondary task immersion levels.
Effect of AR-HUD Warning Information Presentation Modes 373 ANOVA of Warning Information Flashing Modes
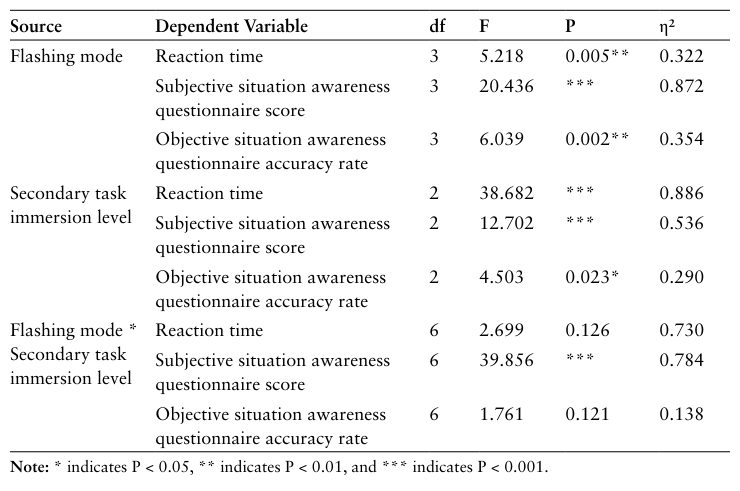
The reaction time, subjective perception questionnaire scores, and objective perception questionnaire accuracy all met the assumptions of homogeneity of variance (P > 0.05) and normal distribution (P > 0.05). Therefore, we analyzed whether significant differences existed in the dependent variables across different levels of the independent variables. The analysis results are shown in Table 2.
Regarding reaction time, the ANOVA results showed that the warning information flashing mode had a significant main effect on driver reaction time (F = 5.218, P = 0.005, η² = 0.322). There were obvious differences in overall reaction times under different flashing modes. Among them, the overall average reaction time of Flashing Mode 2 was the shortest, which was significantly superior to the other three flashing modes. Meanwhile, the main effect of the secondary task immersion level also reached a significant level (F = 38.682, P<0.001, η² = 0.886). This indicates that reaction time tended to extend as the immersion increased. Specifically, under high immersion conditions, the reaction time of the No flashing mode increased to 2777.80 ms (SD = 1696.34). Even under the optimal Flashing Mode 2, the reaction time under high immersion (M = 1389.34 ms) was significantly higher than that under low immersion (M = 783.53 ms). However, the interaction effect between the flashing mode and the secondary task immersion level did not reach a significant level (F = 2.699, P = 0.126). This suggests that the influence trends of various flashing modes on reaction time remained basically consistent across different immersion levels.
Regarding subjective perception questionnaire scores, the main effect of the warning information flashing mode was significant (F = 20.436, P<0.001, η² = 0.872). The main effect of the secondary task immersion level was also significant (F = 12.702, P<0.001, η² = 0.536). More critically, there was a significant interaction effect between the two on subjective scores (F = 39.856, P<0.001, η² = 0.784). This indicates that the trends of subjective scores for different flashing modes varied with changes in the secondary task immersion level. Specific data showed that the score under the No flashing mode decreased as immersion increased. It dropped from 43.75 (SD = 4.137) under low immersion to 36.42 (SD = 3.825) under high immersion, which was the lowest value under all conditions. In contrast, the score of Flashing Mode 2 reached a peak of 50.17 (SD = 5.024) under high immersion. This was significantly higher than its performance under low immersion (M = 46.33) and medium immersion (M = 42.17). Flashing Mode 3 showed high stability. Its scores fluctuated very little across low, medium, and high immersion levels. The data characteristics of this interaction indicate that high-intensity secondary task loads widen the differences in subjective perception caused by different flashing modes.
Regarding objective perception questionnaire accuracy, the main effect of the warning information flashing mode was significant (F = 6.039, P = 0.002, η² = 0.354). In terms of specific values, the overall accuracy of Flashing Mode 2 was the highest, reaching 71.39% (SD = 11.251). Meanwhile, the overall accuracy of Flashing Mode 3 was the lowest, at only 59.17% (SD = 14.015). Additionally, the secondary task immersion level also showed a significant
main effect (F = 4.503, P = 0.023, η² = 0.290). It can be observed that the accuracy under medium immersion was generally higher. For example, in the No flashing mode, the accuracy under medium immersion was 72.50%. This was higher than that under low immersion (M = 67.50%) and high immersion (M = 68.33%). Similarly, Flashing Mode 2 also achieved the highest accuracy for that group under medium immersion (M = 74.17%, SD = 9.003). However, the interaction effect between the flashing mode and the secondary task immersion level on objective accuracy was not significant (F = 1.761, P = 0.121). This indicates that the accuracy advantage of Flashing Mode 2 over Flashing Mode 3 objectively exists regardless of the immersion level.
Table 2: ANOVA results for reaction time, subjective situation awareness questionnaire scores, and objective situation awareness questionnaire.
DISCUSSION
By analyzing the influence of different AR-HUD warning information flashing modes and secondary task immersion levels on driver cognitive tunneling, we found that Flashing Mode 2 demonstrated the most significant advantage in breaking the cognitive tunneling effect. This indicates that the design with an AR-HUD warning signal of 50% duty cycle can effectively alleviate the problem of slow driver reaction speed when facing hazards.
Specifically, regarding reaction time, as the secondary task immersion level increased, the driver’s reaction time extended significantly. This indicates that the increase in cognitive load strengthened the cognitive tunneling effect. When there was No flashing mode, the reaction time under high immersion conditions reached a peak of 2777.80 ms. At this time, traditional static warning icons often fail to provide enough visual impact to attract the driver’s attention when they are highly focused on non-driving
Effect of AR-HUD Warning Information Presentation Modes 375 tasks (Ma et al., 2021). This also confirmed that drivers are more likely to fall into cognitive tunneling under high cognitive load conditions and differ in reacting quickly. This is consistent with the conclusion of the study by Fadden et al. (Fadden et al., 2001). However, Flashing Mode 2 (50% duty cycle) significantly reduced reaction time. Under high immersion conditions, the driver’s reaction time decreased to 1389.34 ms, which was reduced by nearly half. In addition, the analysis results of the main effect of the secondary task immersion level showed high explanatory power in both the F-value and effect size. This proves that cognitive load is an important factor restricting driving safety in complex driving environments (Feierle et al., 2021). Furthermore, the decrease in the F-value for the interaction between the flashing mode and the immersion level further indicates the necessity of introducing external visual interventions on the AR-HUD. Additionally, the 50% duty cycle of the warning information in this study may constitute the optimal change frequency. It most effectively improved the driver’s reaction speed.
Regarding the driver’s situation awareness capabilities, the results of the subjective perception questionnaire scores showed a significant interaction effect between the warning information flashing mode and the secondary task immersion level. Specifically, in the No flashing mode, as the secondary task immersion level increased, the driver’s confidence in their ability to perceive the environment decreased (it was only 36.42 under high immersion). This reflects that the driver may have experienced anxiety and a sense of loss of control (Hwang et al., 2016). However, in Flashing Mode 2, even under high immersion, the driver’s subjective score remained as high as 50.17. This was not only far higher than that in the No flashing mode under high immersion, but even higher than that in the same mode under low immersion. This result indicates that during extremely tense and complex driving moments, a clear and highly conspicuous warning signal not only brought visual stimulation but might have also provided a comforting effect to the driver on a psychological level. It effectively compensated for the decline in the driver’s ability to perceive driving environment information caused by highly focused attention. This finding confirms the research conclusion of Yunuo et al. (Yunuo et al., 2023). Therefore, the driver’s preference for Flashing Mode 2 indicates that when facing a single hazard, users may tend to sacrifice some visual comfort (for example, slight discomfort caused by high-frequency flashing) to exchange for certainty in confirming the danger.
It is worth noting that another finding of this study is based on the conclusion of existing research that flashing icons provide stronger stimulation than static icons (Hou et al., 2025). It further confirmed that different warning information flashing frequencies have different effects on alleviating cognitive tunneling. It also excluded the hypothesis that a faster warning information flashing frequency is necessarily better. For example, although Flashing Mode 3 (75% duty cycle) was designed to simulate the highest urgency level, its overall performance was inferior to Flashing
Mode 2. Its objective perception questionnaire accuracy even dropped to the lowest level (59.17%). Especially under low immersion, the accuracy was only 50.83%. This analysis result suggests that although the 75% high- frequency flashing increased the stimulus intensity on a physical level, an excessively high flashing time ratio meant that the icon switched between on and off states too frequently. This might have interfered with the driver’s semantic analysis and judgment of the icon content. Meanwhile, although Flashing Mode 2 had the best overall effect, regarding the accuracy of the driver identifying hazards, this advantage was not obvious in all situations. Under medium immersion, the accuracy of Flashing Mode 2 was particularly high (74.17%), which was significantly better than other modes. However, under low immersion and high immersion secondary tasks, the difference between it and other modes was not obvious, and they were all relatively stable. The above two points indicate that when designing AR-HUD warning information signs, we cannot only look at the driver’s reaction speed. We must also consider whether the driver can accurately perceive and judge hazards under different cognitive load conditions to ensure driving safety is maximized.
CONCLUSION
This study provides a new theoretical basis and insights for the design of AR-HUD systems. A single warning information display mode can no longer adapt to all driving scenarios. Therefore, future AR-HUD systems should possess the capability to monitor the driver’s cognitive state. For example, the system can monitor the driver’s cognitive load in real-time through driving operation behaviors. When the system detects that the driver is in a low load state (such as smooth cruising or listening to music), the AR-HUD can adopt a milder warning information flashing mode (such as a 25% duty cycle) or a static highlighting mode. This helps to avoid unnecessary visual interference. However, once the system detects that the driver falls into a high cognitive load (such as processing complex navigation, answering phones, or facing complex road conditions) or shows signs of distraction, the system can immediately and automatically switch to a stronger intervention mode (Flashing Mode 2 verified in this study). This can re-arouse the driver’s attention allocation. Given the low accuracy shown by Flashing Mode 3, designers should use high-frequency and long-cycle flashing strategies with caution. This prevents visual identification obstacles regarding hazards caused by excessive warnings. Future research can further explore the design optimization of flashing modes under multiple-hazard scenarios. This aims to more comprehensively solve the problem of the driver cognitive tunneling effect.
ACKNOWLEDGMENT
This work was supported by the Beijing Social Science Fund (Grant No. 25BJ03289) and the Research on Construction Technology of Morphological Digital Standard Human Models (Grant No. 2023YFF0615902).
REFERENCES
Charissis, V., Falah, J., Lagoo, R., Alfalah, S. F., Khan, S., Wang, S., ... & Drikakis, D. (2021). Employing emerging technologies to develop and evaluate in-vehicle intelligent systems for driver support: infotainment AR HUD case study. Applied Sciences, 11(4), 1397. Deng, N., Ye, J., Chen, N., & Yang, X. (2021). Towards stereoscopic on-vehicle
AR-HUD. The Visual Computer, 37(9), 2527–2538. Fadden, S., Ververs, P. M., & Wickens, C. D. (2001). Pathway HUDs: are they viable?. Human Factors, 43(2), 173–193. Feierle, A., Beller, D., & Bengler, K. (2019). Head-up displays in urban partially
automated driving: Effects of using augmented reality. In 2019 IEEE Intelligent Transportation Systems Conference (ITSC), pp. 1877–1882. Feierle, A., Schlichtherle, F., & Bengler, K. (2021). Augmented reality head-up display: A visual support during malfunctions in partially automated driving?. IEEE Transactions on Intelligent Transportation Systems, 23(5), 4853–4865. Hou, G., Dong, Q., & Wang, H. (2025). The effect of dynamic effects and
color transparency of AR-HUD navigation graphics on driving behavior regarding inattentional blindness. International Journal of Human–Computer Interaction, 41(12), 7581–7592. Hu, W., Zhang, T., Zhang, Y., & Chan, A. H. S. (2024). Non-driving-related tasks and drivers’ takeover time: A meta-analysis. Transportation research part F: traffic psychology and behaviour, 103, 623–637. Husár, J., Hrehova, S., Knapčíková, L., & Trojanowska, J. (2022). Comparison of the
Principles of Head-Up Display Technologies forthe Implementation of Augmented Reality in the Automotive Industry: AStudy. In EAI International conference on management of manufacturing systems, pp. 15–29. Hwang, Y., Park, B. J., & Kim, K. H. (2016). Effects of augmented-reality head-up display system use on risk perception and psychological changes of drivers. Etri Journal, 38(4), 757–766. Ling, B., Bo, L., Bingzheng, S., Lingcun, Q., Chengqi, X., & Yafeng, N. (2019). A
cognitive study of multicolour coding for the head-up display (HUD) of fighter aircraft in multiple flight environments. In Journal of Physics: Conference Series, 1215(1), 012032. Luo, R. Q., Cao, H. M., Du, Q. Q., Zhu, Y. (2024). Coupled causal analysis of highway accidents based on distracted driving behavior in diffe rent seasons. Science Technology and Engineering, 24(32), 14049–14055. Ma, J., Li, Y., & Zuo, Y. (2024). Design and Evaluation of Ecological Interface of
Driving Warning System Based on AR-HUD. Sensors, 24(24), 8010. Ma, X., Jia, M., Hong, Z., Kwok, A. P. K., & Yan, M. (2021). Does augmented-reality head-up display help? A preliminary study on driving performance through a VR-simulated eye movement analysis. Ieee Access, 9, 129951–129964. Wang, Y. F., Chen, H. L., Zhao, X. H., Li, H. J., Li, Z. L., Fu, Q. (2022). AStudy
on the Impact of Immersion Levels of Non-driving-related Tasks on Takeover Behavior. Traffic information and safety, 40(01), 135–143.
Winkler, M., & Soleimani, M. (2025). A review of augmented reality heads up display in vehicles: Effectiveness, application, and safety. International Journal of Human–Computer Interaction, 1–16. Wu, Z., Liang, Y., Liu, G., & Ai, X. (2024). Comparative Analysis of AR-HUDs
Crash Warning Icon Designs: An Eye-Tracking Study Using 360° Panoramic Driving Simulation. Sustainability, 16(21), 9167. Yamin, P. A., Park, J., & Kim, H. K. (2024). In-vehicle human–machine interface guidelines for augmented reality head-up displays: A review, guideline formulation, and future research directions. Transportation Research Part F: Traffic Psychology and Behaviour, 104, 266–285. Yu, K., Du, D., Yu, D., Zhi, J., Wang, Y., & Jing, C. (2024). Effects of a color gradient
and emoji in AR-HUD warning interfaces in autonomous vehicles on takeover performance and driver emotions. Traffic injury prevention, 25(5), 714–723. Yunuo, C., Xia, Z., & Liwei, T. (2023). How does AR-HUD system affect driving behaviour? Evidence from an eye-tracking experiment study. International journal of vehicle design, 92(1), 1–21.
LISTED IN THE AHFE DIGITAL BOOKSTORE CATALOGUE
Explore the complete digital volume
Usability and User Experience
Read this individual research paper free through the original publisher, or explore the full digital proceedings book.
ISBN 979-8-950676-08-6
Explore this ISBN in the AHFE Bookstore ↗Listed in the July 2026 bookstore catalogue; search by ISBN to confirm current availability · Digital book purchase optional