Linghua Ran, Xin Zhang, Zhao Chaoyi, He Zhao, Zhongting Wang, Yue He (2026). Body Types of Chinese Adult Males. In: Human Factors in Simulation, Software and Systems Engineering. AHFE Open Access, vol. 220, pp. 145–151. https://doi.org/10.54941/ahfe1007702
To understand the body characteristics of Chinese adult males, a sample of males aged 18–60 in China was selected. Using factor analysis, two common factors influencing male body types were extracted from 22 measurement items. Based on correlation analysis, five characteristic variables were selected. The k-means clustering method was then applied to classify Chinese adult male body types into six categories. This study on the analysis and classification of Chinese adult male body characteristics can provide a foundation for constructing different types of human body models.
When constructing human body models based on a human body database, body type analysis is an indispensable step. By analyzing key dimensions, body type classification, and distribution, it ensures that the generated models are representative and accurate, thereby meeting the requirements of applications such as ergonomic simulation and product design. Typical models reflect the average body characteristics of the target population and possess statistical significance. They provide reference standards for product design and ergonomic evaluation and they serve as the basis for simulation analysis, used to test the generalizability of designs. This study is based on Chinese adult human body dimension data collected between 2014 and 2018. Principal Component Analysis (PCA) was used to reduce the dimensionality of human body parameters, and adult male body types were clustered into six categories, providing a foundation for establishing different types of human body models.
DATA SOURCES This study selected Chinese adult human body dimension data collected from 2014 to 2018, with a male sample size of approximately 10,000 individuals aged 18–60 years. Data collection was conducted using non- contact 3D scanning, employing the Vitus Smart laser 3D body scanner from Human Solutions GmbH, Germany. The definitions of measurement items were consistent with GB/T 5703-2010; the 3D scanning procedure followed GB/T 23698-2009. Participants wore only tight-fitting underwear and a measurement cap, and were not allowed to wear jewelry or watches. They
stood naturally, eyes looking straight ahead, feet parallel, arms abducted, breathing normally, and tried to avoid unnecessary movement.
Outlier and anomalous value detection and removal were performed on the anthropometric sample using statistical analysis software. Non-parametric Kolmogorov–Smirnov (K-S) tests and normal probability P-P plots were used to assess data normality. Results showed that all measurement items followed or approximately followed a normal distribution.
FACTOR ANALYSIS OF ADULT MALE BODY TYPES Principal Component Analysis (PCA)
When conducting statistical analysis on multivariable problems, having too many variables increases the complexity of the task. In many cases, variables are correlated; when two variables exhibit a certain degree of correlation, it implies some overlap in the information they reflect. PCA transforms a large number of original indicators into a smaller set of comprehensive indices while retaining as much of the original information as possible. Its main advantage lies in dimensionality reduction-low-variance components are discarded, so the entire dataset is not required to approximate the original model.
In this study, PCA was applied to human body dimension data to identify components that significantly influence body shape. The major contributing indicators within each principal component were determined based on their coefficients and correlations with the original variables.
Extraction of Characteristic Variables Anthropometric measurements mainly include two types of imensions:Length dimensions, which primarily determine skeleton length and locate cross- sectional positions along the body in modeling;Girth dimensions, which ensure that the constructed surface model has realistic cross-sectional sizes.
Referring to GB/T 5703-2010, we compiled a set of human body characteristic parameters and selected 22 major dimensions for further analysis: height, weight, eye height, shoulder height, standing elbow height, functional hand height, perineum height, tibial height, upper arm length, forearm length, thigh length, calf length, maximum shoulder breadth, biacromial breadth, chest breadth, hip breadth, chest depth, upper arm girth, chest circumference, waist circumference, hip circumference, and thigh circumference.
PCA was performed on these 22 dimensions to extract principal components and simplify body type classification indicators. The Kaiser– Meyer–Olkin (KMO) measure and Bartlett’s test yielded values of 0.920 and 0.917 respectively for males aged 18–60, both showing significant differences (P < 0.001), indicating suitability for principal component extraction.
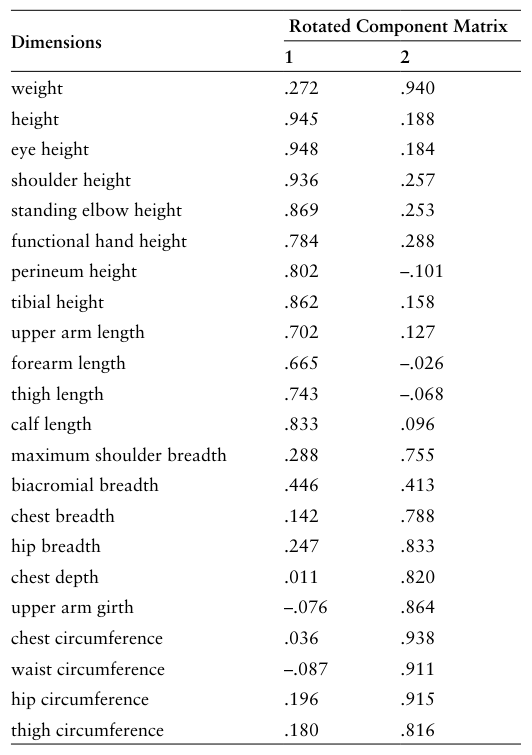
According to the criterion of eigenvalues greater than 1, two principal components F1 and F2 were extracted, accounting for cumulative variances of 72.932% and 70.795% respectively. These two components explain the majority of the information contained in the original 22 characteristic variables. F1 had larger loadings on length dimensions, especially height and eye height, and thus comprehensively reflects body length. It was named
Body Types of Chinese Adult Males 147 the Length Factor. F2 had larger loadings on girth dimensions, particularly weight and chest circumference, and thus comprehensively reflects body girth. It was named the Girth Factor.
Varimax rotation (orthogonal rotation maximizing variance) was applied to the factor loading matrix to obtain rotated component loadings for each variable. The rotated component matrix is shown in Table 1.
Table 1: The rotated component matrix.
CLUSTERING ANALYSIS OF MALE BODY TYPES Clustering Analysis Method
Clustering refers to grouping data objects into multiple classes or clusters, where objects within the same cluster have a high degree of similarity, while objects in different clusters differ significantly. The purpose of clustering is to divide a large collection of data points into several groups so that data within each group are as similar as possible, while data across different groups are as dissimilar as possible.
In this study, k-means clustering was used to analyze the data. The k-means clustering algorithm is a classic approach for clustering problems; it is simple, fast, and maintains scalability and efficiency when dealing with large datasets. There have been numerous studies applying k-means clustering to human body shape analysis. For example, Yuan Shiting (Yuan et al., 2022) used k-means clustering to classify the body shapes of overweight adult women in the Yangtze River Delta region into A, O, H, and V types. Ma Shuai (Ma et al., 2025) employed k-means clustering to classify the body shapes of Chinese male pilots, finding that girth and height factors are the main features influencing the body morphology of Chinese male pilots. Their results divided Chinese male pilots into three body types- overweight, lean, and standard-and calculated the median models for each type based on the findings.
Clustering Process The k-means algorithm uses Euclidean distance as the similarity measure to find the optimal classification corresponding to a given initial cluster center vector, adopting the sum of squared errors (SSE) criterion function as the clustering criterion.
The k-means clustering process is as follows: Step 1 - Determine the number of clusters and calculate the F-statistic:For the total sample, cluster numbers ranging from 3 to 8 are tested.
Step 2 - Randomly initialize the centroid of each cluster:Randomly select initial cluster centers for each small group.
Step 3 - Calculate distances and assign samples to clusters: Compute the Euclidean distance from each sample to the centroid of each cluster. Assign each sample to the cluster whose centroid is closest, according to the minimum-distance principle. After assignment, recalculate the new centroids of each cluster, completing one iteration.
The Euclidean distance formula is: k
2
(1)
x y
Equation available in the original PDF paper.
i i i
1 EUCLID ( )
Among them, k represents the number of variables for each sample; xi denotes the value of the first sample on the i-th variable; yi denotes the value of the second sample on the i-th variable.
Step 4 - Re-determine the center of each cluster: Calculate the mean value of each variable within each cluster, and use these means as the new cluster centers.
Step 5 - Repeat the above two steps:Iterate the calculation process until the termination condition for iteration is met.
Step 6 - Determine the optimal number of clusters: Based on the steps described above, the optimal number of clusters is obtained. According to the
Body Types of Chinese Adult Males 149 body type characteristics of each cluster, the human body type classification is interpreted and defined.
Clustering Results of Adult Male Body Types From the two major factors identified in the factor analysis, five variables were selected: weight, height, leg length, maximum shoulder breadth, and chest circumference. K-means clustering was then applied for body type classification.
The analysis found that when male body types were divided into six clusters, ANOVA results and the sample size of each cluster showed that the between-group mean squares of the five independent variables were far greater than the within-group error mean squares; The distances between clusters and the number of samples in each cluster were fairly uniform; The probability of the null hypothesis (no difference between groups) being true for the two independent variables was almost zero, indicating that the differences between clusters were sufficiently large; The six body types exhibited clear and interpretable distinctions.The proportion of samples for each body type is shown in Table 2.
Table 2: Proportion of individuals in each of the six male body type categories.
Table available in the original PDF paper.
Body Type Category Proportion (%) of Each Body Type
1 10.74%
2 19.43%
3 14.93%
4 20.53%
5 20.40%
6 13.96%
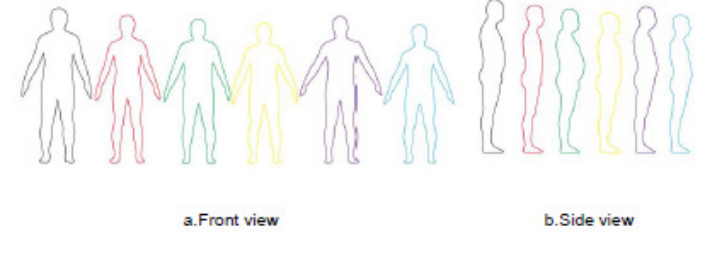
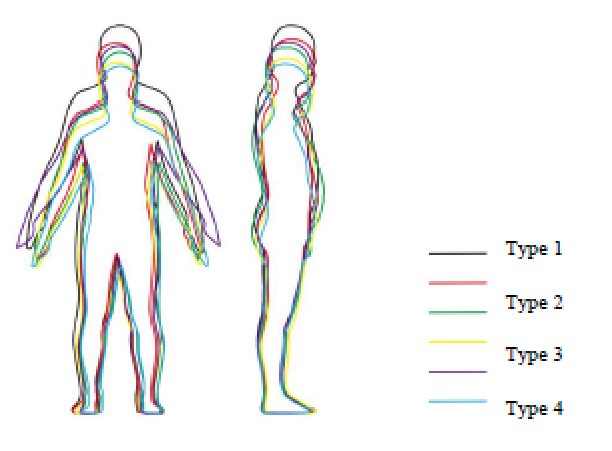
Figures 1–2 present comparative illustrations of the differences among various male body types through body silhouettes.
Figure 1: Body silhouette diagrams of different male body types.Figure 2: Comparison of body silhouettes across different male body type categories.
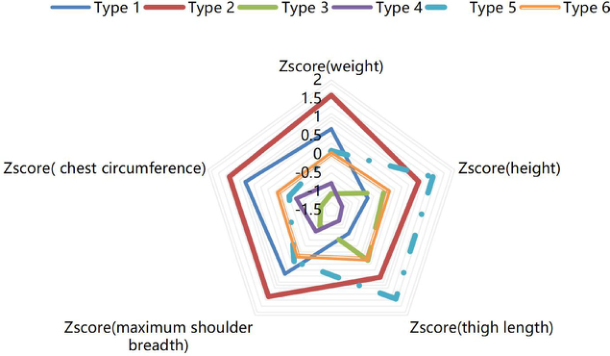
Variable standardization eliminates the effects of units and inherent variation among variables. In this study, the standard deviation standardization method (z-score normalization) was used to standardize the classification variables for each category. This method subtracts the mean value of a variable from each observed value and then divides by the standard deviation of that variable.
Radar charts were drawn based on the standardized values to more intuitively analyze and compare the differences among the six body type clusters, as shown in Figure 3.
Figure 3: Radar chart of body types after data standardization.
Body Types of Chinese Adult Males 151 From the radar chart, it can be seen that: Type 1 males are taller in height, with moderate weight and relatively narrow shoulders (slender-tall type). Type 2 males are slightly taller, with moderate weight and well-proportioned body (medium-well proportioned type). Type 3 males have medium height, are clearly overweight, and have broader shoulders (stocky type). Type 4 males are slightly shorter, with moderate weight and relatively broad shoulders (short-stocky type). Type 5 males have medium height, lighter weight, and narrower shoulders (medium-slender type). Type 6 males are shorter in height and lower in weight (short-slender type).
CONCLUSION
The body shape differences among Chinese adult males are mainly reflected in height and girth, with the common factors comprising a height factor and a girth factor. By extracting characteristic variables from these common factors, Chinese adult male body types can be classified into six categories: slender- tall, medium-well proportioned, stocky, short-stocky, medium-slender, and short-slender. The sample proportions for each type are 10.74%, 19.43%, 19.43%, 20.53%, 20.40%, and 20.40%, respectively. This study can provide a foundation for constructing different types of human body models.
ACKNOWLEDGMENT
This work is supported by the National Key R&D Program of China (project number 2023YFF0615902).
REFERENCES
Ma Shuai, Zhang Xilin, Huang Kuan, Wang Wei, Qu Jue, Classification of Body Shape Characteristics of Chinese Male Pilots. Journal of Textile Research, Vol. 46, No. 1, Jan, 2025. Yuan Shiting, Wang Zhaohui. Study on the body features and classification of
obese adult women in Yangtze River Delta [J]. Basic Sciences Journal of Textile Universities, 2022, 35 (2): 36–43.
LISTED IN THE AHFE DIGITAL BOOKSTORE CATALOGUE
Explore the complete digital volume
Human Factors in Simulation, Software and Systems Engineering
Read this individual research paper free through the original publisher, or explore the full digital proceedings book.
ISBN 978-1-964867-96-0
Explore this ISBN in the AHFE Bookstore ↗Listed in the July 2026 bookstore catalogue; search by ISBN to confirm current availability · Digital book purchase optional