Yusuke Sugita, Taro Kanno, Yingting Chen, Yuta Yoshino, Shuhei Watanabe (2026). Exploring Meeting Dynamics Indicators using Keyword Co-occurrence Networks. In: Human Factors, Business Management and Society. AHFE Open Access, vol. 215, pp. 372–379. https://doi.org/10.54941/ahfe1007618
One promising approach to improving meeting efficiency and productivity is to support meetings through in-meeting interventions based on real-time monitoring of meeting dynamics. This study investigates the validity of meeting dynamics indicators computed using Keyword Co-occurrence Networks and principal component analysis, which were proposed in our previous study. More specifically, this study examines the relationship between these indicators and meeting quality, as well as their context dependence, to clarify their applicability to monitoring and supporting meeting states. Verbal data collected from real-world corporate meetings and controlled meeting experiments were analyzed. Meeting dynamics indicators were computed from the spoken content of the meetings, and their relationships with perceived meeting processes and objective meeting outcomes were assessed using correlation analyses and analyses of variance. These analyses were used to evaluate the validity and context dependence of the indicators. The results indicate that the indicators are more strongly associated with perceived meeting performance than with objective meeting outcomes, and that their interpretation and effectiveness depend strongly on meeting type, including its structure. Overall, these findings suggest that meeting dynamics indicators can function as metacognitive cues that help participants reflect on their current meeting state in intervention settings, and that they may serve as practical indicators to support monitoring of meeting states and iterative improvement cycles for meeting processes.
Meetings are a core activity in which teams and organizations share information, generate ideas, and make decisions. Consequently, meeting quality can have a substantial impact on organizational performance. However, meetings often fail to deliver outcomes that justify the time and resources invested in them (Perlow et al., 2017; Niculae and Danescu- Niculescu-Mizil, 2016). Improving meeting efficiency and productivity requires support and intervention methods grounded in objective indicators. Our prior work proposed meeting dynamics indicators derived as principal Received March 5, 2026; Revised April 7, 2026; Accepted April 23, 2026; Available online July 20, 2026
Exploring Meeting Dynamics Indicators Using Keyword Co-Occurrence Networks 373 components of multiple network metrics of a Keyword Co-occurrence Network (KCN) constructed from meeting transcripts, which are expected to capture how discussions evolve over time (Chen et al., 2025). Despite this promise, two issues remain insufficiently examined. First, the validity of these indicators—namely, the extent to which they correspond to meeting quality—has not yet been confirmed. Second, their context dependence remains unclear, as the indicators may change in meaning and usefulness depending on meeting type and situational conditions.
This study addresses these gaps by examining meeting dynamics indicators in both real-world corporate meetings and controlled meeting experiments. Specifically, it aims to assess their validity and context dependence and to clarify their applicability to monitoring meeting states and supporting meeting interventions.
MEETING DYNAMICS INDICATORS Meeting dynamics indicators are derived from a Keyword Co-occurrence Network (KCN) built from meeting transcripts. A KCN is an undirected graph representing the co-occurrence among keywords in speech: keywords appearing in an utterance are treated as nodes, and an edge is added between two nodes when the corresponding keywords appear within the same utterance. Two types of KCNs, the accumulated and non-accumulated KCN, are constructed at each utterance time point. The accumulated KCN aggregates all co-occurrences from the beginning of the meeting up to the current time, capturing the global discussion structure formed so far. The non-accumulated KCN is constructed using only utterances within the most recent 5 minutes (a sliding window), capturing local and transient structures. For each KCN, a set of network metrics, such as the number of nodes, the number of edges, average degree, modularity, clustering coefficient, entropy and conditional entropy, is computed over time, producing a multivariate time series of network measures indexed by utterance. Principal component analysis (PCA) is then applied to these time-series measures to extract major components characterizing the KCN. PCA is performed separately for the accumulated and non-accumulated networks, and the first three principal component scores are used as meeting dynamics indicators. The k-th component is denoted Acc-k for the accumulated network and Non-k for the non-accumulated network, respectively.
TASK ACHIEVEMENT RATINGS Meeting process quality is assessed using task achievement ratings. Following Ishii et al. (2025), which describes 11 types of tasks required for effective meetings, the achievement of each task is evaluated on a five-point Likert scale in the present datasets. In real-world corporate meetings, ratings are provided by third-party evaluators, whereas in controlled meeting experiments they are provided by the participants themselves. The 11 tasks are grouped into three categories: Directing (behaviors that set and manage meeting direction), Sharing (behaviors that communicate ideas and information), and Supporting
(behaviors that facilitate discussion and collaboration). For each meeting, the overall mean across all tasks and the mean within each category are computed and used as task achievement measures. These measures serve as process-based indicators of meeting quality when examining meeting dynamics indicators. Both overall and category-level scores are used in the analyses.
ANALYSIS 1: REAL-WORLD CORPORATE MEETINGS Real-world corporate meeting data were analyzed to examine the correlation between meeting dynamics indicators and task achievement ratings. The dataset comprises 53 meetings from six corporate teams engaged in new product and service development. Meeting dynamics indicators were computed from transcripts using the accumulated and non-accumulated KCNs described in Section 2.1. For each meeting, time-weighted mean values of the six indicators (Acc1–Acc3 and Non1–Non3) were calculated to obtain meeting-level summary scores. These scores were then compared with task achievement ratings provided by third-party evaluators, who assessed each meeting by reviewing the meeting video and transcript. Associations between the indicators and task achievement ratings were assessed using Spearman’s rank correlation to capture monotonic relationships.
Table 1 summarizes the correlation coefficients for the overall and category-level task achievement ratings; statistically significant correlations (p < .05) are shown in bold. Acc1, which reflects overall discussion expansion at the meeting level, showed a significant positive correlation with the overall mean task achievement score. At the category level, the accumulated- network indicators (Acc1–Acc3) exhibited significant positive correlations with Directing, which captures behaviors related to setting and managing the direction of the meeting. In contrast, the non-accumulated indicators (Non1– Non3) showed only weak associations with all rating measures. These results suggest that, in the corporate meeting dataset, accumulated-network-based meeting dynamics indicators are more likely to reflect process quality, particularly aspects related to directing and managing discussion. The limited associations observed for non-accumulated indicators may also indicate that aggregating them into a single meeting-level mean obscures their potential value; analyses that focus on within-meeting temporal variation, such as phase-specific patterns or time-varying trajectories, may be more appropriate for capturing the dynamics represented by non-accumulated indicators.
Table 1: Correlations between meeting dynamics indicators and task achievement ratings.
Controlled meeting experiments were conducted and analyzed to examine correlations between meeting dynamics indicators and task achievement ratings, and to evaluate the context dependence of the indicators across meeting types. The experiments focused on problem-solving meetings using a cafe management simulator (Chen et al., 2023) and comprised 55 meetings in total. Participants worked in teams of three and discussed operational decisions such as pricing, labor costs, and advertising budgets. Given a set of input conditions, the simulator generated performance outputs such as monthly profit and sales volume. As in Analysis 1, meeting dynamics indicators were computed from transcript data, and time-weighted mean values were calculated to obtain meeting-level summary scores. Comparing the PCA loading patterns between the corporate meeting dataset and the controlled experiment dataset, the first principal component was broadly similar, whereas the second and third components exhibited substantially different loading structures. These scores were examined in relation to (i) task achievement ratings provided by the participants themselves and (ii) objective meeting outcomes derived from the simulator inputs or outputs. Associations with both the task achievement ratings and the objective outcomes were assessed using Spearman’s rank correlation.
Table 2 summarizes the correlation coefficients between meeting dynamics indicators and task achievement ratings (overall and category-level); statistically significant correlations (p < .05) are shown in bold. In the controlled meeting experiments, the non-accumulated indicators Non1 and Non2 showed relatively strong positive correlations with the overall task achievement score, with particularly large associations for Sharing and Supporting. This pattern contrasts with the corporate meeting dataset, where accumulated-network indicators were primarily associated with Directing. This contrast suggests that meeting dynamics indicators depend strongly on contextual factors such as meeting goals and structure. The cafe management simulation experiments represent problem-solving discussions centered on cooperative exploration and trial-and-error, aiming to identify better decision variables under a single objective (profit maximization). Because the goal is narrowly defined and the meeting phases are largely constrained to problem solving, aggregated values of non-accumulated indicators may still capture meaningful variations in perceived process quality. Moreover, in meetings characterized by cooperative exploration, transcript-derived indicators are likely to reflect behaviors related to Sharing (exchanging ideas and information) and Supporting (facilitating discussion and collaboration). Overall, these findings indicate that meeting dynamics indicators do not carry a universal interpretation across meeting types; rather, the indicators that align with subjective task achievement ratings— and the task categories they best reflect—vary substantially depending on the purpose and structure of the meeting.
Table 3 summarizes the correlation coefficients between meeting dynamics indicators and objective meeting outcomes; statistically significant correlations (p < .05) are shown in bold. Only Acc2 and Non2 showed significant correlations with the objective outcomes, whereas first-component- based indicators such as Acc1 and Non1 were not associated with objective
performance. This pattern suggests that objective outcomes may not be explained by simple quantity-related characteristics captured by the first principal component—such as overall discussion expansion or utterance volume—but may instead relate to more complex connectivity structures or interaction patterns. At the same time, indicators based on the second and later principal components are more sensitive to the meeting context and can vary substantially in their loading structure and interpretation across datasets. Because these later components can vary across meeting types, it is difficult to conclude that meeting dynamics indicators are consistently related to objective outcomes.
Table 2: Correlations between meeting dynamics indicators and task achievement ratings.
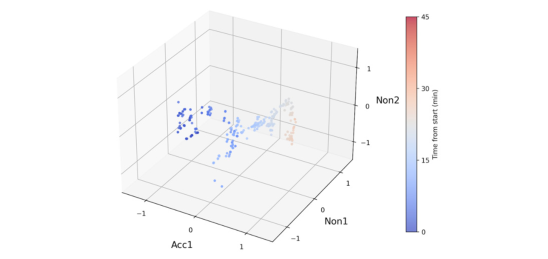
CLUSTER ANALYSIS IN CONTROLLED MEETING EXPERIMENTS Cluster analysis was conducted on the data from 55 controlled meeting experiments. To capture not only meeting-level aggregated scores but also within- meeting distributions, the full time-series of meeting dynamics indicators within each meeting was plotted in three-dimensional indicator spaces. Specifically, three 3D spaces were constructed: (i) a space spanned by Acc1, Non1, and Non2, which were identified as relevant in the correlation analysis, (ii) a space spanned by Acc1–Acc3 (accumulated indicators), and (iii) a space spanned by Non1–Non3 (non-accumulated indicators). In each space, a single meeting was represented as a point cloud formed by all time points within that meeting. Next, meetings were clustered based on the distribution of their point clouds in the indicator spaces (see Figure 1). For each meeting, the indicator values were
Exploring Meeting Dynamics Indicators Using Keyword Co-Occurrence Networks 377 represented as a probability distribution, and pairwise dissimilarities between meetings were quantified using the Hellinger distance. Hierarchical clustering was then applied to the resulting distance matrix. The hierarchical clustering initially yielded six clusters; after excluding clusters with very small sample sizes, the remaining major clusters were retained for subsequent analysis. Finally, one- way ANOVA was conducted to test whether the mean values of task achievement ratings and simulator input/output measures differed across clusters, thereby assessing the extent to which cluster membership explains perceived meeting quality and objective meeting outcomes.
Figure 1: Example meeting point cloud in the Acc1–Non1–Non2 indicator space, colored by time from meeting start.
Table 4 summarizes the one-way ANOVA results for task achievement ratings across meeting clusters; table entries are F-statistics, and statistically significant effects (p < .05) are shown in bold. Between-cluster differences in task achievement ratings were observed in the Acc1-Non1-Non2 space and the Non1-Non2-Non3 space, in other words, in indicator spaces that include non- accumulated-network-based components. At the category level, the between- cluster differences were found mainly for Sharing and Supporting. These results are broadly consistent with the correlation analysis. Thus, even when clustering is performed using the within-meeting distributions of indicator values rather than meeting-level aggregated scores alone, non-accumulated-network-based indicators remain associated with Sharing and Supporting in the controlled meeting experiments. This finding is consistent with the problem-solving nature of the experimental meetings, in which meeting phases are largely constrained to cooperative exploration and trial-and-error.
Table 5 summarizes the one-way ANOVA results for objective meeting outcomes across meeting clusters; table entries are F-statistics, and statistically significant effects (p < .05) are shown in bold. Across all indicator spaces, few simulator input/output measures showed significant differences between clusters. This suggests that the within-meeting distributions of meeting dynamics indicators are unlikely to have strong associations with objective outcome measures. One possible reason is that meeting dynamics indicators are formal features derived from the network structure of speech, rather than direct measures of the quality of ideas or decisions produced in the meeting. In general, the quality of ideas and decisions is highly context-dependent and requires an understanding of task-specific context, such as domain knowledge and operational background. By contrast, the indicators used in
this study capture structural characteristics of utterance relationships only, which may limit their correspondence with objective outcomes.
Table 4: ANOVA results for task achievement ratings across meeting clusters.
This study examined the validity and context dependence of meeting dynamics indicators derived from Keyword Co-occurrence Networks. In the real-world corporate meetings, indicators based on accumulated networks showed meaningful associations with third-party-rated task achievement, particularly with Directing, which reflects behaviors related to setting and managing the direction of discussion. In contrast, in the controlled meeting experiments, indicators based mainly on non-accumulated networks were associated with participant-rated task achievement, especially Sharing and Supporting, while showing limited ability to explain objective meeting outcomes. These findings suggest that meeting dynamics indicators function less as direct measures of objective meeting outcomes and more as indicators that reflect perceived meeting performance, such as whether a meeting is progressing smoothly or whether discussion is becoming organized. The observed consistency between the indicators and participants’ perceptions also suggests that they can serve as metacognitive cues to support reflection during meeting interventions, making them a practical option for monitoring and improving meeting processes. At the same time, the indicators that aligned with task achievement ratings—and the task categories they reflected—varied depending on meeting structure and discussion content. For practical use in meeting intervention, indicators should therefore be constructed from data from similar meeting types and used with validation against meeting process measures.
REFERENCES
Chen, Y., Kanno, T. and Furuta, K. (2023). Cognition-oriented facilitation and guidelines for collaborative problem-solving online and face-to-face: An in-depth examination of format and facilitation influence on problem-solving performance. Proceedings of the CHI Conference on Human Factors in Computing Systems. Association for Computing Machinery.
Exploring Meeting Dynamics Indicators Using Keyword Co-Occurrence Networks 379 Chen, Y., Kanno, T., Hachisuka, S., Yoshino, Y. and Watanabe, S. (2025). Using
keyword networks to define indicators of meeting dynamics. Proceedings of the 39th Annual Conference of the Japanese Society for Artificial Intelligence (JSAI 2025), 3Q1-OS-5-03. Ishii, D., Kanno, T., Hachisuka, S., Yoshino, Y. and Watanabe, S. (2025). Extraction of non-technical skills related to creativity in meetings. The Japanese Journal of Ergonomics, 61(Supplement), 2E02-02. Niculae, V. and Danescu-Niculescu-Mizil, C. (2016). Conversational markers of
constructive discussions. Proceedings of the 2016 Conference of the North American Chapter of the Association for Computational Linguistics: Human Language Technologies (NAACL-HLT 2016), pp. 568–578. Perlow, L.A., Hadley, C.N. and Eun, E. (2017). Stop the meeting madness: How to free up time for meaningful work. Harvard Business Review, 95(4), pp. 62–69.
LISTED IN THE AHFE DIGITAL BOOKSTORE CATALOGUE
Explore the complete digital volume
Human Factors, Business Management and Society
Read this individual research paper free through the original publisher, or explore the full digital proceedings book.
ISBN 978-1-964867-91-5
Explore this ISBN in the AHFE Bookstore ↗Listed in the July 2026 bookstore catalogue; search by ISBN to confirm current availability · Digital book purchase optional