Saki Namura, Taro Kanno, Kazuo Furuta, Yingting Chen, Daichi Mitsuhashi (2022). Exploring quantitative indicators for monitoring resilient team cognition. In: Human Factors in Communication of Design. AHFE Open Access, vol. 49, pp. 174–179. https://doi.org/10.54941/ahfe1002052
Many human factors researchers have explored the cognitive and behavioral factors that affect team performance through behavioral and verbal protocol analyses. These studies primarily used qualitative analyses of observable behaviors and utterances, which makes it difficult to capture the dynamic and resilient team cooperation process directly. Therefore, it is necessary to develop quantitative indicators or measures to assess dynamic processes in team behavior and communication. Once such appropriate indicators or measures are developed, we can compare the performance of different teams quantitatively and find the features of team cognition that support good performance. In the study of complex problem solving, several studies calculated the entropies of utterances from the results of a qualitative analysis of team communication to detect phase changes in complex problem solving (Wiltshire and Butner, 2017). In addition to entropy, this study calculates the Kullback–Leibler divergence (KL) of utterances in segments for the entire team process to identify dynamic features and irregular segments in team communication. We applied the information theory to quantify the features of utterances in segments for the entire team process to find dynamic features and irregular segments in team communication. We analyzed the utterance data of a three-person team working on a task that required dynamic role assignment and collaboration. We first analyzed the turn-taking and communication contents and then visualized them using recurrence plots to visually find sequential patterns. We then calculated the Kullback–Leibler divergence (KL) and plotted it with sliding windows to analyze the dynamic features in team communication. The results showed that the bias of the content increased with disturbances, which suggests that the proposed indices can be used to capture speech distortions caused by external disturbances.
Many human factors researchers have explored the cognitive and behavioral factors that affect team performance through behavioral and verbal proto- col analyses. These studies primarily used qualitative analyses of observable behaviors and utterances, which makes it difficult to capture the dynamic and resilient team cooperation process directly. Therefore, it is necessary to develop quantitative indicators or measures to assess dynamic processes in team behavior and communication. Once such appropriate indicators or measures are developed, we can compare the performance of different teams quantitatively and find the features of team cognition that support good per- formance. In the study of complex problem solving, several studies calculated the entropies of utterances from the results of a qualitative analysis of team communication to detect phase changes in complex problem solving (Wilt- shire and Butner, 2017). In addition to entropy, this study calculates the Kullback–Leibler divergence (KL) of utterances in segments for the entire team process to identify dynamic features and irregular segments in team communication.
Exploring Quantitative Indicators for Monitoring Resilient Team Cognition 175
METHOD
Data for Analysis For the analysis, we used the conversation data of a three-person team per- forming a task in which they were requested to cook light meals by following the recipe provided. The task has a time limit (10minutes). Proper role assi- gnment and collaboration are required to complete the task within the time limit. There are four items: coffee, steamed cakes, biscuits with marshmal- lows, and dessert mousse. One session lasted 10 minutes, and during the session, these four items were ordered randomly at random times. The parti- cipants were not informed of the order and timing beforehand; these orders functioned as a disturbance to teamwork (Mitsuhashi et al., 2020). Nine items were ordered during the session: two coffees, two steamed cakes, three biscuits with marshmallows, and two dessert mousses. As some items requi- red waiting time to cook, such as boiling water or heating the ingredients in the microwave, the cooking order is an important factor in completing the task. In the session, only five items were completed on time: one coffee, two biscuits with marshmallows, and two dessert mousses. This team was late in preparing the steamed cakes, which required the longest waiting time (30 seconds in the microwave), and could not use the microwave during that time, which delayed the cooking of the other items, resulting in a low completion rate.
Primarily Analysis: Coding Coding is a primary analysis method for utterance analysis, in which each utterance or coding unit is classified into predefined categories. In the coding, a coder selects one or more categories that he/she judges to be appropri- ate for the characteristics of each utterance/unit. Various coding schemes focusing on the content, reason, or function of the utterance have been pro- posed, depending on the purpose of the research (Kanno et al., 2013; Nonose et al., 2015). In this study, we applied the modified coding scheme develo- ped by Bower et al. (Bower and Jentsch, 1998). The present study’s coding scheme consists of eight categories: “Question,” “Action Request,” “Ackno- wledgement,” “Response,” “Plan,” “Observation Fact,” “Task-related,” and “Task-unrelated.”
Secondary Analysis We conducted a secondary analysis of the coding results and attempted to identify sequential patterns or statistical features that characterize good or bad responses to the disturbances. First, we applied a recurrence plot to find sequential patterns in turn-taking and the appearance of codes in communication. The quantitative indices of the plots were also calculated. Next, we calculated the entropy of the utterance content in each segment of the communication, which quantifies the local characteristics indepen- dent of the other segments. We then calculated the Kullback-Leibler diver- gence of the utterance contents in the segments that quantify the relative characteristics of the entire communication.
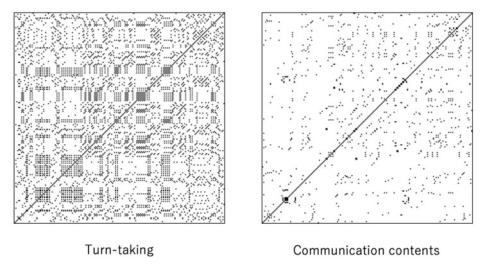
Figure 1: The recurrence plots of the turn-taking and the communication content. The horizontal and vertical axes both represent time series.Table 1. Quantitative indices of the recurrence plots.
Table available in the original PDF paper.
Index Turn-taking Communication content DET 0.412 0.0655 LAM 0.400 0.127 RR 0.372 0.0256 TT 2.57 2.20 Vmax 4.00 4.00
RESULTS AND DISCUSSION
Recurrence Plot The recurrence plot shows the patterns and structural changes in the time series of variables that describe the behavior of dynamic systems. A recur- rence plot is an array of dots arranged in an N × N square. The values for the horizontal and vertical axes are associated with the successive values of a time series of N elements. The diagonal lines appearing in the recurre- nce plot represent sequential patterns, and the vertical lines represent steady states (Bakeman and Quera, 2011). Figure 1 shows the recurrence plots of turn-taking and communication content during one session.
In the turn-taking recurrence plot (Figure 1, left), the vertical lines are mostly observed in the lower left of the graph and the diagonal lines are mainly in the upper right, which indicates that the same person successively talked at the beginning of the session and that sequential turn-taking occurred in the latter part. We also calculated quantitative indices from the recurrence plots (Table 1). These indices are defined as follows.
DET (Determinism): the percentage of recurrence points that form diago- nal lines.
LAM (Laminarity): the percentage of recurrence points that form vertical lines.
RR (Recurrence rate): the density of recurrence points.
TT (Trapping time): the average length of the vertical lines.
Vmax is the maximal vertical line length.
Exploring Quantitative Indicators for Monitoring Resilient Team Cognition 177
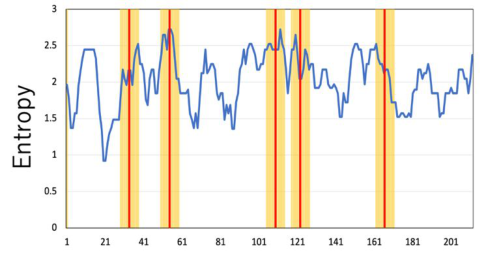
Figure 2: The entropy plots for communication content. The vertical axis represents entropy, and the horizontal axis represents the turn of utterances.
The quantitative analysis showed that the DET and LAM values for turn- taking were close (0.412 and 0.400), which suggests that steady-state and sequential patterns were equally present in the communication during the session.
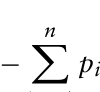
Entropy Entropy quantifies the disorder and complexity of a system as a function of the number of bits of information required to describe the system (Shannon, 1948). The equation for information entropy is:
Equation reproduced from the original PDF.
In this equation, pi is the probability that a given code i occurs in all utte- rances, where i is an indicator of one of the eight codes (n = 8). A previous study suggested that when a system is undergoing a phase transition, it exh- ibits a peak in entropy and that entropy levels relate to team performance (Wiltshire and Butner, 2017; Chen, et al., 2022). We calculated the entropy for the segments consisting of 10 utterances and plotted them with sliding windows to analyze the dynamic features of team communication during a session. Entropy plots for the communication content are shown in Figure 2. The yellow bands indicate the timing of the placement of orders (external disturbances). The bands and peaks roughly overlap. These results indicate that the communication content was changed by the disturbances caused by the orders.
Kullback-Leibler Divergence (KL) Kullback-Leibler divergence (KL) is widely used in statistics and pattern recognition as a measure of the similarity between two density distribu- tions. It is also known as relative entropy (Hershey and Olsen, 2007).
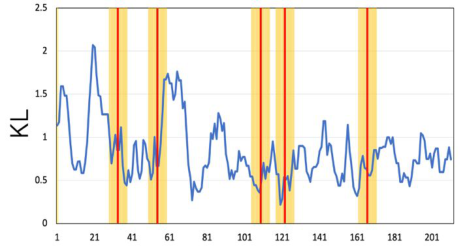
Figure 3: The KL plots for the communication content. The vertical axis represents KL, and the horizontal axis represents the turn of utterances.
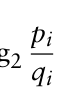
The equation for KL is: n X −
(2)
pi log2
Equation reproduced from the original PDF.
In this equation, pi is the probability that a given code i appears in the segments of utterances and qi is the probability that a given code appears in all utterances, where i is an indicator of one of the eight codes (n = 8). In this study, we used KL to evaluate the similarity between all utterances and the segmental utterances to extract the characteristics of the segments. We calculated KL for segments consisting of 10 utterances and plotted them with sliding windows to analyze the dynamic features in team communica- tion. Figure 3 shows the KL plots for the communication content. The yellow bands indicate the timing of the placement of orders (external disturbances). We can see that the bands and bottoms overlap roughly, which suggests that the communication content was changed by the disturbances caused by the orders.
CONCLUSION
This study explored the quantitative indicators for monitoring resilient team cognition. We analyzed team communication in segments and quantified their features using different indicators: entropy and Kullback-Leibler divergence. We observed whether these indicators changed before and after the distur- bances and whether they captured the communication features in response to the disturbances. The results showed that the bias of the speech content increases with disturbances, and that the distribution of speech content in segments including disturbances is similar to the entire distribution, which suggests that these two indices can roughly capture the disruptions in utte- rances caused by disturbances to the same extent. We expect that these indicators will allow us to quantitatively compare the performance of dif- ferent teams and to find the characteristics of team cognition that support good performance. However, the peaks or bottoms did not necessarily corre- spond to disturbances and were observed even in the absence of disturbances. During analysis of the content of the utterances of those peaks or bottoms, it
Exploring Quantitative Indicators for Monitoring Resilient Team Cognition 179
was found that each member was talking to himself/herself or repeating the same utterance due to mishearing. The future direction is to find causes or reasons for peaks or bottoms in the absence of disturbances by analyzing not only utterances but also behavior and other situational data.
ACKNOWLEDGMENT
This work was partly supported by JSPS KAKENHI (Grant Number JP19H02384).
REFERENCES
Bakeman, R., and Quera, V. (2011). Recurrence Analysis and Permutation Tests.
In Sequential Analysis and Observational Methods for the Behavioral Sciences, pp. 148–162. Bowers, C. A., Jentsch, F., Salas, E., and Braun, C.C. (1998). Analyzing communication sequences for team training needs assessment. Human Factors, 40, pp. 672–679. C. E. Shannon. (1948). “A mathematical theory of communication,” in The Bell
System Technical Journal, vol. 27, no. 3, pp. 379–423. Chen Y., Kanno T., Furuta K. (2022). “An Empirical Investigation of the Underlying Cognitive Process in Complex Problem Solving,” International Journal of Cognitive Informatics and Natural Intelligence, 2022, In press. J. R. Hershey and P. A. Olsen. (2007). “Approximating the Kullback Leibler Diver-
gence Between Gaussian Mixture Models,” 2007 IEEE International Conference on Acoustics, Speech and Signal Processing - ICASSP, pp. IV-317-IV-320. Kanno, T., Furuta, K., & Kitahara, Y. (2013) A model of team cognition based on mutual beliefs, Theoretical Issues in Ergonomics Science, 14:1, 38-52, DOI: 10.1080/1464536X.2011.573010 Mitsuhashi, D, Kanno, T, Inoue, S, Karikawa, D, Nonose, K & Furuta, K. (2020).
Prescriptive and descriptive similarity of team contexts. in IL Nunes (ed.), Adva- nces in Human Factors and Systems Interaction - Proceedings of the AHFE 2019 International Conference on Human Factors and Systems Interaction. Advances in Intelligent Systems and Computing, vol. 959, Springer Verlag, pp. 185–193. Nonose, K., Kanno, T. & Furuta, K. (2015) An evaluation method of team communication based on a task flow analysis. Cogn Tech Work 17, 607–618. https: //doi.org/10.1007/s10111-015-0340-4 Wiltshire, Travis & Butner, Jonathan & Fiore, Stephen. (2017). Problem- Solving Phase Transitions During Team Collaboration. Cognitive Science. 42. 10.1111/cogs.12482.
LISTED IN THE AHFE DIGITAL BOOKSTORE CATALOGUE
Explore the complete digital volume
Human Factors in Communication of Design
Read this individual research paper free through the original publisher, or explore the full digital proceedings book.
ISBN 978-1-958651-25-4
Explore this ISBN in the AHFE Bookstore ↗Listed in the July 2026 bookstore catalogue; search by ISBN to confirm current availability · Digital book purchase optional