Hospitals need to prepare for disasters. For this purpose, they need to formulate a BCP and a response plan and conduct training and exercise. Through training and exercise, they are expected to learn necessary actions and procedures, as well as to find problems in the BCP and response plan. It is, however, not easy to comprehend and evaluate the entire training and exercise process, particularly as the scale of the training and exercise becomes larger. Besides, it also becomes more difficult to find important problems and their causes in training and exercise. To solve this problem, it is necessary to record the events and activities during training and exercise as much detail as possible and analyze them from various viewpoints. This paper describes the comprehensive data recordings in a disaster response exercise in a big hospital in Kanagawa Prefecture, Japan. This hospital is one of the largest hospitals in the region and is designated as a disaster-base hospital which is expected to play a central role in disaster medicine in the area. The target exercise is an annual exercise for a mass casualty incident assuming a big earthquake, in which 46 injured patients are transported to the hospital. We collected data on the following three aspects of the exercise: judgment and decision-making, such as triage and diagnosis and treatment, the in-hospital flow of patients and medical instruments, and the flow of information in and among different areas and rooms. Regarding the data on judgment and decision-making, we collected the documents used in actual disaster medicine, such as triage tags and medical charts. For the other data, we used action cameras attached to hospital staff, station cameras to observe the activities in specific areas, IC recorders attached to patients and several important hospital staff, PHS-IC recorders attached to area leaders to record inter-area communication, Zoom recordings for online communications, and several observers to record inter-area transfer of patients.This paper also describes preliminary analyses of the data recorded in the exercise, including the accuracy of 1st and 2nd triage, the details of patient flow, and the length of stay in each area.Finally, this paper describes the data analysis planned in the next step, such as network analysis of inter-area communication, task analysis of the activities in each area, and so on. In addition, we will discuss the possibility of utilizing the study to reproduce the exercise using the agent-based simulation we developed for a deeper understanding of the entire process of the in-hospital disaster medicine process.
Disaster base hospitals in Japan, designated by local governments, are expe- cted to play a pivotal role in regional disaster medicine (Ministry of Health, Labour and Welfare, 2019). They are required to formulate a business con- tinuity plan (BCP) and conduct training and exercise at least once a year. Through these training and exercises, they are expected to master the neces- sary response procedures and identify problems in the BCP (The Small and Medium Enterprise Agency, 2022). However, it is not easy to evaluate the performance of training and exercises, especially as the scale of training and exercise increases. To solve this problem, it is necessary to record events and activities during training and exercise as much as possible and analyze them from various perspectives.
Extensive Data Collection in an In-Hospital Disaster Response Exercise 43
DISASTER RESPONSE EXERCISE AND DATA COLLECTION For this study, we collected various data described in this section during a disaster response exercise at a major hospital in Kanagawa Prefecture, Japan. The hospital considered for this study, is one of the largest in the region and is designated as a disaster base hospital. The target exercise for this study is an annual exercise for a mass casualty incident, assuming a massive ear- thquake, in which 46 injured patients are transported to the hospital. The exercise lasted for two hours and involved approximately 50 hospital staff. The first patient arrived at the hospital 15 minutes after the start of the exe- rcise. Immediately after the exercise started, various areas and stations were set up, including disaster response headquarters, medical command posts, tri- age areas, red, yellow, green, pink, fever, and waiting areas for hospitalization and surgery.
The red, yellow, and green areas represented treatment areas, the color of which indicated the severity of the patient’s injuries. The red area repre- sented the most severely injured patients, and the green area represented the least severely injured patients. The hospital prepared a pink area to treat pregnant patients. The fever area was prepared for patients with fever, assu- ming that there were patients suspected of being infected with COVID-19. Each area had a leader, medical doctors, nurses, and support staff. The area leader communicated with representatives of other areas, and the support staff coordinated the equipment, kept records, and sometimes played the role of a messenger. Every patient who arrived at the hospital first went to the triage post and was then triaged to an appropriate treatment area. In the tre- atment area, patients received a diagnosis and rapid treatment before moving on to the next step. Secondary triage was also performed in each treatment area if necessary. If primary triage was deemed inappropriate, patients were transferred to an appropriate area.
We collected data on the following three aspects of the exercise: judgment and decision-making, like triage, diagnosis, and treatment; flow of patients and medical equipment in the hospital; and flow of information in and betw- een different areas and rooms. For data on judgment and decision-making, we collected documents used in the exercise, like triage tags and medical charts. For other data, we used action cameras attached to hospital staff, sta- tion cameras to observe activities in specific areas, IC recorders attached to patients and several key hospital staff, PHS-IC recorders attached to area leaders to record inter-area communications, zoom recordings for online communications, and observers to record inter-area patient transfers.
DATA ANALYSIS This section describes the preliminary analysis of the data.
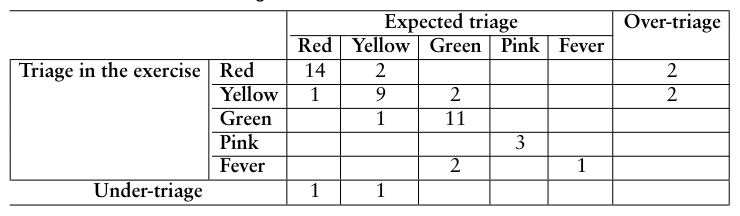
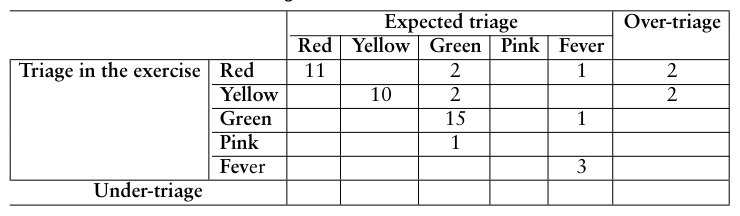
Accuracy of Triage Tables 1 and 2 show the accuracies of the first and second triage, respectively. These tables represent the expected triage made by an exercise planner and the actual triage performed during the exercise. Over-triage implies that the actual triage is higher than the expected triage, and under-triage implies the
Table 1. Result of the first triage.Table 2. Result of the second triage.
opposite. The results showed that most of the triages were accurate, with four over-triage cases in each of the first and second triage, and two under-triage cases in the second triage. Although over-triage is relatively unproblematic, under-triage is extremely serious as the delay in treatment due to unnecessary area transfer increases the risk of preventable death. When we look at the details of these two under-triage cases, one involved a yellow-area patient who was transferred directly for hospitalization and the other involved a red-area patient who was discharged. While the first case was practically appropriate, the second case was obviously a triage error. Therefore, we need to further investigate why this under-triage occurred.
Patient Flow
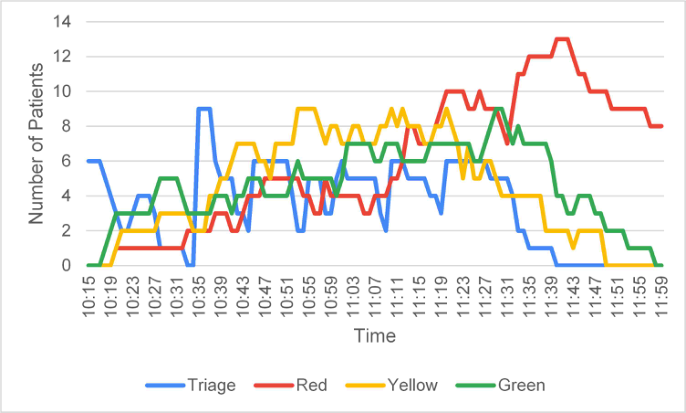
Figure 1 shows the time-series behavior of the number of patients in the triage post and three treatment areas. The red area was overcrowded during the last 30 mins. Since the capacity of the red area is approximately eight patients, it indicated that the red area could not handle all patients in the last 30 mins. Further observation of the video recordings revealed that the area leader was busy communicating with representatives of other areas and thus, was unable to provide appropriate instructions to the staff in a timely manner. In other areas, the patients were not observed during the exercise, and all patients were processed by the end of the exercise.
Length of Stay
Table 3 provides a summary of the length of stay in each area, which inclu- des various information regarding the exercise’s performance evaluation. For example, triage is expected to be completed within 30 seconds or a few minutes; however, in this exercise, it took over seven minutes on an average. Therefore, it is necessary to further investigate why triage took a long time
Extensive Data Collection in an In-Hospital Disaster Response Exercise 45
Figure 1: Number of patients in triage and treatment area.Table 3. Length of stay (in mins.).
Table available in the original PDF paper.
Triage Green Yellow Red Pink Waiting Exam Fever Mean 7.8 30.2 31.1 30.1 15 28.8 2.1 25 Median 7 30 35 28.5 5 35 2 23.5 Max. 20 56 46 87 37 46 5 43 Min. 2 5 5 7 3 11 1 10
during this exercise. Regarding the length of stay in the treatment areas, it was found that the average length of stay did not vary between different areas. Furthermore, it was found that there was a large variance in the duration of treatment depending on patient characteristics.
For the Evaluation of Disaster Resilience We plan to conduct further analysis of the collected data to evaluate the performance of the exercise, through ways like content analysis of the com- munication during the exercise, network analysis of communication between different areas, and detailed task analysis to clarify coordination. However, although it is important to analyze the exercise records from various aspects to evaluate the response performance and BCPs, it is not sufficient to assess whether the participants performed and how well they did in the exercise that can be effective in an actual disaster because there were many unrea- listic assumptions and constraints in the exercise scenario. Additionally, it is difficult to conduct an exercise frequently with different scenarios and assumptions to evaluate performance and BCPs under different conditions. To overcome these limitations of the exercise-based evaluation of response performance and BCPs, we are currently developing an agent-based simula- tion to replicate response activities in a disaster exercise. In future, we intend
to conduct a simulation using the data collected during the exercise and under realistic conditions without time reduction so that we can more accurately assess the response performance of the exercise (Umemoto et al., 2023).
CONCLUSION
In this paper, we described the extensive data collection during a disaster response exercise at a large hospital, with the goal of analyzing data from multiple perspectives to evaluate and identify problems in the hospital’s response performance and BCPs. Furthermore, we also presented some preli- minary results of the analysis, like triage accuracy, patient flow, and length of stay. The results of the analysis identify points that need to be closely exami- ned, like the under-triage case and congestion in the red area. Further analysis will focus on communication and coordination between different areas, for example, through content analysis of recorded conversations and detailed task analyses of interarea interactions.
However, exercise-based assessment of response capabilities and BCPs is limited in terms of the realism of exercise scenarios and cost-effectiveness. A promising alternative is an agent-based simulation with a realistic model that allows us to run simulations under various assumptions and conditions. We are currently developing a simulation model based on detailed task analysis using collected data and interviews with subject matter experts, including exercise planners. We will assess the response performance and BCPs by integrating the exercise data analysis and agent-based simulations.
ACKNOWLEDGEMENT
This work was partly supported by the JST-Mirai Program Grant No. JP20348594, Japan.
REFERENCES
Director-General, Medical Policy Bureau, Ministry of Health, Labour and Welfare (2019) “Partial Revision of Requirements for Designation of Disaster Base Hospitals”, Website: ttps://www.mhlw.go.jp/content/10800000/000749617.pdf Ministry of Health, Labour and Welfare, 2019. Small and Medium Enterprise Agency (2022), “Guidelines for the Development and
Operation of BCPs for Small and Medium-Sized Enterprises”, Website: https:// www.chusho.meti.go.jp/bcp/contents/level_c/bcpgl_01_1.html Umemoto, M., Kadono, S., Kanno, T., Kajiyama, K., Sharikura, S., Ikari, R., Yoneyama, M., and Chuang, S., “Modeling and Simulation of In-Hospital Disaster Medicine in a Mass Casualty Incident for the Evaluation of BCPs”, J. Disaster Research, 18(2): 104–11, 2023.
LISTED IN THE AHFE DIGITAL BOOKSTORE CATALOGUE
Explore the complete digital volume
Safety Management and Human Factors
Read this individual research paper free through the original publisher, or explore the full digital proceedings book.
ISBN 978-1-958651-81-0
Explore this ISBN in the AHFE Bookstore ↗Listed in the July 2026 bookstore catalogue; search by ISBN to confirm current availability · Digital book purchase optional