So Nishina (2026). Organizational Thermodynamics: A Phase Transition Model of Value Resonance and Entropic Collapse in High-Growth Startups. In: Human Systems Engineering and Design (IHSED2026): Future Trends and Applications. AHFE Open Access, vol. 237, pp. 168–177. https://doi.org/10.54941/ahfe1008157
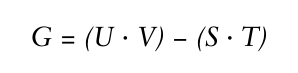
A recurring failure mode in high-growth startups is the progressive deterioration of organizational coherence traceable not to product failure or market dynamics but to value-misaligned senior leaders insulated from accountability by their own rank and compensation. This paper introduces Organizational Thermodynamics (OT), a formal framework modeling the scaling organization as an open thermodynamic system. The governing equation G = (U·V) − (S·T) captures free organizational energy as the net of purposive coupling force (U·V, institutional binding modulated by Value Resonance Coefficient V) minus entropic load (S·T, structural complexity scaled by growth velocity). When V turns negative in a high-rank leader, U·V turns negative, converting institutional architecture into a net entropy amplifier—a discontinuous collapse I term destructive sublimation. Two leading behavioral indicators—Agenda Engagement (AE) and Reward Centricity (RC)—are proposed as a composite early-warning index (EWI). Case vignette evidence from thirty-one technology startups (2015–2024, Series A–D) offers directional support: nine of eleven organizations (81.8%) experiencing destructive sublimation exhibited the AE↓ RC↑ pattern at least two quarters prior to visible deterioration. A multi-phase research agenda is proposed to underpin quantitative validation.
The literature on startup failure is rich but asymmetrically distributed. Most of it concerns external causes—market timing, capital structure, competitive entry—or early-stage product failures attributable to poor customer discovery (Blank and Dorf, 2012; Ries, 2011; Eisenmann, 2021). What receives substantially less systematic attention is a failure mode that practitioners encounter with uncomfortable frequency: the internally generated collapse of an otherwise viable, well-funded, product-market-fit- proven organization. In these cases, the proximate cause is not a market or a balance sheet. It is a person—or a small cluster of people—whose values have sufficiently diverged from the organization’s founding intent that their
Received March 8, 2026 Revised June 11, 2026 Accepted July 6, 2026 Available online September 25, 2026
Organizational Thermodynamics: A Phase Transition Model of Value Resonance 169 continued presence reverses the contribution of every institutional structure designed to keep the organization on course.
I draw on dissipative systems theory (Prigogine and Stengers, 1984), complexity-based organizational theory (Stacey, 2007; Lewin, 1999), Gibbs free energy formalism, and a practitioner dataset accumulated over a decade advising high-growth technology organizations. The result is Organizational Thermodynamics (OT)—a framework rigorous enough to generate testable predictions and practical enough to inform real-time decision-making. I make no claim that OT is complete; the point of this paper is to establish a theoretically coherent skeleton that subsequent empirical work can validate or refine.
Sections 2–3 develop the theoretical core and phase dynamics; Section 4 operationalizes the leading indicators; Section 5 presents case vignette evidence; Sections 6–7 discuss implications and a research agenda; Section 8 concludes.
THEORETICAL FOUNDATIONS Thermodynamic Analogies in Organizational Theory
Thermodynamic metaphors have a longer and more serious history in organizational science than is commonly recognized. Schneider and Kay (1994) argued that living systems—which they explicitly extended to social organizations—are dissipative structures that maintain internal order by continuously degrading energy obtained from their environment. The key insight, often lost in casual applications of complexity theory, is that order maintenance is not free: it requires continuous energy throughput, and it becomes progressively more expensive as the system grows more complex.
Lewin (1999) and Stacey (2007) extended this logic to management contexts without formalizing the conditions for phase transition onset. OT is an attempt to do exactly that.
The Free Organizational Energy Equation The conceptual anchor of OT is an analogy to Gibbs free energy in physical chemistry, which quantifies the maximum useful work extractable from a thermodynamic system. I define Free Organizational Energy (G) as the net propulsive capacity of the organization: the surplus force available, after entropic load is subtracted, for purposive mission-directed activity. The governing equation is:
Equation reproduced from the original PDF.
The structure of this equation is motivated by the logic of net capacity: G equals the ordering force supplied by value-aligned institutional coupling, minus the entropic load imposed by the joint product of organizational complexity and growth velocity. When G > 0, ordering force exceeds entropic load and the organization has surplus propulsive capacity. When G ≤ 0, the entropic load has overcome available ordering force and the organization trends toward dissolution. Each term is defined as follows.
170 Nishina G — Free Organizational Energy. G is the net propulsive capacity available for purposive collective action. The sign of G is the critical diagnostic variable in OT: G > 0 characterizes a system capable of sustained, directional growth (the liquid state); G ≤ 0 characterizes a system in entropic dominance, trending toward structural dissolution (the gaseous state). The magnitude of G determines how much margin the organization has before a phase transition becomes likely.
U·V — Purposive Coupling Force. The product U·V represents the effective ordering contribution of the institutional architecture, modulated by the degree to which the leader enacting it is in value resonance with the organization. U (Institutional Coupling) is the raw binding force of organizational structure: evaluation systems, compensation frameworks, reporting hierarchies, and codified norms. V (Value Resonance Coefficient, −1 ≤ V ≤ 1) determines the direction and magnitude of U’s contribution to G. When V > 0, U·V is positive and ordering force exceeds the neutral baseline; when V < 0, U·V is negative and institutional coupling actively subtracts from G. This sign-reversal property is the most counterintuitive and practically important feature of OT: a heavily institutionalized organization with a V-negative senior leader has lower G than a loosely structured one, because U amplifies the destructive contribution of V < 0. Structure is not unconditionally stabilizing; it is a multiplier of whatever direction V provides.
The formal justification for S·T follows from classical kinetic theory: collision frequency scales with both particle density and temperature, not either alone. A V = −0.3 misalignment that produces manageable friction at low T and S becomes existentially dangerous at high T and S—exactly why the same leader grows more threatening as the organization scales and accelerates.
PHASE TRANSITION DYNAMICS AND DESTRUCTIVE SUBLIMATION Organizational State Regimes
OT identifies three primary organizational state regimes: Liquid State (G > G1): Structural coherence with adaptive flexibility. Decision cycles are short, cultural transmission is high-fidelity, and institutional mechanisms reliably direct collective behavior toward purpose. This is the high-performance scaling state.
Transitional State (G2 < G ≤ G1): Signs of structural strain emerge: communication latency increases, cultural fidelity degrades, institutional mechanisms begin producing outcomes inconsistent with their design intent. Intervention remains viable.
Gaseous State (G ≤ G2): Entropic dominance. Structural coherence is lost, high-V talent flight accelerates (creating a self-reinforcing average-V decline), and institutional architecture becomes actively counterproductive. Recovery requires external energy input exceeding the organization’s remaining capacity.
Organizational Thermodynamics: A Phase Transition Model of Value Resonance 171 Destructive Sublimation
In physical systems, sublimation is the direct phase transition from solid to gas, bypassing the liquid phase. I borrow this term to describe a specific organizational dynamic: the collapse of a liquid-state organization directly into the gaseous state, bypassing the transitional regime. I call this destructive sublimation.
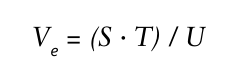
Destructive sublimation occurs when two conditions hold simultaneously: (1) T is high and (2) V crosses below the critical threshold Ve in one or more high-U leaders. Setting G = 0 in the free energy equation and solving for V yields the critical threshold:
Equation reproduced from the original PDF.
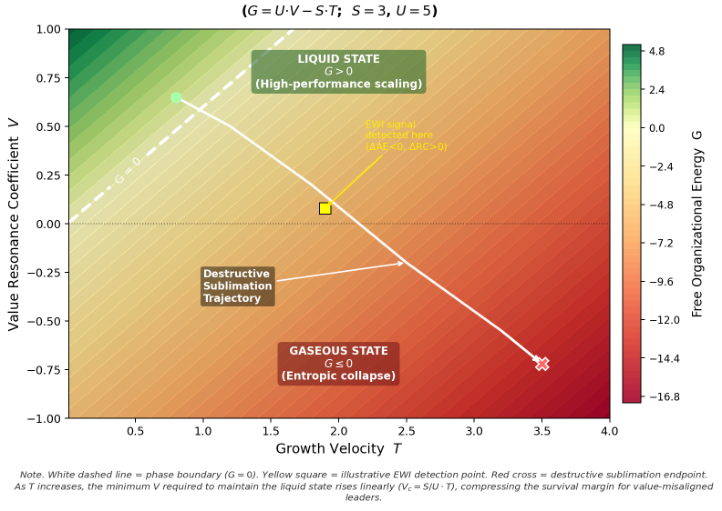
This expression carries an important implication that is not obvious from the narrative account alone: Ve is not a fixed organizational constant but a linear function of the ratio S·T / U. As the organization scales (S increases) and accelerates (T increases), the minimum V required to maintain a positive G rises. An organization that could tolerate a leader at V = 0.2 during its twenty-person phase may find that same leader existentially threatening at two hundred people and three-fold growth velocity. Figure 1 illustrates this dynamic as a phase diagram.
Axes represent Growth Velocity (T) and Value Resonance Coefficient (V) for representative parameter values (S = 3, U = 5). Color intensity indicates magnitude of Free Organizational Energy G = U·V − S·T. The white dashed line marks the phase boundary (G = 0). The white trajectory illustrates a
172 Nishina destructive sublimation path: an organization begins in the liquid state, undergoes V deterioration in a senior leader while simultaneously scaling (T increases), crosses the G = 0 boundary after an EWI detection signal (yellow square), and reaches organizational collapse (red cross). The linear slope of the phase boundary (Ve = S·T / U) formalizes the core OT claim that the survival margin for value-misaligned leadership narrows as organizations scale and accelerate.
The temporal dynamics of destructive sublimation are asymmetric in a way that has major practical implications. Descent from liquid to gaseous state can be measured in quarters; recovery—if achievable at all—is measured in years. This asymmetry arises because the gaseous state produces second- order damage: the departure of high-V individuals removes the human substrate through which institutional repair would be accomplished. In this sense, destructive sublimation exhibits the properties of what Perrow (1984) called a “normal accident”: a failure mode intrinsic to the system’s structure, one that becomes increasingly probable as complexity grows.
It is worth being explicit about what OT does not claim. The framework does not assert that all organizational failures are thermodynamic, nor that V is the only variable of interest. OT addresses a specific, identifiable failure mode. That said, in the practitioner observations underlying this paper, value-resonance collapse at the senior level is strikingly prevalent as an underappreciated contributing factor even in cases nominally attributed to other causes.
OPERATIONALIZING VALUE RESONANCE: LEADING INDICATORS The Measurement Challenge
A theoretical construct earns its keep only if it generates measurable predictions. V is a behavioral-dispositional variable; I am less interested in V at a given moment than in ΔV/Δt, which motivates two behavioral-trace indicators that are continuous, relatively non-gameable, and derivable from data most organizations already generate.
Agenda Engagement (AE) Agenda Engagement (AE) is defined as the degree to which a leader’s behavioral output reflects sustained, substantive investment in the organization’s mission agenda—characterized by proactive contribution to strategic discussions, ownership of cross-functional initiatives, and consistency of engagement quality regardless of audience. Declining AE, rather than its absolute level, is the theoretically critical signal in OT. AE can be operationalized through structured content analysis of leadership forum contributions (Bales, 1950), longitudinal tracking of initiative ownership, and 360-degree behavioral assessments calibrated to value-behavioral anchors.
Organizational Thermodynamics: A Phase Transition Model of Value Resonance 173 Reward Centricity (RC)
Reward Centricity (RC) captures the reorientation of a leader’s behavioral focus from value creation toward personal reward extraction. At high RC, organizational resources—headcount, budget, title, political capital— are treated as instruments of personal accumulation rather than mission instruments. RC is measurable through ratio analysis of scope expansion requests to delivered output over rolling quarters, qualitative coding of executive communication for mission-referential versus self-referential language (Pennebaker, 2011), and patterns of resource request escalation relative to organizational growth rates. Importantly, RC is not synonymous with ambition. The diagnostic signal is the decoupling of reward-seeking from value creation.
The Composite Early-Warning Index I propose that the conjunction of declining AE and rising RC—formally, ΔAE < 0 and ΔRC > 0 over two or more consecutive quarterly cycles— constitutes a composite early-warning index (EWI) with superior diagnostic specificity relative to either indicator alone. At high T, the window between EWI detection and catastrophic G sign-reversal may be as short as a single quarter, which is why EWI monitoring should be a board-level governance function, not an HR administrative task.
EMPIRICAL GROUNDING: CASE VIGNETTE ANALYSIS Sample and Method
The empirical grounding for OT is drawn from practitioner observation across thirty-one technology-sector startups at funding stages ranging from Series A to Series D, observed between 2015 and 2024. In each case I served in a formal advisory or board-level consulting capacity. Cases were coded retrospectively against two criteria: (1) presence or absence of the AE↓ RC↑ pattern in a senior leader, and (2) organizational outcome classified as sustained high performance, managed restructuring, or destructive sublimation. A subset (n = 9) was independently assessed by a second coder; inter-rater reliability was acceptable (κ = 0.76).
Findings Outcome distribution and EWI pattern detection are summarized in Table 1. Of the eleven organizations that experienced destructive sublimation, nine (81.8%) exhibited the AE↓ RC↑ pattern in at least one senior leader a minimum of two quarters prior to visible organizational deterioration. Of the seven organizations that achieved managed restructuring, three had exhibited the EWI pattern but intervened through leadership transition within one quarter of detection. Among the thirteen organizations that sustained high performance, zero exhibited the pattern.
Table 1: Organizational outcome by EWI pattern detection status (N = 31).
Total 31 100% 12 19 38.7% Note. EWI = Early Warning Index (AE↓ RC↑ pattern over ≥2 consecutive quarters). Detection Rate = proportion of cases within outcome group exhibiting the EWI pattern.
Three patterns in the data deserve particular comment. First, the complete absence of EWI detection in the high-performance cohort is consistent with OT’s prediction that V decline is a prerequisite, not merely a correlate, of destructive sublimation. Second, all three managed-restructuring organizations that detected the EWI and intervened within one quarter achieved positive outcomes—underscoring the importance of detection speed. Third, the two destructive sublimation cases in which the EWI was not detected retrospectively both involved leaders whose V decay was masked by high AE in a single high-visibility domain, confirming that single- channel engagement metrics can be gamed and multi-domain measurement is methodologically essential.
Comparative Group Analysis
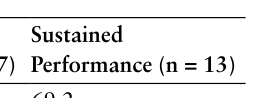
Table 2 presents a comparative profile of the three outcome groups across key OT-theoretic variables. The growth velocity differential is the most striking finding. The destructive sublimation group had a mean annualized headcount growth rate of 147.3% (SD = 43.1)—roughly 75 percentage points higher than the sustained performance group (84.2%, SD = 41.7) and 39 points higher than the managed restructuring group (108.6%, SD = 36.4). This gradient is consistent with OT’s central prediction: as T rises, the critical threshold Ve = (S·T)/U rises proportionally, and the same degree of value misalignment that is tolerable at low T becomes existential at high T.
The funding stage distribution reinforces this reading: the destructive sublimation group was concentrated in Series C/D (54.5%), where S·T is largest; the sustained performance group skewed toward Series A/B (69.2%), where growth velocity is typically lower. This is not a claim about later-stage organizations being generically more fragile, but about the structural risk of value-misaligned leadership rising with scale and speed.
The intervention lag comparison between the two EWI-positive outcome groups is, I believe, the most practically significant finding in the dataset. The three managed-restructuring organizations that detected the EWI acted within a median of 0.8 quarters (approximately ten weeks) of onset. The nine destructive sublimation organizations that detected the EWI waited a median of 4.7 quarters—nearly five times longer. The EWI onset timing was essentially identical across both groups (2.3 versus 2.1 quarters prior to visible deterioration), which means the signal was available equally early in both cases. What differentiated outcomes was not the quality of the warning
Organizational Thermodynamics: A Phase Transition Model of Value Resonance 175 but the speed of the organizational response. This finding is consistent with OT’s board-governance implication: EWI monitoring must be coupled with pre-committed decision protocols that eliminate the delay induced by escalation hierarchies and compensation politics.
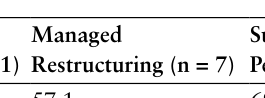
Table 2: Comparative group profile across OT-theoretic variables (N = 31).
Table available in the original PDF paper.
Equation reproduced from the original PDF.Equation reproduced from the original PDF.Equation reproduced from the original PDF.
45.5 57.1 69.2
Funding stage: Series A/B (%)
54.5 42.9 30.8
Funding stage: Series C/D (%)
Equation reproduced from the original PDF.
Mean headcount growth T (% p.a.)
9 (81.8%) 3 (42.9%) 0 (0.0%)
EWI-positive cases, n (%)
(IQR: 1.5–3.1) (IQR: 1.7–2.6) N/A
Median EWI onset before deterioration (quarters)
(IQR: 3.1–6.2) (IQR: 0.5–1.0) N/A
Median intervention lag after EWI (quarters) Note. T = annualized headcount growth rate. EWI = Early Warning Index (AE↓ RC↑ over ≥2 consecutive quarters). Intervention lag = quarters from first EWI detection to leadership transition decision. N/A = not applicable (no EWI detected).
DISCUSSION
Theoretical Contributions OT makes several contributions that, I believe, are not reducible to prior work. The most fundamental is the formal specification of U·V as a signed product. Existing organizational theory treats institutional coupling as intrinsically stabilizing. OT shows that this holds only when V > 0. When V is negative, institutional coupling becomes a force multiplier for organizational entropy. This has immediate practical implications: addressing culture problems by adding process and structure—the default startup governance response— worsens outcomes when the culture problem is V decay in a senior leader.
A third contribution is the introduction of destructive sublimation as a theoretically distinct failure mode. Its emphasis on discontinuity and irreversibility explains why organizations in collapse so often report that the deterioration seemed sudden—because, thermodynamically, it was.
Limitations and Boundary Conditions Several limitations of the current formulation should be acknowledged directly. First, V is treated as a scalar, but value resonance is almost certainly multidimensional—a leader may exhibit high V on transparency and low V on equity. A vector-valued V is theoretically preferable and is a priority for subsequent development. Second, the current calibration of Ve is theoretically
176 Nishina derived rather than empirically estimated, limiting predictive precision. Third, the case vignette evidence is retrospective, non-probabilistic, and subject to practitioner-researcher observation biases. Prospective longitudinal studies with pre-registered hypotheses are needed to establish whether OT’s predictions hold under controlled observational conditions.
Finally, OT does not address V recovery dynamics; whether and under what conditions a declined V can return above Ve remains an open empirical question.
A MULTI-PHASE RESEARCH AGENDA I outline four phases of work. Phase 1 validates AE, RC, and the EWI across both psychometric (CFA, test-retest) and behavioral-trace tracks, producing calibrated scoring protocols for survey and organizational data-stream inputs. Phase 2 deploys these instruments prospectively across a minimum of sixty organizations over two years, testing whether the AE↓ RC↑ pattern prospectively predicts deterioration and estimating Ve empirically as a function of S and T. Phase 3 moves to quasi-experimental causal identification through leadership-transition natural experiments. Phase 4 translates validated findings into board-level EWI dashboards, leadership-transition timing frameworks, and intervention protocols evaluated as implementation science (Fixsen et al., 2005). The Phase 1–4 progression represents a multi- year commitment; I raise it to make explicit the scientific trajectory OT makes possible.
CONCLUSION
High-growth startups are, by design, systems operating far from equilibrium: high entropy, high velocity, high coupling, high stakes. The very conditions that make them capable of extraordinary value creation also make them vulnerable to a specific and under-theorized failure mode—the entropic collapse triggered by value-misaligned senior leadership. This paper has introduced OT as a formal framework for analyzing that failure mode, centering on the signed multiplicative relationship between institutional coupling and value resonance as the key determinant of stability.
The core insight of OT is that values, formalized as V, determine the sign of the contribution made by every other institutional mechanism the organization deploys. Structure, process, and hierarchy amplify whatever V provides—constructive energy when V > 0, entropic acceleration when V < 0. At high growth velocity this amplification is dramatic, and the window for intervention is narrow.
The practical implication is direct: organizations that allow compensation inertia and organizational politics to delay necessary leadership transitions are not merely taking a personnel risk. They are operating a thermodynamic system with a structural flaw that grows more dangerous the faster they grow. The present framework is a first attempt to give that danger a rigorous name and a measurable face.
ACKNOWLEDGMENT
I thank the founders, executives, and board members of the thirty-one participating organizations for their candor and willingness to permit observation of difficult organizational dynamics. All identifying details have been anonymized.
REFERENCES
Bales, R.F. (1950). Interaction process analysis: A method for the study of small groups. Addison-Wesley. Blank, S. and Dorf, B. (2012). The startup owner’s manual. K&S Ranch. Eisenmann, T. (2021). Why startups fail: A new roadmap for entrepreneurial success.
Currency. Fixsen, D.L., Naoom, S.F., Blase, K.A., Friedman, R.M. and Wallace, F. (2005).
Implementation research: A synthesis of the literature. University of South Florida. Lewin, R. (1999). Complexity: Life at the edge of chaos. 2nd ed. University of Chicago Press. Pennebaker, J.W. (2011). The secret life of pronouns: What our words say about us.
Bloomsbury Press. Perrow, C. (1984). Normal accidents: Living with high-risk technologies. Basic Books. Prigogine, I. and Stengers, I. (1984). Order out of chaos: Man’s new dialogue with
nature. Bantam Books. Ries, E. (2011). The lean startup. Crown Business. Schneider, E.D. and Kay, J.J. (1994). “Life as a manifestation of the second law of thermodynamics.” Mathematical and Computer Modelling, 19(6–8), pp. 25–48. Stacey, R.D. (2007). Strategic management and organisational dynamics. 5th ed.
Pearson Education.
FIND THE COMPLETE VOLUME IN THE AHFE DIGITAL BOOKSTORE
Explore the complete digital volume
Human Systems Engineering and Design (IHSED2026): Future Trends and Applications
Read this individual research paper free through the original publisher, or explore the full digital proceedings book.