So Nishina (2026). Measuring What Cannot Easily Be Faked: Development and Validation of the Agenda Engagement and Reward Centricity Scales. In: Human Systems Engineering and Design (IHSED2026): Future Trends and Applications. AHFE Open Access, vol. 237, pp. 332–341. https://doi.org/10.54941/ahfe1008173
The Organizational Thermodynamics framework (OT; Nishina, S., 2025a) predicts that V deterioration in senior leaders can be detected early enough to allow intervention—but only if V deterioration can actually be measured, reliably and without tipping off the leaders under scrutiny. This paper reports development and validation of the AE-RC Scale Battery, operationalizing two OT leading indicators: Agenda Engagement (AE) and Reward Centricity (RC). Study 1 (N = 312) identified a clean 14-item two-factor solution (αᴬᴱ = 0.87, αᴿᶜ = 0.84). Study 2 (N = 218, multi-source) confirmed the factor structure (CFI = 0.96, RMSEA = 0.054), established convergent and discriminant validity, and demonstrated test-retest reliability (rᴬᴱ = 0.79, rᴿᶜ = 0.81). Study 3 validated a behavioral-trace scoring protocol deriving AE and RC from archival enterprise metadata (κ = 0.78–0.83; criterion validity r = 0.71 and 0.67). Together, the three studies deliver a measurement infrastructure that is psychometrically defensible and practically deployable for board-level early-warning monitoring.
There is a particular frustration that organizational researchers will recognize: the most consequential variables are often the hardest to measure. The two constructs introduced in this paper—Agenda Engagement (AE) and Reward Centricity (RC)—are designed to detect a specific form of leadership deterioration in a population sophisticated enough to manage impressions effectively. That detection challenge is the central methodological problem this paper addresses.
The theoretical motivation comes from Organizational Thermodynamics (OT; Nishina, 2025a), which models organizational free energy as G = (U·V) − (S·T) and predicts that V deterioration in a senior leader triggers destructive sublimation—rapid, often irreversible organizational collapse. The early-warning index (EWI) proposed by OT requires detecting V deterioration in behavior before it is visible in outcomes. AE and RC are the proposed behavioral signals.
Received March 8, 2026 Revised June 14, 2026 Accepted July 4, 2026 Available online September 25, 2026
Measuring What Cannot Easily Be Faked: Development and Validation 333 Whether detection is feasible—whether AE and RC can be measured reliably and without tipping off the very leaders under scrutiny—is precisely what this paper investigates. The response I have pursued is twofold: observer- report versions of the battery alongside self-report, so that convergence between them can itself serve as a signal; and behavioral-trace protocols deriving estimates from archival data that leaders do not typically manage. Neither approach is perfect. But the combination is workable.
The paper reports three studies. Study 1: item generation and EFA. Study 2: CFA, multi-source validity, and test-retest reliability. Study 3: behavioral-trace scoring protocol development and validation. A concluding section discusses implications for the OT research program and practical EWI deployment.
CONSTRUCT DEFINITIONS AND NOMOLOGICAL NETWORK Agenda Engagement (AE)
AE is defined as the degree to which a leader’s behavioral output reflects sustained, substantive investment in the organization’s mission agenda. Three properties consistently co-occur in high-AE leaders: proactive contribution to discussions not directly benefiting their own team; sustained ownership of cross-functional commitments; and—most diagnostically—consistency of engagement quality regardless of audience seniority. AE overlaps with proactive work behavior (Crant, 2000) but is anchored to collective mission; it differs from organizational citizenship behavior (Organ, 1988) in targeting strategic contribution rather than interpersonal discretionary help. The trajectory of AE—specifically, its decline—carries more diagnostic weight than its absolute level.
Reward Centricity (RC) RC is the degree to which a leader’s behavioral focus has reoriented from value creation toward personal reward extraction. The diagnostic signal is not ambition but its decoupling from demonstrable contribution: scope expansion, budget accumulation, and title escalation disproportionate to organizational output. Flagging compensation benchmarks while deliverables slip; requesting headcount before existing resources produce results; framing contributions in personal rather than collective terms—these are the recognizable patterns. RC bears a family resemblance to narcissistic leadership (Rosenthal and Pittinsky, 2006) and self-serving attribution (Mezulis et al., 2004), but is situationally rather than dispositionally defined, which implies it may sometimes be reversible (Nishina, 2025d).
Hypothesized Factor Structure The AE-RC Battery is hypothesized to reflect a two-factor oblique structure in which AE and RC are empirically distinct but moderately negatively correlated (r ≈ −0.35 to −0.50). The correlation reflects the tendency for mission disengagement and reward extraction to co-occur as V deteriorates, while remaining below 1.0 because the two constructs index different
334 Nishina behavioral domains. A leader can show RC elevation while AE remains nominally intact—precisely why the EWI specifies the conjunction of both trends.
STUDY 1: ITEM GENERATION AND EXPLORATORY FACTOR ANALYSIS Item Generation
Item generation followed the three-stage procedure described by Hinkin (1998). In stage one, I assembled an initial pool from three sources: deductive derivation from theoretical definitions; inductive review of 47 critical incident narratives from board members, executive coaches, and senior leaders; and review of established adjacent instruments (Meyer and Allen, 1991; Crant, 2000; Organ, 1988; Mezulis et al., 2004) to avoid repackaging existing measures. The initial pool contained 38 items: 22 AE-relevant and 16 RC-relevant. In the second stage, six subject-matter experts—three organizational behavior researchers and three experienced startup advisors—rated items for content adequacy; those below a mean content validity index of 0.80 (Polit and Beck, 2006) were revised or removed, yielding a 26-item refined pool. In the third stage, items were reviewed for social desirability vulnerability and sensitivity to within-person change; all were formatted on a six-point scale (1 = never, 6 = always) to maximize trajectory sensitivity.
Participants and Procedure Study 1 participants (N = 312) were recruited via a professional network panel: senior professionals (director-level and above) in technology-sector companies with more than 50 employees and at least 20% annual headcount growth. Mean age 37.4 years (SD = 6.8); 61% male, 34% female. Mean leadership tenure 6.8 years (SD = 3.9). Participants completed the 26-item pool and additionally rated a nominated direct report, so that observer- report versions received parallel item exposure from the outset.
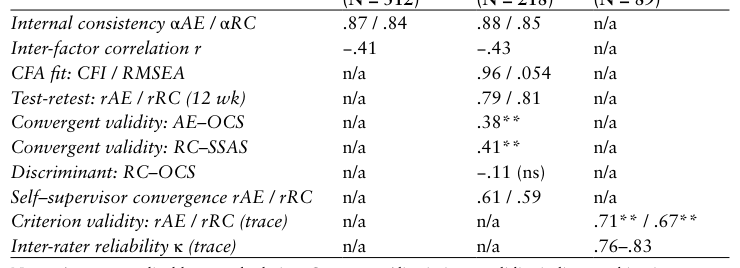
Analysis and Results Principal axis factoring with oblique (promax) rotation was conducted on the 26-item pool. KMO = 0.88; Bartlett’s test χ²(325) = 3,847.2, p < .001. Parallel analysis (Horn, 1965) and the scree plot both indicated a two-factor solution. Twelve items with loadings below 0.45 or cross-loadings above 0.30 were removed iteratively, yielding the final 14-item AE-RC Battery: eight AE items and six RC items. All items loaded cleanly on their assigned factor (AE: 0.51–0.78; RC: 0.54–0.81). The interfactor correlation was r = −0.41, consistent with the hypothesized moderate negative relationship. Internal consistency was satisfactory: αᴬᴱ = 0.87, αᴿᶜ = 0.84.
Table 1: Factor loadings for the AE-RC battery (Study 1 EFA; N = 312). Items sorted by loading within subscale.
Table available in the original PDF paper.
Item F1 (AE) F2 (RC) h²
.78 .08 .62
AE1. Consistently links own work priorities to the organization’s stated mission.
.74 .12 .57
AE2. Volunteers ownership of cross-functional initiatives beyond own role.
.71 .05 .51
AE3. Contribution quality in strategic forums is consistent regardless of audience seniority.
.68 −.09 .48
AE4. Raises issues that are important for the organization even when personally inconvenient.
.65 −.04 .43
AE5. Demonstrates sustained follow-through on organizational commitments over time.
.62 .11 .40
AE6. Actively contributes to discussions that do not directly benefit own team.
.57 −.13 .37
AE7. Challenges own team’s assumptions when this serves the broader organizational goal.
.51 .08 .28
AE8. Treats organizational setbacks as shared problems to solve rather than attributional events.
.10 .81 .66
RC1. Prioritizes acquiring headcount or budget beyond what deliverables require.
−.07 .76 .59
RC2. Frames own contributions prominently in contexts where credit attribution matters.
.04 .73 .54
RC3. Resists changes to role scope that would reduce formal authority.
.09 .68 .47
RC4. References external compensation benchmarks more than internal contribution standards.
−.14 .62 .43
RC5. Political capital is deployed to protect territory rather than advance organizational goals.
.04 .54 .30
RC6. Performance narratives emphasize personal achievement over team or organizational outcomes.
Note. Items phrased for third-party observer ratings; self-report versions use first-person phrasing. From promax-rotated solution; loadings ≥ .45 in bold in the full paper. h² = communality. Inter-factor correlation r = −.41.
STUDY 2: CONFIRMATORY FACTOR ANALYSIS AND CONSTRUCT VALIDITY Participants and Design
Study 2 used a multi-source design (N = 218 focal leader–supervisor dyads from organizations separate from Study 1): each focal leader completed self- report AE-RC Battery alongside three criterion measures; a direct supervisor completed the observer-report version (mean interval 9.4 days, SD = 3.2). A subset (n = 143) completed the Battery again after twelve weeks for test- retest estimation.
Organizational Commitment Scale (OCS). The six-item affective commitment subscale from Meyer and Allen (1991) was selected to assess convergent validity with AE. I expected a significant positive correlation between AE and affective commitment (r > .30), reflecting their shared variance with organizational identification, and a near-zero or non-significant relationship between RC and affective commitment.
Self-Serving Attribution Scale (SSAS). The eight-item measure developed by Mezulis et al. (2004) was included to assess convergent validity with RC. High SSAS scorers systematically attribute positive outcomes to themselves and negative outcomes to external factors—a pattern conceptually adjacent to RC’s reward-extraction orientation. I expected r > .35 between RC and SSAS, and a non-significant relationship between AE and SSAS.
Leader-Member Exchange (LMX-7). The seven-item scale from Graen and Uhl-Bien (1995), completed by supervisors, assesses the quality of the dyadic working relationship. I expected LMX to correlate positively with AE (r > .30) and negatively with RC (r < −.20), on the basis that mission-engaged leadership supports relational quality while reward-extractive behavior strains it.
Results: Confirmatory Factor Analysis CFA was conducted using maximum likelihood estimation in R (lavaan; Rosseel, 2012). The hypothesized two-factor oblique model fit the data acceptably: CFI = 0.96, TLI = 0.95, RMSEA = 0.054 (90% CI [0.041, 0.067]), SRMR = 0.061. For comparison, a constrained one-factor model fit substantially worse: CFI = 0.81, RMSEA = 0.112. The interfactor correlation in the CFA solution was r = −0.43 (SE = 0.07, p < .001), closely replicating the Study 1 EFA estimate. These results establish that AE and RC are empirically distinguishable constructs even under confirmatory constraints.
Table 2: Descriptive statistics, reliability, and intercorrelations (Study 2; N = 218).
6. SSAS 2.89 0.79 −.12 .41** −.17* .39** .08 — Note. N = 218. Reliability coefficients (α) on the diagonal in parentheses. OCS = Organizational Commitment Scale (affective subscale). SSAS = Self-Serving Attribution Scale. LMX-7 results are reported in the text. * p < .05. ** p < .01.
Measuring What Cannot Easily Be Faked: Development and Validation 337 Results: Validity and Reliability
Internal consistency in the Study 2 sample was αAE = .88 and αRC = .85, closely replicating the Study 1 estimates and confirming that scale reliability is not contingent on the item-development sample. The validity pattern closely followed predictions. AE correlated positively with affective commitment (r = .38, p < .01) and supervisor-rated LMX (r = .41, p < .01), with a non-significant correlation with SSAS (r = −.12). RC correlated with SSAS (r = .41, p < .01) and negatively with LMX (r = −.39, p < .01). The RC–affective commitment correlation (r = −.11, p = .11) was weaker than hypothesized, which I find theoretically meaningful: early-stage RC elevation does not necessarily destroy organizational commitment, confirming that commitment surveys cannot substitute for direct RC measurement.
Self-report and supervisor-report versions showed moderate convergent agreement: r = 0.61 for AE and r = 0.59 for RC (both p < .001), consistent with multi-source behavioral assessment norms (Hogan and Shelton, 1998). Test-retest reliability over twelve weeks was r = 0.79 (AE) and r = 0.81 (RC).
STUDY 3: BEHAVIORAL-TRACE SCORING PROTOCOL Rationale
The survey battery has genuine strengths—psychometric rigor, established validity, practical deployability—but requires active participation from leaders who may be motivated to misrepresent. Study 3 addresses this through a complementary protocol operating on archival enterprise metadata rather than self-report, using three data streams available without accessing message content: calendar and conferencing logs (attendance patterns, speaking-time distributions, agenda contribution rates); project and document management logs (initiative ownership, cross-functional collaboration); and communication graph topology features from email and messaging metadata (volume, latency, bridging coefficients). The content- free constraint is deliberate: it enables deployment within standard data governance frameworks.
Protocol Development and Validation In the first development stage, I derived hypothesized behavioral-trace indicators for AE and RC from each data stream, guided by the theoretical definitions and item content of the validated battery. For AE: cross-functional meeting attendance rate relative to role expectations; proportion of meetings in which the leader appeared as an agenda contributor rather than a passive attendee; initiative ownership rate in project management logs; and communication network bridging coefficient. For RC: scope expansion request frequency relative to deliverable completion rate; communication volume directed toward executive-level stakeholders relative to peers and direct reports; and meeting attendance rate in budget and headcount forums relative to strategy and product forums.
338 Nishina In the second stage, these indicators were combined into AE-trace and RC-trace composite scores using regression weights derived from the Study 2 subsample (n = 89 participants with both survey and archival data available). Regression of survey AE scores on AE-trace indicators yielded R² = 0.64; regression of survey RC on RC-trace indicators yielded R² = 0.58. Both models were statistically significant (p < .001).
Three independent coders applied a structured coding manual to a randomly selected subsample of 24 leader-month records. Intraclass correlation coefficients (two-way mixed, absolute agreement) were 0.83 for AE-trace composites and 0.78 for RC-trace composites. Pairwise Cohen’s kappa for the categorical coding decisions embedded in the protocol ranged from 0.76 to 0.83—meeting the κ ≥ 0.70 benchmark recommended by Landis and Koch (1977) for applied behavioral coding. Criterion validity of the trace composites against the survey battery scores was r = 0.71 (AE-trace) and r = 0.67 (RC-trace), both p < .001.
Table 3: Psychometric summary across Studies 1–3.Equation reproduced from the original PDF.Equation reproduced from the original PDF.
DISCUSSION
What the Findings Establish—and What They Do Not Across three studies, the AE-RC Battery has demonstrated that AE and RC are empirically distinguishable, reliably measurable, and nomologically embedded as predicted. The two-factor oblique structure was stable across EFA and CFA. The one departure from prediction—the weaker-than- expected RC–affective commitment correlation—is theoretically informative: some leaders maintain organizational commitment even as their behavior shifts toward reward extraction, confirming that commitment surveys cannot substitute for direct RC measurement. The behavioral-trace protocol achieved criterion validity (r = 0.71, 0.67)—surprisingly high for an indirect measurement approach—confirming that AE and RC are genuinely manifest in organizational behavioral traces.
Measuring What Cannot Easily Be Faked: Development and Validation 339 Considered across the three studies, the validation evidence converges on several quantitative benchmarks worth stating explicitly. Internal consistency was virtually identical in Studies 1 and 2 (αAE = .87/.88, αRC = .84/.85), indicating that item-level reliability is not sample-dependent. The inter-factor correlation replicated closely (r = −.41 in EFA, −.43 in CFA), confirming that AE and RC are related but empirically distinct. Test-retest stability over twelve weeks (r = .79/.81) comfortably exceeds the ≥.70 benchmark recommended for trajectory-sensitive instruments (Clark and Watson, 1995). The convergent and discriminant pattern in Study 2 matched predictions in direction and magnitude for five of six hypothesized correlations; the one departure—the weak RC–OCS correlation—is itself theoretically informative. In Study 3, criterion validity coefficients (r = .71, .67) are high for indirect behavioral measurement and compare favorably to criterion validities reported for established behavioral coding schemes in leadership research (Hogan and Shelton, 1998). Taken together, these indices indicate that the AE-RC Battery meets conventional psychometric standards for a first-generation instrument and is ready for prospective deployment.
What these findings do not establish is predictive validity—whether the AE↓ RC↑ pattern actually forecasts performance deterioration prospectively. That question is addressed in Nishina (2025b). This paper establishes only that AE and RC can be reliably measured—necessary but not sufficient for the EWI’s practical utility.
Limitations Three limitations deserve acknowledgment. The validation samples were concentrated in technology-sector, high-growth organizations; generalizability to non-profits, established corporations, or non-Western contexts remains an open question addressed in Nishina (2025e). The twelve-week test- retest window informs short-term stability but not sensitivity to the gradual trajectory changes the EWI requires. The behavioral-trace protocol depends on enterprise system data unevenly available across organizations. And self- report vulnerability to impression management, while mitigated by the multi- source and trace channels, cannot be fully eliminated; for high-stakes EWI monitoring, self-report scores should be treated as one input among several.
Implications For the OT research program, the Battery provides the measurement infrastructure required to advance from theoretical framework to empirical science. The behavioral-trace protocol opens a broader methodological direction: inferring behavioral-dispositional constructs from organizational metadata without active respondent participation or content access—a scalable, privacy-respecting approach whose applicability extends well beyond OT.
CONCLUSION
The AE-RC Scale Battery, validated across three studies and two operationalization approaches, provides a measurement foundation for the OT research program that is both psychometrically defensible and practically deployable. That the constructs hold up across self-report, observer-report, and behavioral-trace modalities—and that the convergence between modalities is itself informative—is, I think, the most important result reported here. It means that what AE and RC are trying to capture is genuinely present in the behavioral record, not merely in how people describe themselves. For a framework whose central claim is that value resonance deterioration can be detected before organizational collapse, that is the finding on which everything else depends.
ACKNOWLEDGMENT
I thank the organizational leaders who participated across all three studies, and the six subject-matter experts whose content validity work shaped the final battery. The three independent coders in Study 3 performed painstaking work that I could not have done alone; their contribution to the reliability estimates is substantial.
REFERENCES
Clark, L.A. and Watson, D. (1995). “Constructing validity: Basic issues in objective scale development.” Psychological Assessment, 7(3), pp. 309–319. Crant, J.M. (2000). “Proactive behavior in organizations.” Journal of Management,
26(3), pp. 435–462. Graen, G.B. and Uhl-Bien, M. (1995). “Relationship-based approach to leadership: Development of leader-member exchange (LMX) theory of leadership over 25 years.” Leadership Quarterly, 6(2), pp. 219–247. Hinkin, T.R. (1998). “A brief tutorial on the development of measures for use in
survey questionnaires.” Organizational Research Methods, 1(1), pp. 104–121. Hogan, R. and Shelton, D. (1998). “A socioanalytic perspective on job performance.”
Human Performance, 11(2–3), pp. 129–144. Horn, J.L. (1965). “A rationale and test for the number of factors in factor analysis.”
Psychometrika, 30(2), pp. 179–185. Landis, J.R. and Koch, G.G. (1977). “The measurement of observer agreement for categorical data.” Biometrics, 33(1), pp. 159–174. Meyer, J.P. and Allen, N.J. (1991). “A three-component conceptualization of
organizational commitment.” Human Resource Management Review, 1(1), pp. 61–89. Mezulis, A.H., Abramson, L.Y., Hyde, J.S. and Hankin, B.L. (2004). “Is there a universal positivity bias in attributions? A meta-analytic review of individual, developmental, and cultural differences in the self-serving attributional bias.” Psychological Bulletin, 130(5), pp. 711–747. Nishina, S. (2025a). Organizational Thermodynamics: A phase transition model
of value resonance and entropic collapse in high-growth startups. [IHSED 2026 Proceedings].
Measuring What Cannot Easily Be Faked: Development and Validation 341 Nishina, S. (2025b). Destructive sublimation in practice: A prospective longitudinal
study of organizational phase transitions in technology startups. [Under review]. Nishina, S. (2025d). Can V be recovered? Conditions and mechanisms of value resonance rehabilitation in senior organizational leaders. [Under review]. Nishina, S. (2025e). Organizational Thermodynamics beyond the startup: Testing
the generalizability of the OT framework in established corporations, non-profits, and cross-cultural contexts. [Under review]. Organ, D.W. (1988). Organizational citizenship behavior: The good soldier syndrome. Lexington Books. Polit, D.F. and Beck, C.T. (2006). “The content validity index: Are you sure you know
what’s being reported?” Research in Nursing and Health, 29(5), pp. 489–497. Rosenthal, S.A. and Pittinsky, T.L. (2006). “Narcissistic leadership.” Leadership Quarterly, 17(6), pp. 617–633. Rosseel, Y. (2012). “lavaan: An R package for structural equation modeling.” Journal
of Statistical Software, 48(2), pp. 1–36.
FIND THE COMPLETE VOLUME IN THE AHFE DIGITAL BOOKSTORE
Explore the complete digital volume
Human Systems Engineering and Design (IHSED2026): Future Trends and Applications
Read this individual research paper free through the original publisher, or explore the full digital proceedings book.