Dermot Hale, Enda F. Fallon (2020). Assessing the Precision of Anthropometric Measurements: A Six Sigma Approach. In: Advances in Applied Digital Human Modeling. AHFE Open Access, vol. 11. https://doi.org/10.54941/ahfe100410
Centre for Occupational Health & Safety Engineering & Ergonomics (COHSEE) Discipline of Mechanical Engineering College of Engineering and Informatics National University of Ireland, Galway Galway, Ireland
Anthropometrics is the measurement of dimensions of the human body defined between fixed anatomical landmarks (). The human body however does not generally lend itself to simple measurement as the limits or position of anatomical landmarks can often be open to interpretation. Given that effective anthropometric practices are dependent on the validity of the anthropometric data, it is critical that anthropometrists have confidence in the data they use. This paper discusses existing practices in determining anthropometric measurement error and introduces the Six Sigma technique, Gauge Repeatability & Reproducibility, to the discipline of anthropometry.
Anthropometrists have long appreciated the need to ensure confidence in the capability of anthropometric measuring instruments (Jamison & Zegura, 1974). Confidence in measurement instruments is based on the accuracy and precision of measurements taken. Accuracy is defined as the ability to measure the true value correctly, whereas, precision is defined as the closeness of the measured readings to each other (Dawson, 2004). In Figure 1, the bull’s- eye of the target is considered to be the true value of the measured characteristic. The measured values are represented by the plus sign. The top left segment of the figure represents the desired state with regard to the measurement system, where the measurements are both accurate and precise. The top right segment is an indication of precision but inaccurate measurements. The bottom left segment depicts measurements which are accurate but imprecise. In the bottom right segment, the measurements are neither precise nor accurate.
Figure 1: Concepts of Accuracy and Precision
Figure available in the original PDF paper.
Determining the accuracy of the measuring device through calibration should be the first step in assessing a measurement method. The calibration should be traceable to applicable National and/or International standards. Determining the precision is a function of determining the error when the instrument is used.
The most common method of expressing error in anthropometry is by means of the Technical Error of Measurement (TEM) (Pederson & Gore, 1996). The TEM defines the standard deviation of repeated measurements. The TEM enables anthropometrists to quantify the measurement error when taking and repeating anthropometrical measurements (intra-evaluator) and when comparing their measurement with measurements from other anthropometrists (inter-evaluator). Harris and Smith (2009) contend however, that few studies actually quantify TEM. Furthermore the effectiveness of the TEM has been questioned. Ulijaszek and Kerr (1999) suggest that the lack of reporting of measurement error in anthropometric studies is due to the difficulty in interpreting TEM values in the context of the particular data collected. It is evident therefore, that a more robust and standardised method for evaluating measurement error in anthropometric measuring systems instruments is desirable.
This work reported in this paper seeks to address this issue by introducing the Six Sigma tool of Gauge Repeatability and Reproducibility (Gauge R&R) to the domain of anthropometrics (Breyfogle, 2003). Similar to the TEM, Gauge R&R is a statistical method of determining the variation introduced by the measurement instrument and the anthropometrist. Unlike the TEM however, the output of Gauge R&R provides a standardized acceptance criteria threshold for acceptability of the anthropometric measuring system. In using a standardised approach it is possible to benchmark the effectiveness of a specified instrument against alternative instruments and against specified expected levels of measurement performance.
TECHICAL ERROR OF MEASUREMENT The Technical Error of Measurement (TEM) is described as a representation of ‘the typical magnitude of measurement error that one can expect to occur’ (Knapp, 1992). TEM is quantified by taking repeated measurements of the same objects as it has been generally assumed that the mean of a series of repeated measurements is the best available estimate of an object’s true size (Harris & Smith, 2009). Dahlberg, in 1940, published the following formula for the TEM:
n
2
d
Equation reproduced from the original PDF.
2
(di−d )
Equation reproduced from the original PDF.Figure 2: Distribution of the true random error SD as sample size increases
Figure available in the original PDF paper.
This finding echoes the recommendation of Houston (1983) that a minimum of 25 replicate measurements must be taken to ensure acceptable anthropometric data. Springate (2012) concludes that where the study contains fewer than
GAUGE REPEATABILITY AND REPRODUCIBILITY Gauge Repeatability and Reproducibility (Gauge R&R) is a statistical method for determining if a measurement system is suitable for its intended use. Gauge R&R is a key tool of Six Sigma and is well established in medical device, pharmaceutical and automotive manufacturing. Breyfogle III (2003) describes Gauge Repeatability as the variation in measurements considering one part and one operator, and gauge reproducibility as the variation between operators measuring one part. The Gauge R&R test can also be used to compare the measurement uncertainty with the tolerance interval of the process or product characteristic to be measured, which is expressed as a percentage, to determine the acceptability of the measurement instrument (ISO, 2011).
(Burdick, Borror, & Montgomery, 2005) state that the purpose of a Gauge R&R study is to:
In mathematical terms the total variability in measurement data can be expressed as: σ 2Total=σ 2 parts+σ 2measurement system
The variability of the measurement system (σ
2measurement system can further be described as the product of σ
2repeatability andσ 2reproducability. Calculations of variance are achieved using ANOVA methods. Once the variation has been calculated the Gage R&R percentage (precision to total variation) can be calculated as follows: %GageR&R = σ
2measurement system σ
2Total x 100 (Picard, Page, Kierstead, & Page, 2002) ISO 13053: Quantitative Methods in Process Improvement - Six Sigma advises using the following structured method for conducting a Gauge R&R study (ISO, 2011):
Select which components need to be measured.
Have several operators make repeated measurements (for example, 10 components each measured three times by three operators).
Analyse the results with a spreadsheet or through specialised statistical software (calculation and graphical display).
Interpret.
Decide whether the measurement system is acceptable The standard advises that the usual decision criteria are:
GRR< 10 %: the measurement system is acceptable;
10 %<GRR< 30 %: the measurement system needs improvement.
GRR> 30 %: the measurement system is unsuitable.
ISO 13053 further recommends that specialised software should be used to run the calculations and format the results (ISO, 2011). While Gauge R&R can be calculated from first principles, the use of statistical software such as Minitab allows for more practical application of the tool.
In the context of anthropometrics, the operator represents the person taking the measurement and the part/component represents the measurement to be taken. The Gauge R&R tool will facilitate the anthropometrist in understanding where measurement error is occurring; whether it is primarily a repeatability difficulty where the anthropometrist cannot achieve consistency in his/her own measurements or a reproducibility issue where the results between two or more anthropometrists is inconsistent. In the following example, the Gauge R&R approach will be applied to the measurement of the anthropometric dimension Bi-deltoid Breadth of a cohort of university students.
APPLICATION OF GAUGE R&R TOOL In applying the Gauge R&R tool, the five step systematic method as described by ISO 13053: Quantitative Methods in Process Improvement - Six Sigma was followed. In the following sections the activities undertaken for each step are described and discussed. The anthropometric measurement system analyzed consisted of students trained in the use of an anthropometric calipers and the identification of Bi-deltoid landmarks. The task to be completed involved the measurement of the anthropometric dimension Bi-deltoid Breadth in a cohort of students. The goal of this demonstrative use of the Gauge R&R tool is to determine if this measurement system is suitable for use in measuring the bi-deltoid breadth of adults (both males and females).
Step 1: Select which components need to be measured.
In this study a cohort of university students were selected as the ‘components’ which needed to be measured. A total of thirteen students volunteered for the study. Prior to its commencement, each student was provided with an information sheet which explained the nature of the study. They were informed that all data collected would be anonymous and confidential and only used for the purposes of the study. Participants signed a consent form and were assured that they could withdraw from the study at any time. For the purpose of confidentiality each student was randomly assigned a number from 1 to 13.
Step 2: Have several operators make repeated measurements A total of three operators made repeated measurements in this study. Each ‘operator’ had previous experience in the use of the anthropometric calipers and the identification of anthropometric landmarks. Graphical aids were used to explain the definition of Bi-deltoid Breadth and its associated landmarks. The international standard ISO 7250-1 Basic Human Body Measurements for Technological Design - Part 1: Body Measurement Definitions and Landmarks were used as the basis of the graphical aids.
ISO 7250-1 defines Bi-deltoid Breadth as the distance across the maximum lateral protrusions of the right and left deltoid muscles (ISO, 2008). Dimension D2 in Figure 3 below shows this dimension graphically:
Figure 3: Bi-deltoid breadth (Dimension D2)
Figure available in the original PDF paper.
ISO 7250-1 states that a large sliding caliper or large spreading caliper should be used and that the subject should sit or stand fully erect with the shoulders relaxed in the standard sitting or standard standing posture.
Measurements were taken in the standard sitting posture. Each ‘operator’ measured each of the 13 ‘components’ three times in a random order. The measurement data was removed at the end of each of the three trials to prevent bias from feedback. A data collection sheet was utilised to ensure the data was collected systematically and the ambient environment was controlled for the duration of the study.
Step 3: Analyse the results with a spreadsheet or through specialized statistical software As recommended by ISO 13053 (ISO, 2011) specialised software was used to calculate the Gage R&R values and format the results, in this case Minitab Version 16 was used. A Crossed Gage R&R was conducted with a study variation of 5.15σ (5.15 is the number of standard deviations needed to capture 99% of the variation (Picard, et al., 2002) and included 95% confidence intervals.
Table 1 below shows the results from the Minitab session window:
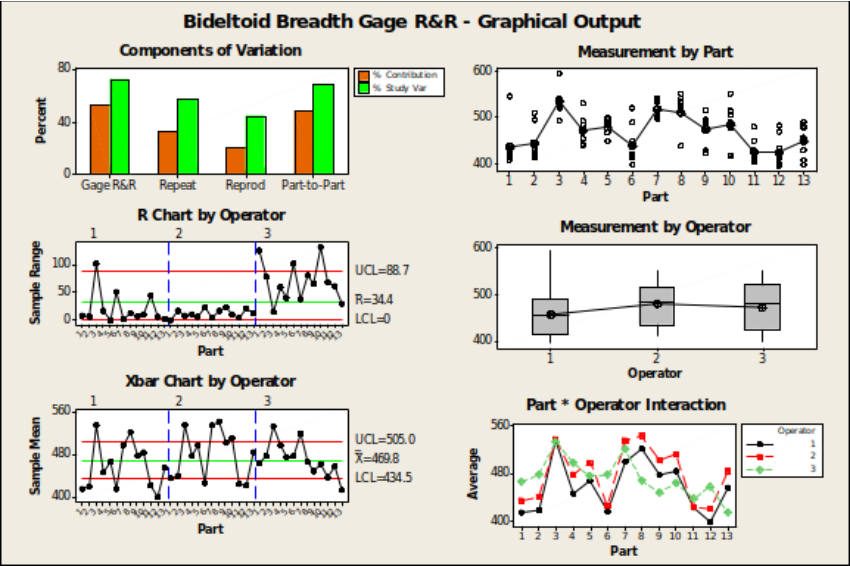
In Figure 4 below the Minitab Gage R&R graphical output is shown:
Figure 4: Minitab Gage R&R Graphical Output
Step 4: Interpret As can be seen in Table 1, the main output of the Minitab Gage R&R function is a %Study Variation and a %Contribution table. Both tables can be used to determine where variation is occurring. The %Contribution table can be convenient because the Total Gage R&R and Part-to-Part variation sum to 100%. The %Study Variation expresses Standard Deviation in the same units as the process data, and therefore can be used to form other metrics, such as %Tolerance (if you enter in specification limits for your process), and %Process (if you enter in an historical Standard Deviation). Generally the %Study Variation is used to interpret results.
The Total Gage R&R obtained for this study was 72.36%, with a repeatability value of 56.85% and a reproducibility value of 44.76%. It is evident that as the Total Gage R&R is greater than 30%, the measurement system in its current format is unacceptable for use. While the repeatability (operator replicating measurements) aspect of the Gage R&R is a higher contributor (56.85%) to total variation than reproducibility (44.76%) (operators measuring the same part), both are still greater than the 30% threshold. In order to investigate where improvements in the measurement system need to be made it is useful to examine the Minitab graphical output.
In the ‘R Chart by Operator’ graph there is an evident difference in the range of repeatability measurements taken by each individual operator. Operator 2 achieved the most consistent results when repeating measurements while Operator 3 obtained a range of 132mm when replicating the measurement of ‘component’ number 10. Despite having similar experience and access to the same measuring equipment and Graphical aids, the effectiveness of each operator in conducting the measurements is not equal. It is worth noting also that no specific issues which could explain the measurement errors were identified during the stud.
The other graphs of interest are the ‘Measurement by Part’ and ‘Part * Operator Interaction’. In these graphs it can be seen that ‘component’ numbers 1, 6 and 10 showed the most variation in measurement while ‘component number 7 showed consistent measurement.
Step 5: Decide whether the measurement system is acceptable As discussed in Step 4 the measurement system in its current state is unacceptable for use as the Total Gage R&R is greater than 30%. In order to improve the measurement system the following actions could be taken:
Operators could be provided with advanced training in the use of the calipers and the identification of the relevant anthropometric landmarks
The calipers could be replaced by a more robust measurement instrument/system such as a laser based one
The possible effect of fatigue in repeating measurements could be assessed After any change the measurement system should be re-assessed to determine if the changes have sufficiently improved the repeatability and reproducibility requirements of Gauge R&R to meet the 30% threshold limit.
DISCUSSION AND CONCLUSIONS In the Bi-deltoid Breadth measurements it was shown that the range of replicated measurements of individuals varied considerably. Subsequent Technical Error of Measurement (TEM) values would also vary considerably for the measurements taken for each person due to this variance in range. Therefore a TEM statistic can only be valid for the specific replicated measurements and cannot be used to pre-emptively assess how a measurement system will perform. Furthermore, it has been shown that anthropometrists’ must take a minimum of 25 replicate measurements of each anthropometric dimension in order to calculate the TEM. Gage R&R, on the other hand, can be used to establish pre-emptively if a measurement system is suitable for use. This method is of particular benefit where a large number of individuals will be measured, where the replications and calculations required for the TEM would be time consuming.
The demonstration of the application of the Gage R&R tool has also provided an important insight into measurement error in anthropometrics. It has been shown that it cannot be presumed that all anthropometrists will be equally skilled in anthropometric measurement despite having similar experience, and being provided with graphical aids on how to obtain anthropometric measurements according to international standards. While no special causes were evident during the study, the repeatability variance can be expected to be a result of personal factors such as the appraisers’ style of measurement or landmark interpretation and reproducibility variance may be caused by fatigue and/or experience from previous measurements.
While TEM is most suitable for calculating measurement error in studies involving small numbers of anthropometric dimensions, the Gage R&R method has been shown to be a useful tool for preemptively evaluating measurement systems in studies involving large number of anthropometric dimensions guidance on the sources of variation in such studies.
REFERENCES
Breyfogle, F. W. (2003). Implementing Six Sigma : smarter solutions using statistical methods (2nd ed.). New York Chichester: Wiley. Breyfogle III, F. W. (2003). Implementing Six Sigma: smarter solutions using statistical methods: Wiley. com. Burdick, R. K., Borror, C. M., & Montgomery, D. C. (2005). Design and Analysis of Gauge R and R Studies:
Making Decisions with Confidence Intervals in Random and Mixed ANOVA Models (Vol. 17): SIAM. Dahlberg, G. (1940). Statistical methods for medical and biological students. Statistical Methods for Medical and Biological Students. Dawson, B. (2004). Machine Vision Makes Gaging Easy. Quality Magazine. Harris, E. F., & Smith, R. N. (2009). Accounting for measurement error: a critical but often overlooked process.
Archives of Oral Biology, 54, S107-S117. Houston, W. (1983). The analysis of errors in orthodontic measurements. American journal of orthodontics, 83(5), 382-390. ISO. (2008). Basic human body measurements for technological design -- Part 1: Body measurement definitions and
landmarks. Geneva: ISO/TC 159/SC 3. ISO. (2011). ISO 13053-2:2011 Quantitative methods in process improvement -- Six Sigma -- Part 2: Tools and techniques. Geneva: ISO/TC 69/SC 7. Jamison, P. L., & Zegura, S. L. (1974). A univariate and multivariate examination of measurement error in
anthropometry. American journal of physical anthropology, 40(2), 197-203. Knapp, T. R. (1992). Technical error of measurement: a methodological critique. American Journal of Physical Anthropology, 87(2), 235-236. Pederson, D., & Gore, C. (1996). Anthropometry measurement error: Sydney: University of New South Wales
Press. Picard, D., Page, D., Kierstead, M., & Page, B. (2002). The black belt memory jogger: a pocket guide for Six Sigma success. USA, GOAL/QPC. Springate, S. (2012). The effect of sample size and bias on the reliability of estimates of error: a comparative study
of Dahlberg's formula. The European Journal of Orthodontics, 34(2), 158-163. Ulijaszek, S. J., & Kerr, D. A. (1999). Anthropometric measurement error and the assessment of nutritional status.
British Journal of Nutrition, 82, 165-177.
LISTED IN THE AHFE DIGITAL BOOKSTORE CATALOGUE
Explore the complete digital volume
Advances in Applied Digital Human Modeling
Read this individual research paper free through the original publisher, or explore the full digital proceedings book.
ISBN 978-1-4951-2094-7
Explore this ISBN in the AHFE Bookstore ↗Listed in the July 2026 bookstore catalogue; search by ISBN to confirm current availability · Digital book purchase optional