Richard Sesek, Ruoliang Tang, Celal Güngör, Sean Gallagher (2020). Using MRI-Derived Spinal Geometry to Compute Back Compressive Stress (BCS): a New Measure of Low Back Pain Risk. In: Advances in Applied Digital Human Modeling. AHFE Open Access, vol. 11. https://doi.org/10.54941/ahfe100407
Back compressive force (BCF) is a commonly used surrogate for the risk of developing low back pain. Point force estimates of spinal loading have been shown to predict low back pain in epidemiological studies. However, they are an imperfect measure and can over- or under-estimate risk, particularly for very large or small individuals. A logical means to normalize risk over a varied population is to convert these forces to stresses (force/unit area). To achieve this, Magnetic Resonance Imaging (MRI) scans were used to provide area measurements for the intervertebral discs and vertebral bodies of the lumbar region (L3/L4, L4/L5, & L5/S1 segments). Various regression models were explored based on individual subject gross anthropometry. These models allow for the estimation of intervertebral disc (IVD) size using easily measured anthropometric characteristics such as height and gender. Converting the BCF to a back compressive stress (BCS) normalizes and personalizes risk estimates for subjects of varying sizes. Back compressive force data from a previous study was converted to back compressive stress to determine if risk estimates could be improved. Using peak BCF with a cut point of 3400 N (~770 lbs) yielded an odds ratio of 2.76 (1.2-6.6) to predict jobs with injuries and discomfort. Using BCS with a cut point of 280 N/cm2, which corresponds to 3400 N load applied to a 50th percentile female L5/S1 IVD area, improved the odds ratio to 5.78 (1.8-18.4). Normalizing for the size of a subject’s IVD shows great promise for improving the predictive abilities of biomechanical assessment methods.
Low back pain (LBP) has been a major socioeconomic burden to modern society, remaining one of the most prevalent health problems in the world for decades (Degenais, Caro, & Haldeman, 2008; Deyo, Mirza, & Martin, 2006; Gore, Sadosky, Stacey, Tai, & Leslie, 2012; Sesek, Gilkey, Drinkaus, Bloswick, & Herron, 2003). A number of studies have suggested that the risk factors for LBP are multifactorial, including personal demographics, physical job factors, psychosocial characteristics, and prior LBP history (Manchikanti, 2000; Rubin, 2007). In addition, it has been generally accepted in the literature that a majority of LBP complaints have mechanical exposure as the origin (Tang, 2013). The effect of mechanical loading on the lumbar spine can be detrimental (Evans & Lissner, 1959, Nachemson, 1960; Sonoda, 1962; Adams & Hutton, 1983; Brinckmann, Johannleweling, Hilweg, & Biggemann, 1987). Epidemiological evidence suggests that in occupational settings, LBP is prevalent among workers performing manual material handling (MMH) tasks (Andersson, 1998; Marras, 2000) which represents over 20% of total Workers’ Compensation (WC) cost (Hashemi, Webster, & Clancy, 1998; Liberty Mutual Research Institute for Safety, 2009). In response to the staggering economic burden facing the industry, a number of studies have sought to develop ergonomic evaluation methods or “tools” to assess the physical demand of MMH jobs and the associated risk of LBP (Chaffin, 1969; National Institute for Occupational Safety and Health, 1981; Waters, Putz-Andersson, Garg, & Fine, 1993; Marras, Lavender, Leurgans, Rajulu, Allread, Fathallah, and Ferguson, 1993; Merryweather, Loertscher, & Bloswick, 2009). For less frequent lifting tasks, biomechanical criteria that focus on the physical limits of the lumbar spine under loading are regarded as the most important (Waters et al., 1993). Using kinetic and kinematic analyses, biomechanical models can estimate the internal response to an external load, which then can be compared with spine tolerance data to evaluate the risk of potential injuries (Chaffin & Park, 1973; Waters et al., 1993). Although biomechanical models vary in capability to analyze complex spinal motions (2D vs. 3D), a back compressive force (BCF) of 3400 N (~770 lbs) has been well accepted in the literature as the cut-off point, above which potential tissue damage may occur (NIOSH, 1981; Waters, 1993; Merryweather et al., 2009).
It should be noted that one fundamental assumption of many biomechanical models and ergonomic tools is a simplified description of spinal geometry with the lumbosacral disc (L5/S1) being the pivot point at which the BCF is applied. However, as mechanical theory states, tolerance of the disc to compressive loading, as measured by force, is also dependent on the size of the disc (Tang, 2013). Evidence has shown a lot of variation in spinal geometry among populations (Tang, Güngör, Sesek, Foreman, Gallagher, and Davis, 2014a). Depending on the individual characteristics, a BCF measure is likely to attribute to over- or under-estimate the LBP risk, particularly for very large or small individuals. A logical means to normalize risk over a varied population is to convert these forces to stresses (force/unit area), namely the back compressive stress (BCS). The purpose of this study was to determine if BCF-based ergonomic risk estimation could be improved by converting to BCS risk estimates that consider the size of a subject’s intervertebral disc (IVD).
METHOD
Data used for this investigation were gathered from two previous studies:
1) an automotive manufacturing ergonomic field study and
2) a morphometric study of low back geometry using MRI technology.
Automotive Study Data were analyzed from a database consisting of 667 manufacturing jobs from a previous automotive study. The database included historical injury data for the analyzed jobs as well as symptom interviews for 1,022 participants. A subset of 188 subjects with manual material handling tasks was selected for the current study. The subjects ranged in height from 150-203 cm (176.3 ± 9.8), weighed between 52-159 kg (86.3 ± 19.6), and were 22-65 years of age (41.4 ± 11.2). There were 144 male and 44 female subjects. Researchers had no personal information regarding participants beyond height, gender, and self-reported level of discomfort. All data were analyzed in aggregate. The original data were collected at six different automotive plants. Only manufacturing jobs with well-defined activities were included (administrative jobs or jobs that did not have well defined tasks were not analyzed). Subject data used for this study include height and gender (which were used to estimate the lower lumbar spinal geometry) and subject reports of discomfort assessed by ratings of perceived discomfort. In the original study, a peak BCF with a cut point of 3400 N (~770 lbs) was used to predict jobs with injuries. Peak BCF ranged from 441-6424 N (2552 ± 1210). Negative health outcomes were defined as self-reported low back pain (LBP) and LBP- related medical visits reported for the subject’s job. Cases included subjects with reported low back pain working on jobs that had at least one reported injury in the previous year. Controls included subjects with no low back pain working on jobs that had not had a reported injury in the previous year. The prevalence of low back pain for this population was 0.14.
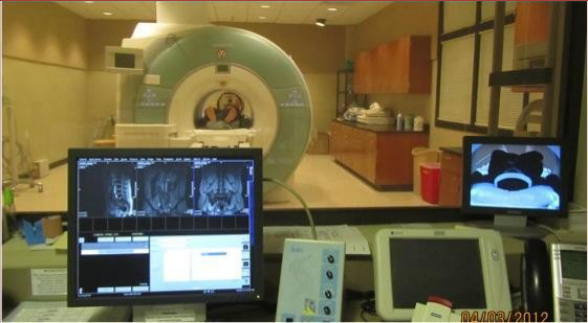
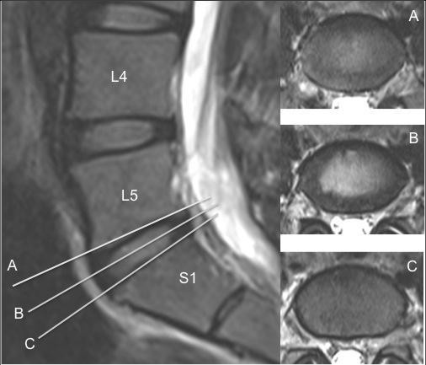
Figure 1. MRI scanning operation at Auburn University MRI Research CenterFigure 2. Sample of MRI scan in sagittal and transverse planes
Experimental Design For each subject, a BCF was calculated as in the original automotive study (at the L5/S1 IVD). Back compressive stress (BCS) was calculated by dividing BCF by an estimate of the L5/S1 IVD CSA through the center of the IVD as shown in Figure 2. The IVD CSAs were estimated using a regression relationship developed in the previous MRI study (Tang et al., 2014b). This relationship is shown in Equation 1 below.
Equation reproduced from the original PDF.
Equation 1: regression relationship of height (HT) and gender (GNDR) to IVD cross-sectional area.
The IVD CSAs ranged from 9.87– 21.11 cm2 (15.90 ± 2.31). The BCS estimates ranged from 28.54 – 422.56 N/cm2 (162.66 ± 78.14). The cut point for the BCS-based risk classification was selected by determining the BCS for a 50th percentile female L5/S1 disc loaded to 3400 N (~770 lbs). This corresponds to a 280 N/cm 2 BCS (163 cm stature assumed for a 50th percentile US woman) (Halls & Hanson, 2014). The BCS risk estimation method presented here is predicated on the concept that for a healthy back the ultimate load (force) that it can safely withstand is a function of the stress (force/unit area) to which it is subjected, not simply the overall force. In other words, a larger load- bearing surface can handle (distribute) a higher force than a smaller load-bearing surface. Therefore, the BCS model assumes that individuals with larger IVDs can handle higher forces than individuals with smaller IVDs, but the same stress limits (force/unit area) are assumed for each. In practice, BCF-based models tend to overestimate risk for larger (taller) workers (with proportionally larger IVDs) and underestimate risk for smaller (shorter) workers. This BCS model is intended to correct this deficit.
Analysis Direct comparisons are made between the predictions of a peak BCF model and a peak BCS model computed using area estimates of subject IVDs. Comparisons were made on the basis of predictive ability, sensitivity, specificity, and odds ratios for these tools.
RESULTS
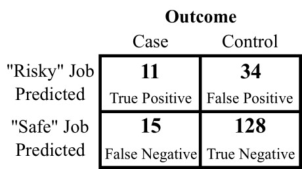
Figure 3 illustrates performance of the traditional BCF model in identifying “risky” jobs (jobs likely to result in the symptoms and injuries for workers) in the previous automotive study. A statistically significant odds ratio of 2.76 (1.2-6.6) was found for this model.
Figure 3: BCF 2x2 Outcome Matrix (cut point 3400 N)
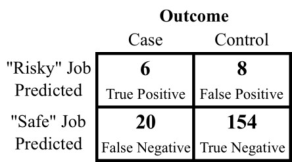
Figure 4 depicts the performance of the BCS model in identifying “risky” jobs for these same automotive jobs. The odds ratio improved to 5.78 (1.8-18.4) due mainly to decreases in false positives associated with the BCF model.
Figure 4: BCS 2x2 Outcome Matrix (cut point 280 N/cm2)
Table 1 compares the performance of the BCF and BCS models in predicting cases and controls. Agreement (prediction of case/control status) improved from 75% to 85%, positive predictive value (PPV) nearly doubled to 0.43, and specificity rose to 0.95. Sensitivity, however, dropped from 0.42 to 0.23. Negative predictive value (NPV) was relatively unchanged.
DISCUSSION
The concept of back compressive stress (BCS) has great potential for improving the predictive ability of Applied Digital Human Modeling & Simulation (2020) biomechanical models. Accounting for personal characteristics, particularly for persons who differ significantly from the average, can help progress the field of biomechanics. Ideally, as an ergonomic survey tool is perfected, all performance characteristics improve (sensitivity, specificity, PPV, NPV). While overall performance improved significantly with the BCS model, sensitivity dropped significantly (0.42 to 0.23). From a utility perspective, a practicing ergonomist might prioritize improvements to PPV and NPV since these conditional probabilities provide the ergonomist with the most relevant information and conclusions about how to act on the results of survey tool outputs. In this regard, the BCS was a great improvement. However, limitations in this experiment suggest ways that model output could be further improved, perhaps without compromise to sensitivity.
Table 1: Comparison of BCF and BCS BCF BCS
Table available in the original PDF paper.
3400 N (~770 lb) 280 N/cm2 Odds Ratio (95% CI) 2.76 5.78
(1.2-6.6) (1.8-18.4) Agreement 75% 85%
Sensitivity 0.42 0.23 Specificity 0.79 0.95
Positive Pred. Value (PPV) 0.24 0.43 Negative Pred. Value (NPV) 0.90 0.89
Limitations There are several limitations associated with this pilot study that should be addressed as the BCS concept is explored further. These limitations can be summarized into two major categories:
1. Assumptions regarding personal characteristics: It was assumed that stress capabilities are consistent across individuals. There may be differences based on age, gender, previous injuries, and other personal factors not considered in this research. These should be explored in subsequent research. 2. Overly simplistic assessment of risk: Peak compressive and peak compressive stress were the measures of LBP risk. These peak measures do not consider task frequency, duration, and static postures that may greatly impact risk. Subsequent studies should provide a more comprehensive consideration of LBP related risk factors.
Given the limitations described above, the BCS tool performed well and it is anticipated that it can easily be incorporated into new or existing models by simply considering the subject’s basic anthropometry (height and gender in this study). There is also the possibility that the risk estimation of other ergonomic tools that do not directly compute BCF can be enhanced. The stress model concept could be used to “scale” risk outputs from other tools based upon the size of the individual subject. For example, the Revised NIOSH Lifting Equation (RNLE) could include an additional multiplier that simply scales risk up or down as compared to reference subject.
CONCLUSIONS
Based on the findings of this study, the following conclusions are drawn:
1. Back Compressive Stress (BCS) shows great promise as a means of improving risk assessments, particularly for relatively large and small subjects and should be explored further.
2. The concept of “scaling” risk based on subject size and modifying ergonomic survey tool outputs with this data should be explored.
3. Accounting for personal characteristics can help improve ergonomic modeling. Other factors that could be considered include age, obesity, previous injury history, and physical condition.
Acknowledgements
This research was made possible by a grant from the National Institute for Occupational Safety and Health (NIOSH) Deep South Center for Occupational Health and Safety Education and Research Center [Grant UAB-0002864-019]. The authors would like to acknowledge Dr. Thomas Denney and Dr. Ron Beyers of the Auburn University MRI Center and Dr. James V. Carnahan for their assistance in the conduct of this research.
REFERENCES
Adams, M. A., & Hutton, W. C. (1983). The effect of fatigue on the lumbar intervertebral disc. J Bone Joint Surg Br, 65 (2), 199-
203. Andersson, G. B. (1998). Epidemiology of low back pain. Acta Orthop Scand Suppl, 281, 28-31. Brinckmann, P., Johannleweling, N., Hilweg, D., & Biggemann, M. (1987). Fatigue fracture of human lumbar vertebrae. Clinical Biomechanics, 2 (2), 94-96. Chaffin, D. B. (1969). A computerized biomechanical model-development of and use in studying gross body actions. J Biomech,
2 (4), 429-41. Chaffin, D. B., & Park, K. S. (1973). A longitudinal study of low-back pain as associated with occupational weight lifting factors.
Am Ind Hyg Assoc J, 34 (12), 513-25 Dagenais, S., Caro, J., & Haldeman, S. (2008). A systematic review of low back pain cost of illness studies in the United States and internationally. The Spine Journal, 8 (1), 8-20. Deyo, R. A., Mirza, S. K., & Martin, B. I. (2006). Back pain prevalence and visit rates: estimates from U.S. national surveys,
2002. Spine (Phila Pa 1976), 31 (23), 2724-7. Evans, F. G., & Lissner, H. R. (1959). Biomechanical studies on the lumbar spine and pelvis. J Bone Joint Surg Am, 41-A(2), 278-90. Gore, M., Sadosky, A., Stacey, B. R., Tai, K.S., & Leslie, D. (2012). The burden of chronic low back pain: clinical comorbidities,
treatment patterns, and health care costs in usual care settings. Spine (Phila Pa 1976), 37 (11), E668-77. Halls, S. B., & Hanson, J. (2014) Average height and weight charts. Retrieved on February 25, 2014, from: http://www.halls.md/chart/women-height-w.htm Hashemi, L., Webster, B. S., & Clancy, E. A. (1998). Trends in disability duration and cost of workers' compensation low back
pain claims (1988-1996). J Occup Environ Med, 40 (12), 1110-9. Liberty Mutual Research Institute for Safety. (2009). Liberty Mutual workplace safety index. Hopkinton, MA: Liberty Mutual Research Institute for Safety Manchikanti, L. (2000). Epidemiology of low back pain. Pain Physician, 3 (2), 167-92. Marras, W. S. (2000). Occupational low back disorder causation and control. Ergonomics, 43 (7), 880-902. Marras, W. S., Lavender, S. A., Leurgans, S. E., Rajulu, S. L., Allread, W. G., Fathallah, F. A., & Ferguson, S. A. (1993). The
role of dynamic three-dimensional trunk motion in occupationally-related low back disorders. the effects of workplace factors, trunk position, and trunk motion characteristics on risk of injury. Spine (Phila Pa 1976), 18 (5), 617-28. Merryweather, A. S., Loertscher, M. C., & Bloswick, D. S. (2009). A revised back compressive force estimation model for ergonomic evaluation of lifting tasks. Work, 34 (3), 263-72. Nachemson, A. (1960). Lumbar intradiscal pressure. experimental studies on post-mortem material. Acta Orthop Scand Suppl,
43, 1-104. National Institute for Occupational Safety and Health. (1981). Work practices guide for manual lifting (Tech. Rep.). Cincinnati, OH: National Institute for Occupational Safety (NIOSH). Rubin, D. I. (2007). Epidemiology and risk factors for spine pain. Neurol Clin, 25 (2), 353-71. Sesek, R., Gilkey, D., Drinkaus, P., Bloswick, D. S., & Herron, R. (2003). Evaluation and quantification of manual materials
handling risk factors. Int J Occup Saf Ergon, 9 (3), 271-87. Sonoda, T. (1962). Studies on the strength for compression, tension and torsion of the human vertebral column. Journal of Kyoto Prefectural Medical University, 71 (1), 659-702. Tang, R. (2013). Morphometric analysis of the human lower lumbar intervertebral discs and vertebral endplates: experimental
approach and regression models (Doctoral dissertation). Auburn University. Auburn, AL. Tang, R., Güngör, C., Sesek, R., Foreman, K., Gallagher, S., & Davis, G. (2014). Morphometry of the lower lumbar intervertebral discs and endplates—comparative analyses of new MRI data with previous findings. Manuscript in review, Eur Spine J, November 11, 2013 Tang, R., Güngör, C., Sesek, R., Gallagher, S., Davis, G. and Foreman, K. (2014). Development of regression models for estimating the geometry of lower lumbar intervertebral discs and endplates using MRI-derived dimensions. Manuscript in review, J Anat, December 6, 2013 Waters, T. R., Putz-Anderson, V., Garg, A., & Fine, L. J. (1993). Revised NIOSH equation for the design and evaluation of manual lifting tasks. Ergonomics, 36 (7), 749-76.
LISTED IN THE AHFE DIGITAL BOOKSTORE CATALOGUE
Explore the complete digital volume
Advances in Applied Digital Human Modeling
Read this individual research paper free through the original publisher, or explore the full digital proceedings book.
ISBN 978-1-4951-2094-7
Explore this ISBN in the AHFE Bookstore ↗Listed in the July 2026 bookstore catalogue; search by ISBN to confirm current availability · Digital book purchase optional