Amanda Stephens, Eve Mitsopoulos-Rubens, Nimmi Candappa (2021). A Simulator Evaluation of Driver Responses to Dynamic Warning Signs at Rural Intersections. In: Advances in Human Aspects of Transportation: Part I. AHFE Open Access, vol. 15. https://doi.org/10.54941/ahfe100628
Intersections pose a risk to drivers, as they are the point at which different directions of traffic converge. Indeed a large proportion of serious and fatal crashes on Australian road occur in these circumstances. While some intersections provide less opportunity for crashes than others, unsignalised T-intersections on rural roads have the combined danger of reliance upon appropriate gap-judgments of minor road drivers turning on to the major road and the regulated high-speeds of the major road drivers. The current study investigated a strategy to mitigate high-speed crashes on rural roads by reducing the speed of major road drivers on approach to an intersecting minor road. Using a fixed-based medium-fidelity driving simulator, drivers’ speeds on major roads with intersecting minor roads were compared across three different types of warning signs. These were, a standard static side-road warning sign and two dynamic, two-state warning signs that activated when vehicles were present on the minor road. A further aim was to compare whether a regulatory sign, which when activated, mandated a speed of 80km/h (reduced from 100km/h), or an advisory sign, recommending a speed of 80km/h when activated was the most effective in reducing speed. Results indicated that when compared to the standard warning sign, dynamic regulatory and advisory signs were effective in reducing speed. However, while drivers largely complied with the regulated speed decrease of the regulatory sign, selected speeds were reliably higher than recommended by the advisory sign.
Intersection safety is globally recognised as an important road safety concern, primarily because the risk of crashing is increased at points when two or more streams of traffic converge (Department of Infrastructure, Transport, Regional Development and Local Government, 2009). In Victoria, Australia, almost 50% of all serious crashes occur at intersections. Further, crash statistics suggest that, over the past decade, approximately100,000 drivers have been killed or seriously injured in intersection crashes in this region (see Corben, Candappa, van Nes, Logan & Pieris, 2010). On rural roads, intersections such as the unsignalised T-intersection, are particularly dangerous because high-speed major roads are intercepted by lower-speed minor roads. Almost half (42% in 2008) of all recorded fatal crashes on Australian roads occur on roads with a speed limit of, or above, 100km/h; Department of Human Aspects of Transportation I (2021) https://openaccess.cms-conferences.org/#/publications/book/978-1-4951-2097-8
Infrastructure, Transport, Regional Development and Local Government, 2013) and the severity of crashes at rural intersections is increased at these higher speeds.
A recognised source of crash-risk at unsignalised rural T-intersections is the ill-timed merging of minor road drivers in to the stream of traffic on the major road (Creaser, Rakauskas, Ward, Laberge & Donath, 2007). Inappropriate gap selection (Alexander et al., 2006), major road sight restrictions (Weidemann, Kwon, Lund & Boder, 2011) and / or failure to comply with the posted stop sign (Pant, Park, Neti & Hossain, 1999; Preston & Storm, 2003) can lead to collisions with high-speed major road traffic. Successful strategies have been implemented to assist drivers with gap-acceptance judgments and improve overall intersection safety in this regard. For example, intersection decision support (IDS) systems have been found to assist minor road drivers when turning by providing real-time information about the traffic conditions on major roads (Laberge, Creaser, Rakaukas, Ward, 2006). Dynamic warning signs that either display detailed information about the size and safety of gaps in the current traffic stream, or advise about unsafe conditions also assist drivers in making appropriate turning manoeuvres (Creaser et al., 2007).
From a safe systems perspective, infrastructure that supports turning decisions of minor road drivers and also reduces the speed of major road drivers provides more comprehensive support at dangerous intersections. Drivers make safer gap-acceptance decisions leaving minor roads for major roads when the travel speed of major road traffic is reduced (Spek, Wieringa & Janssen, 2006; Yan, Radwan & Guo, 2007). Reductions in speed differentials between two vehicles also lower the probability of a crash (Aarts & Schagen, 2006). Thus, a reduction in the travel speed of drivers on the major road not only assists minor road drivers with potentially dangerous manoeuvres, but also allows greater stopping distance and reduces the severity of impact should a crash occur.
The aim of the current study was to examine a strategy for reducing drivers’ speed on major roads on a needs-only basis. That is, to warn drivers of the potential conflict of vehicles approaching on the minor roads, allowing major road drivers the time to reduce their speed. Reducing speed across specific sections of potential conflict rather than an overall reduction is preferable for a number of reasons. Primarily, traffic flow is not interrupted in circumstances where there is no potential for conflict and also, drivers may be more likely to comply with the reduced speed when it appears credible (e.g. Goldenbeld & van Schagen, 2007). Previous research in the USA has shown dynamic signs warning drivers of potential conflict are effective in promoting speed reductions across conflict points. In an observation study of driver behaviour at a major road/minor road rural cross-road intersection in Minnesota, drivers’ speeds on the major road were significantly decreased when an advanced warning LED sign flashed to indicate traffic on the cross-roads (Weidemann et al., 2011). Likewise, a field study in Virginia, found that dynamic signs warning major road drivers of traffic in the approaching cross-road, resulted in reductions of travel speed on approach to the intersection (Hanscom, 2001). Thus, a dynamic sign, alerting drivers to a potential conflict and appropriate speed reduction, is likely to encourage speed reductions in the vicinity of the minor road intercept.
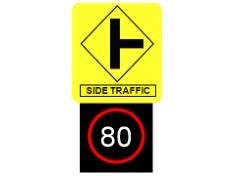
A further aim of the study was to evaluate the effectiveness of two different types of two-state (active vs inactive) dynamic warning signs (see Figure 1). Both are variants of road signs currently used on Victorian roads. The first sign is a regulatory sign, which, when in its active state, illuminates a variable speed limit of 80km/h. Due to its regulatory nature drivers are legally required to comply with the variable speed limit. The second sign is an advisory sign, which displays the words “SIDE TRAFFIC” when in its active state and advises a speed limit of 80km/h. It was anticipated that both signs would encourage major road drivers to reduce speed when traffic was approaching on the minor road.
Standard Sign (Left) Standard Sign (Right)
Advisory Speed Change (Left):
Advisory Speed Change (Left): Active
Inactive
Cars waiting at the side road intersection
No cars waiting at the side road intersection
Regulatory Speed Change (Right):
Regulatory Speed Change (Right):
Active
Inactive No cars waiting at the side road
Cars waiting at the side road intersection
intersection
Note: Inner half of red circle flashes
Figure 1: Example regulatory and advisory signs in their active and inactive states
METHOD
Participants Forty, fully licensed, drivers were recruited for the study, either from the Monash University Accident Research Centre (MUARC) participant database or via an advertisement in the Monash weekly online newsletter. Nine potential participants withdrew due to feeling unwell in the driving simulator and two further data sets were lost due to technical difficulties. The remaining 29 drivers (males = 21; 72%) provided complete data sets. Drivers had an average age of 36 (SD = 8.49) years, had been licensed for an average of 17 (SD = 9.30) years and spent approximately 11 (SD = 9.34) hours a week driving. Each participant received $30AUD for his or her contribution to the study.
Equipment Data were collected in the portable driving simulator located at MUARC, Melbourne, Australia. The medium fidelity simulator (ECA-FAROS EF-X) consists of a fixed based cab, automatic transmission and interactive driver controls (handbrake, gearbox, steering, pedals, speedometer). The simulated environment is displayed on five, 19- inch LCD screens, providing a 180 degree field of view for the driver. Stereophonic sound provides auditory feedback during the simulations (e.g. engine noise, brakes, indicator, passing traffic).
Simulator trials
Human Aspects of Transportation I (2021) https://openaccess.cms-conferences.org/#/publications/book/978-1-4951-2097-8
Participants completed five trials in the simulator, consisting of two familarisation trials, for which the data were not analysed, and three test trials. The test trials contained simulated rural environments, with 100km/h posted speed limits (unless otherwise specified), undivided roads and one lane in each direction. No other vehicles travelled in the driver’s direction. Each test trial consisted of seven intersection events, being: four unsignalised T-intersections, where the driver’s vehicle travels on the major road stem of the intersection and passes a minor road intersecting from either the right or left side, and three unsignalised T-intersections where the driver is on the minor of the T- intersection and has to turn into the major road (“side-road intersections”). Data for the latter type of event are not presented in this paper.
The four unsignalised T-intersections in each of the three trials represented one of twelve possible combinations of: type of warning sign (regulatory, advisory or standard), presence or absence of vehicles on the side-road and direction of side road (left or right). These were distributed pseudo-randomly across the three trials with each presented only once. For each side-road the warning sign was positioned 180 metres before the intersection. When vehicles were present on the side-roads the regulatory and advisory signs triggered to active state when the driver was 250 metres before the intersection. This allowed a maximum viewing distance of 70 metres, calculated to 2 seconds if the driver was complying with the posted speed limit of 100km/h. A further 100km/h speed sign was positioned 180 metres after each side-road.
For each simulator trial, drivers were instructed to drive as they would normally and in accordance with the road rules. The instruction to participants was to continue driving along the major road when encountering the side-road intersections.
Procedure
Participants underwent a single, one-and-a-half hour session in the MUARC simulator laboratory. Upon arrival, potential participants provided informed consent for the study, which had been previously ethically approved by the Monash University Human Research Ethics Committee. Participants completed a brief wellness checklist and provided information on driving history (years licensed, frequency of driving). They then drove two familiarisation trials in the driving simulator. The familiarisation trials used the same road environment as the experimental trials, to acquaint drivers with the simulator and the driving tasks. Participants were not exposed to the advisory and regulatory sign variants in the familiarisation trials. Next, participants completed a short training exercise to ensure basic comprehension of the standard, regulatory and advisory warning signs. Each sign was presented to the participant on a laminated card and shown in its activated and inactivated states, with an explanation that an activated sign indicates there are vehicles on the side road. Participants were not given any advice on how they should behave in response to the signs. In turn, participants drove the three test trials. These trials were presented consecutively and counter-balanced across participants. After driving all three trials, participants completed a post- drive questionnaire, and received payment.
Experimental Design A repeated measures 3x2x2 design was employed to examine the influence of warning sign type (regulatory, advisory or standard), presence of vehicles on intersecting minor side-roads (present or absent) and direction of the intersecting side-road (left or right) on drivers’ speed.
RESULTS
The dependant variable was average speed (km/h) on the major road. This was considered in two ways. First, the average absolute speeds of drivers at 20 metre intervals across a 500 metre sections of road (250 metres either side of the centre of the intersection were plotted. These descriptive data show how drivers’ speed profiles in response to the different signs. The average absolute speed in the immediate vicinity of the intersecting minor road (20 metres – i.e., 10 metres on either side of the centre of the intersection) was also examined and analysed using the 3-way ANOVA. This provides information of the speed with which drivers pass the potential conflict point of the intersection. In instances when sphericity assumptions were not met, Greenhouse-Geisser adjustments were made and the reported degrees of freedom were modified appropriately.
Driver Speed Profiles Drivers reduced their speeds for the regulatory and advisory signs when vehicles were present on the side-roads. Figures 2 to 5 show the average absolute speed of drivers on major roads when vehicles were present on the left side-road (Figure 2) and the right side-road (Figure 3) as well as when vehicles were not present (Figures 4 and 5). As can be seen in Figures 2 and 3, when vehicles were on the side-road, speed reductions were only evident when a regulatory or advisory sign was displayed and with the magnitude of the reduction differing according to the direction of the intersecting side road. On roads with left intersecting side-roads, speed profiles appeared similar for regulatory and advisory signs initially, however the reduction in speed was maintained longer for roads with regulatory warning signs. On roads where the side-road branched to the right, speed was reduced more for regulatory signs where, on average, drivers passed the side road with a speed close to the regulated 80 km/h. The speed reduction for the advisory sign was not as large, with drivers reducing to an average speed of approximately 90 km/h. On major roads with standard warning signs, no speed decreases were observed, regardless of whether there were vehicles on the side-roads or not. Likewise, drivers did not reduce their speeds on major roads displaying non-activated regulatory or advisory signs, indicting no vehicles on the approaching side-road.
Figure 2 Major road drivers’ average approach speed at T-intersections with left branching side-road (vehicles)
Figure 3 Major road drivers’ average approach speed at T-intersections with right branching side-road (vehicles) Human Aspects of Transportation I (2021) https://openaccess.cms-conferences.org/#/publications/book/978-1-4951-2097-8
Figure 4 Major road drivers’ average approach speed at T-intersections with left branching side-road (no vehicles)
Figure 5 Major road drivers’ average approach speed at T-intersections with right branching side-road (no vehicles) Average speeds across sign type, presence of vehcles and side-road direction for major roads
A 3x2x2 repeated measures ANOVA compared average speeds in the vicinity of the side-road across sign type (regulatory, advisory and standard), vehicles on the side-road (present, absent) and side-road direction (left, right). The type of warning sign, presence of vehicles and direction of the intersecting side-road significantly influenced drivers’ speeds. A significant main effect of type of warning sign was found (F (2,56) = 56.93, p < .001, η2
p = .67), as were interaction effects between type of warning sign and presence of vehicles (F (2,56) = 62.32, p < .001, η2 p = .69) and presence of vehicles and direction of side-road (F (1,28) = 6.20, p <.05, η2
Equations and mathematical formulas are available in the original paper PDF.
These two-way interactions were explained by a reliable three-way interaction (F (2,56) = 4.45, p < .05, η2
p = .14). Simple main effects analysis of the three-way interaction showed that speeds were reliably higher when passing right side-roads, compared to the left side-roads, but only for advisory signs when vehicles were present (F (1,28) = 5.30, p < .05, η2 p = .17; see Table 1). No other simple effects reached significance.
Table 1 Table of means for average (SD in brackets) speed (in km/h) for each of the three warning signs Regulatory Advisory Standard Vehicles Left 81.06 (4.61) 85.20 (9.07) 102.47 (5.93)
Right 83.02 (5.99) 90.00 (9.60) 99.96 (8.93) No Vehicles Left 102.13 (6.93) 101.29 (9.40) 103.62 (5.49) Right 102.51 (4.81) 99.55 (8.98) 102.44 (5.12)
As the main interest of the research was the effectiveness of different signs on speed when vehicles were in the side- road, separate two-way ANOVAs (sign type x vehicle presence) were conducted for the left and right side-roads. Reliable two-way interactions were found for both ANOVAs (see Table 2). Simple main effects analyses showed largely the same findings for left and right side-roads. As was to be expected, drivers had slower speeds on roads that displayed regulatory or advisory signs when vehicles were on the side-road than when there were no vehicles on the side road. Speed did not differ according to whether there was traffic on the side roads or not, when a standard warning sign was on the major road.
Table 2: Results of two-way ANOVA (sign type x presence of vehicles) for left and right side-roads Effect Fleft Fright Main effect: sign type (1.53,43.77) = 53.41, p < .001, η2
Table available in the original PDF paper.
Interaction: sign x presence of vehicles
Simple effect: Regulatory sign effect for presence of vehicles
Simple effect: Advisory sign effect for presence of vehicles
ns ns
Simple effect: Standard sign effect for presence of vehicles
One sample t-tests on average speeds on T-intersections after the regulatory and advisory warning signs, showed that the speeds with which drivers passed the minor road were significantly higher than the posted limit of 80km/h for all but the left branching T-intersection with vehicles present.
DISCUSSION
This study aimed to evaluate the effectiveness of dynamic two-state warning signs in reducing drivers’ speeds when approaching a side-road with vehicles present. Average speeds of major road drivers were compared after encountering warning signs that either regulated or advised a decrease in speed when vehicles were approaching on a side-road. The effects of both signs were compared with a standard static sign advising of a side-road ahead. It was anticipated that the activated dynamic signs alerting major road drivers to potential conflict would encourage drivers Human Aspects of Transportation I (2021) https://openaccess.cms-conferences.org/#/publications/book/978-1-4951-2097-8 to reduce their speed. The hypothesis was confirmed with results showing reliable speed decreases on major roads that displayed activated regulatory or advisory signs.
A further aim of the study was to evaluate whether regulatory or advisory signs were more effective in reducing speed. The speed profiles and mean speeds of drivers in the vicinity of the side road showed that drivers largely complied with the regulatory sign, with mean speeds approaching the side roads being statistically similar to 80km/h or only slightly higher. However, when an advisory sign was displayed, drivers did not reduce their speeds as much, approaching the intersecting side roads with speeds between 85km/h and 90km/h. Thus, when vehicles were present on the side-roads, drivers complied with enforced speed reductions, but selected to drive faster than the recommended speed.
The selected speeds of drivers in the current study align with previous research. For example, Goldenbeld and van Schagen, (2007) had Dutch drivers rate their preferred speed and perceived safe speed for pictures of rural roads, differing in complexity, and with a posted speed limit of 80km/h. In similar environmental conditions to what was simulated in the current study, drivers perceived a safe speed to be 83km/h, but reported preferences for average speeds of 88km/h. In a survey of drivers in Australia, preferred speeds on rural roads, in this instance 100km/h, were also approximately 10% higher than the posted speed limit (Fleiter & Watson, 2005). The current results, in combination with previous research, suggest that to achieve safe speeds of 80km/h, dynamic signs need to enforce, not recommend speed.
An unanticipated, but still interesting result, is the difference in speed behaviours observed between left and right side-roads. A three-way interaction showed that the advisory sign was less effective in reducing drivers speed when there were vehicles on right branching side-roads compared to left branching side-roads. Overall, data displayed in the speed profiles (Figures 2 and 3) suggest a trend toward faster speeds when approaching right side roads than left. It appears that the regulatory sign is sufficient in regulating speed across both left and right side streets, whilst preferred speeds (as reflected in participants’ speed response to the advisory sign) differed between the two directions of side road. A possible explanation for the differences in approach speeds may be in the positioning of the stationary vehicles. The stationary vehicle on the left is in closer line of sight for the major road driver and as such drivers may prefer slower speeds when approaching. The line of sight to the right stationary vehicle is farther, possibly leading drivers to assume longer times to react should the vehicle move, resulting in faster speeds on the major road. Given the major road drivers have right of way, drivers would be unlikely to expect the stationary vehicle to enter the major road in front of them and therefore, when allowed to, they select faster speeds than recommended.
The scope of the study was limited in that it only considered relatively uncomplicated rural environments. All T- intersections were approached from a straight road, and there was good line of sight to vehicles on the right and left side roads. It may be that the noted differences between recommended speeds and preferred speeds of drivers would be reduced in more complicated road environments. For example, where minor road traffic is obscured. Further research could incorporate different complexities of rural environment as well as evaluating the effectiveness of dynamic warning signs for other intersections, i.e. rural cross intersections.
Results support the notion that dynamic warning signs alerting major road drivers to traffic approaching from minor roads promote speed reduction. Further, when alerted to a potential conflict, driver’s selected speeds are reliably higher than the recommended speed.
CONCLUSIONS
High speeds on rural roads are associated with more severe crashes, particularly at unsignalised T-intersections where slower speed minor road drivers converge with high-speed major road drivers. One method of improving the safety at these intersections is to reduce the major road drivers’ speeds at potential points of conflict. Dynamic two- state warning signs were effective in reducing speed when vehicles were present on side roads, with speed reductions being more consistent when regulated, compared to recommended. Efforts to reduce speeds to 80km/h at conflict points on rural roads will be more likely to be met if the limit is enforced, not simply advised.
ACKNOWLEDGEMENT
This research was part of broader research program into intersection design and safety funded by VicRoads, Australia. The authors would like to acknowledge Nebojsa Tomasevic, Christian Anchora, Amy Allen, Casey Mackay. Their contributions to the research and support are gratefully acknowledged. We particularly acknowledge the work of our colleague Bruce Corben in establishing this significant intersection safety program. The views expressed in this article are those of the authors and not necessarily the views of VicRoads or Monash University.
REFERENCES
Aarts, L., & van Schagen, I. (2006). Driving speed and the risk of road crashes: A review. Accident Analysis and Prevention, 38, 215-224. Alexander, L., Cheng, P. Donath, M., Gorjestani, A., Menon, A., Newstrom, B., Shankwitz, C., Ward, N. & Starr, R.
(2006). Rural expressway intersection surveillance for intersection decision support system. Transportation Research Record: Journal of the Transportation Research Board, 1944, 26-34. Creaser, J.I., Rakauskas, M.E., Ward, N.J., Laberge, J.C., & Donath, M. (2007). Concept evaluation of intersection decision support (IDS) system interfaces to support drivers’ gap acceptance decision at rural stop- controlled intersections. Transportation Research Part F, 10, 208-228. Corben, B., Candappa, N., van Nes, N., Logan, D., & Pieris, S. (2010). Intersection safety study: meeting Victoria’s
intersection challenge: task 5: generation of intersection designs within the safe systems context. Department of Infrastructure, Transport, Regional Development and Local Government (2009). Road deaths Australia 2008 statistical summary. Road safety report no. 4. Canberra, Australia: Australian Government. Department of Infrastructure, Transport, Regional Development and Local Government (2013). Road deaths
Australia December 2013 statistical summary. http://www.bitre.gov.au/publications/ongoing/rda/files/RDA_Dec13.pdf (last accessed 27th February 2014). Fleiter, J., & Watson, B. (2005). The speed paradox: the misalignment between driver attitudes and speeding behaviour. Proceedings of the Australiasian Road Saftey Research, Policing and Education Conference, Wellington, New Zealand. Goldenbeld, C., & van Schagen, I. (2007). The credibility of speed limits on 80km/h rural roads: The effects of road
and person(ality) characteristics. Accident Analysis and Prevention, 39, 1121-1130. Hanscom, F. (2001). Evaluation of the Prince William County Collision Countermeasure system. Virginia Transportation Research Council. VDOT, FHWA. Laberge, J.C., Creaser, J.I., Rakauskas, M.E., & Ward, N. (2006). Design of an intersection decision support system
(IDS) interface to reduce crashes at rural stop-controlled intersections. Transportation Research, Part C, 14, 39-56. Pant, P.D., Park, Y., Neti, S., & Hossain, A.B. (1999). Comparative study of rural stop-controlled and beaconcontrolled intersections. Transportation Research Record: Journal of the Transportation Research Board, 1692, 164-172. Preston, H., & Storm, R. (2003). Review of Minnesota’s rural crash data. Eagan, MN: CH2M HILL. Spek, A.C.E., Wieringa, P.A., & Janssen, W.H. (2006). Intersection approach speed and accident probability.
Transportation Research Part F, 9, 155-171. Weidemann, R., Kwon, T.M., Lund, V. & Boder, B. (2011). Determining the effectiveness of an advance LED warning system for rural intersections. Transportation Research Record: Journal of the Transportation Research Board, 2250, 25-31. Yan, X., Radwan,E., and Guo, D. (2007). Effects of major-roach vehicle speed and driver age and gender on left-
turn gap acceptance. Accident Analysis and Prevention, 39, 843-852.
Human Aspects of Transportation I (2021) https://openaccess.cms-conferences.org/#/publications/book/978-1-4951-2097-8
LISTED IN THE AHFE DIGITAL BOOKSTORE CATALOGUE
Explore the complete digital volume
Advances in Human Aspects of Transportation: Part I
Read this individual research paper free through the original publisher, or explore the full digital proceedings book.
ISBN 978-1-4951-2097-8
Explore this ISBN in the AHFE Bookstore ↗Listed in the July 2026 bookstore catalogue; search by ISBN to confirm current availability · Digital book purchase optional