Christian Denker, Florian Fortmann, Marie Christin Ostendorp, Axel Hahn (2021). Assessing the Fitness of Information Supply and Demand during User Interface Design. In: Advances in Human Aspects of Transportation: Part I. AHFE Open Access, vol. 15. https://doi.org/10.54941/ahfe100616
User interface design of nowadays safety-critical human-machine systems has a significant impact on human operator situation awareness (SA). SA is composed of three levels including the perception (level 1), comprehension (level 2) and projection (level 3) of information. A significant part of accidents can be attributed to level 1 error. This means that human operators have problems to satisfy their information demand with supplied information during task performance. While thoroughly checking user interface designs for information gaps is a standard in professional system design it is a time consuming and error prone process. In this paper we introduce an information gap model, which allows investigation of inconsistencies between information supply and demand. We present a method to detect information gaps and assess the fitness between information supply and demand. The method can be executed semi-automatically. We show the method’s implementation into an integrated system modelling environment and demonstrate the application with an autopilot component in a course change task on a ship bridge. We performed an expert evaluation with maritime system engineers and a human factors ergonomist to estimate the applicability, benefits and shortcomings of the method. Overall, the evaluation results are promising and warrant further research of the method.
Accident reports reveal that human error is the number one cause of accidents in transportation. For example, a review of accidents in the aeronautical domain states that 71% of the flight accidents investigated by the U.S. National Transportation Safety Board (NTSB) between 1989 and 1992 were caused by human error (Jones and Endsley, 1996). Further, a review of accidents in the maritime domain, which was performed on the basis of data from the U.K. Marine Accident Investigation Branch (MAIB), the Transportation Safety Board of Canada (TSBC) and the Australian Transport Safety Bureau (ATSB), states that more than 82% of accidents in shipping are associated with human error, and in 46% human error was even the main cause (Baker and McCafferty, 2005). Thereof 71% are caused by degraded situation awareness (Hetherington, Flin, and Mearns, 2006).
Situation awareness (SA) can be seen as a state in the human decision-making process. It is built of the status of the elements in the environment and is the basis for making decisions. SA is composed of three levels including the perception (level 1), comprehension (level 2) and projection (level 3) of information (M. R. Endsley, 1995).
According to literature most accidents can be attributed to level 1: reports from human factors research show that 60 - 77% of SA induced errors were errors on level 1, besides 20 - 30% on level 2, and 3 - 9% on level 3 (Grech, Horberry, and Smith, 2002; Jones and Endsley, 1996). Furthermore, errors on level 1 can cascade to errors on level 2 and level 3 (M. R. Endsley, 1995). This implies that the elimination of level 1 error could lead to a significant reduction of accidents.
Level 1 error can have various causes, which cannot be strictly attributed to humans. This can also be reasoned from the SA error taxonomy which states five causes for level 1 error (Jones and Endsley, 1996): ‘data is not available’, ‘data is hard to discriminate or detect’, ‘monitoring or observation of data failed’, ‘misperception of data occurred’ and ‘memory loss’. By analyzing these causes it is obvious that level 1 errors can be attributed to the human, machine or their organization. The hypothesis underlying this work is that the synergies of human, machine and their organization have to be considered as a whole to encompass level 1 errors.
In this paper, we present a formal method for the assessment of the fitness between supply and demand of information provided on a user interface. We implemented the method in an integrated systems modelling environment. We demonstrate the method with a course change task on a ship bridge. We performed an interview with system engineers from the maritime domain and a human factors ergonomist as an initial evaluation. Overall, the feedback was very positive and warrants further investigation of the method.
RELATED WORK
In computer science formal verification methods from mathematics are used to proof the correctness of an algorithm in accordance to a defined system specification or property description. A common method is model checking. Model checking allows to verify whether a given system model fulfills a specification. “The method requires that a system is given with a graph, which describes the system behaviour in terms of states and actions” (Meolic, Kapus, and Brezocnik, 2000). The specification is expressed as logical propositions. The verification is done by checking the system models compliance to the propositions. (Clarke, Grumberg, and Peled, 1999; Meolic et al., 2000) In terms of model checking, human and machine could be defined as individual system models. In our approach the human’s demand for information can be defined as the required specification. The information demand specification is used to verify the existence of the machines information supply. Therefore the states of the machines model contain supplied information as properties.
To establish SA and incorporate new information humans search for required information in their environment. They interact with machines and other humans to exchange information during task execution. Koreimann defined three types of information exchange between human and machine in information systems: dialog, report and information retrieval (Koreimann, 2000). A dialog describes a bidirectional information exchange, e.g. in a request and response pattern. The report is a unidirectional flow where information is transferred from a computer to the user or from the user to the computer (e.g. displaying information about the system status). An information retrieval is also a unidirectional flow, but it differs in the direction of the information flow, since information is taken from one of the information system’s parts (e.g. looking for information on computer’s display). The concepts of dialog, report and information retrieval are abstractly used in our model to describe the direction of an information flow and set the initiator of an information exchange.
Besides the concrete interaction, a human has to set herself/himself into a position in which it is possible to take part in the information exchange. Here, the spatial distribution of information supply is important; because it influences the time it takes to build up SA. In the domain of human factors there exist a variety of methods considering the spatial distribution of information. One example is a method called link analysis (Chapanis, 1965; Wilson and Corlett, 2010). Link analysis allows identifying “links” between interface components (or functions) and human operators. The “links” are constructed out of human’s gaze movements between the components or a sequence of use of components or functions (Stanton and Young, 1999). For instance, the sequence of pressing button A and afterwards pressing button B would construct a link between button A and B. The analyst records the frequency and execution times of the links during a task under investigation. Based on the records the links are drawn onto a schematic representation of the interface to construct the so-called link diagram and a link table is created, which Human Aspects of Transportation I (2021) contains the same information in tabular form. The results of a link analysis are used to optimize the interface by reducing the spatial distance between linked components (Stanton and Young, 1999).
INFORMATION GAP MODEL A concept which encompasses our view on level 1 errors is the so-called information gap introduced by Endsley and Jones (M. R. Endsley and Jones, 2003; M. Endsley, 2000). Their concept describes the information gap as an inconsistency between data produced and information needed. There are various definitions and meanings on what data and what information are and how they differ. The data-information-knowledge-wisdom discussion gives an insight into that field (Fricke, 2008; Rowley, 2007). Since we follow a human’s task-oriented perspective we solely focus on information. The reason is that data “has no meaning or value because it is without context and interpretation” (Rowley, 2007). In contrast, information has a format, is structured and organized, has a meaning and a value feature (Rowley, 2007). Since information has a meaning and value feature, we will use the term “supplied information” instead of “produced data” in the remainder of this paper. Furthermore we use the term “information demand” instead of information need.
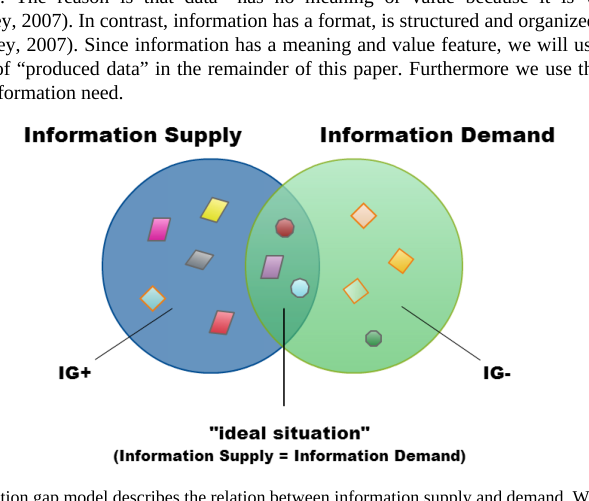
Figure 1: The information gap model describes the relation between information supply and demand. We model information supply and demand as two sets of atomic information elements. IG+ represents the sub-set of oversupply and IG- the sub-set of undersupply of information elements. In the ideal situation information supply and demand are well-balanced.
During task execution in transportation systems humans and machines are demanding and supplying information. This basic concept of supply and demand facilitated in our approach is taken from business studies. In business studies’ controlling for instance a set theoretical concept of information supply, demand and requirements exists (Weber and Schäffer, 2006). Within that concept information requirements describe all information which are necessary to the management e.g. for making a decision. An information demand is issued to fulfill the management’s information requirements. The information demand describes information which is requested from the information supply. In the “ideal situation” the sets of required information, demanded information and supplied information overlap. (Weber and Schäffer, 2006) We used the basics of this concept and transferred it to investigate gaps between information supply and demand between humans and machines. The result is the information gap model depicted in Figure 1. In the model an information gap is defined by the two complements of the intersection of information supply and demand. This means that an information gap can have two characteristics: (1) supplied information is not demanded or (2) demanded information is not supplied. The former is also part of the previously stated definition of the information gap by Endsley. We call this part information gap+ (IG+), since there is more information available then demanded. The second part is called information gap– (IG–), because there are less information available then demanded. This information gap definition is the baseline of our concept. In the ideal case, information supply and demand are well-balanced.
METHOD
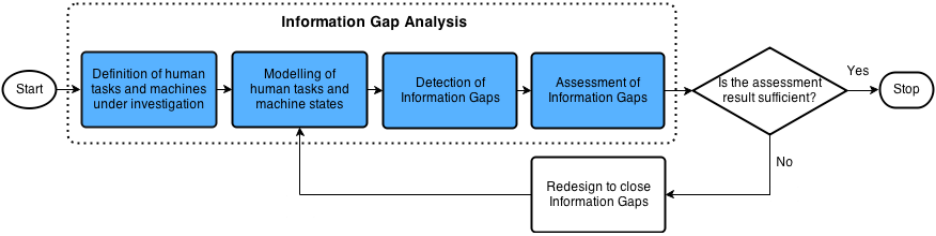
In this section we present our method to detect information gaps and assess the fitness of information supply and demand during the UI design phase. The method consists of the four steps definition, modelling, detection and assessment of information gaps and can be integrated into system design processes (see Figure 2), such as the human-centered design process (ISO9241-210, 2009). In the following, we describe each step of the method in detail.
Figure 2: Integration of our method for information gap detection and assessment into the system design process Step 1: Definition of human tasks and machines under investigation
In the first step of the method the scope of the system investigation is defined. This means, that the human tasks and the UI to consider are specified in detail. Therefore, hierarchical task analyses (HTA) of the humans’ tasks can be conducted. An HTA typically results in a hierarchical tree-structure, where the task is decomposed into multiple sub-tasks (Hollnagel, 2003). Based on the HTA atomic information elements (IE) are extracted. IEs represent the smallest unit of information within a task which provides a meaning to the human. A digital speedometer for instance typically contains an IE that can be called “current_speed”. In this approach the sufficient grade of detail is reached, when all IEs, which are necessary to complete the task at hand, are identified.
Separated from conducting the HTA, the UI is analyzed to gather the contained IEs. Contained IEs are in this case only relating to information which is shown to the users in one modus of the UI. In some cases the UI’s size may exhaust the effort for gathering all IEs. Then, depending on the tasks under investigation, the grade of effort can be scaled by neglecting parts of the UI in the analysis, which would not influence the perception and SA of the humans.
During human task and machine modus definition the analyst has to mind safety aspects. Missing or disregarding safety-relevant tasks and corresponding IEs can have a huge impact on system safety. During task definition questions like “what can go wrong?” and “which evasive tasks need to be executed?” must be considered to derive safety relevant IEs. Another point referring to IEs is that they may be integrated with other IEs so that a new IE is derived. IEs extracted from HTAs may be integrated. By using integrated IE during modelling also parts of level 2 or level 3 SA will become subject of the assessment’s result. For instance the speedometer could be used in two different tasks to demand both the IE “current_speed” and also the IE “target_speed_deviation” as integration of e.g. “target_speed” and “current_speed”. In such a case the analyst can determine whether his machine shall support other SA level. The integration of IEs can be considered in modelling and in the detection and assessment of information gap. In the remainder of the concept description level 1 SA is considered.
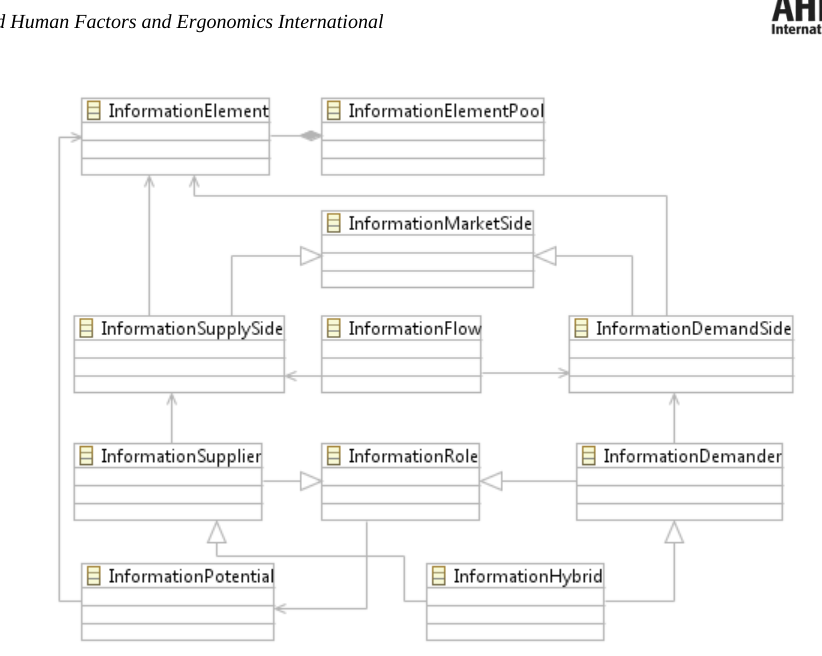
Step 2: Modelling of human tasks and machine states In the second step, the information is gathered and an information supply and demand model (ISDM) is instantiated. The ISDM allows detecting information gaps both in a static comparison of IE sets and in a dynamic simulation of task execution. A UML class diagram of the ISDM is shown in Figure 3.
Figure 3: The information supply and demand model (ISDM) as UML class diagram The class InformationElement represents an IE and is the smallest and atomic entity of the ISDM. Every IE is unique and distinct from other IEs. An InformationElementPool (IEP) is a global container for all unique IEs, which holds both the human tasks’ and the machines’ IEs. There further exist three roles (InformationRole) called InformationSupplier, InformationDemander and InformationHybrid. An InformationSupplier is a role, which is capable of emitting/supplying IEs via a so-called InformationSupplySide. For example the whole machine under investigation can have the role of an InformationSupplier. The InformationSupplySide would then be e.g. a console or display. InformationDemander is a role which is capable of receiving/demanding IEs from InformationSupplier’s InformationSupplySides. The source of an information demand is an InformationDemandSide, which is part of the InformationDemander. To enable for dynamic analysis the InformationDemanders’ InformationDemandSides and InformationSuppliers’ InformationSupplySides are ordered according to their temporal execution of demand and supply. Referenced IEs of both InformationMarketSides can be ordered in the same manner, to reflect e.g. detailed sequences of eye movements (saccades). The InformationHybrid is a combination of both InformationSupplier and InformationDemander and can thus contain InformationSupplySides and InformationDemandSides. Both the InformationDemandSide and the InformationSupplySide have a location in the system under analysis. Furthermore, the InformationMarketSides can be enriched with properties corresponding to their contained IEs. For example a value of importance or a value representing the saliency of IEs could be defined for each IE. This enables not only for spatial analysis of the human-machine interaction, but also allows considering further human or machine factors in the later analysis. The InformationFlow is used to connect the InformationDemandSides with InformationSupplySides. This concept allows modelling the fulfillment of information demand via distributed InformationSupplySides. The InformationFlow class can be used to model dialogs, reports and information retrievals. With the model it is also possible to express information which are not perceivable on the UI, but existing in the internal model of the human or machine. The class representing this is called InformationPotential. In case of a machine this class can contain e.g. information produced by sensors, which are currently not show on the display. For humans the InformationPotential can contain all IE which were already perceived during a task’s execution. The construct can also be used to model cognitive limitations, e.g. to set a max amount of information in humans memory. The InformationPotential can increase or decrease in the amount of contained IEs during task execution.
Step 3: Detection of information gaps In the third step information gaps are detected by analyzing the ISDM. Therefore, information supply and demand is compared to check for existence of IG+ and IG- in the system under investigation. The comparison of the properties of the InformationMarketSides is also a part of the detection. As preparation to the detection and assessment the InformationDemanders’ InformationDemandSides are inspected. For each InformationDemandSide connected InformationSupplySides are resolved, which are connected via InformationFlows. The InformationSupplySides’ IEs are then aggregated to form a joint set of supplied IEs. IEs of the focused InformationDemandSide are considered as a set of IEs as well. Of course properties of the InformationDemandSide and InformationSupplySide, which have been previously annotated, need to be referenced to their corresponding IEs, if they have to be considered in the analysis as well. A possibility for annotating the sets is to construct tuples, which consist of the IE and its properties.
Having the two sets of information supply and information demand set up, the detection of the information gap may begin. Let A be the information supply set and B be the information demand set, then f ( A−B) results in IG+ and f (B−A ) results in IG-. The function f is called the matching function. It maps the referenced IEs of set A and B to each other. The function allows scoring differences in properties of IEs between both demand and supply side. The results of the detection step are the sets of IG+ and IG- including properties’ scores.
Step 4: Assessment of information gaps In the fourth step the information gaps are assessed. The assessment is based on the two sets A and B and their properties which were created in the third step. The assessment is done by application of Tversky’s ratio model similarity which is depicted in Figure 4 (Tversky, 1977). It is a mathematical model which allows comparing two sets and results in a ratio. The ratio indicates the similarity of the given sets A and B and expresses it as normalized real number between zero and one. Here again, the complements of the intersection of A and B represent the information gap consisting of IG+ and IG-. α and β are weightings to the complements and hence allow for changes of the influences of IG+ and IG- to the metric’s result. When α = β = 1 the model reduces tof ( A∩B)/ f (A∪B ) (Gregson, 1975). The function f is called the matching function. The matching function allows to integrate further mapping functions between both InformationDemandSide’s and InformationSupplySides’ IE-referencing properties. The implementation of the matching function depends on the particular property and it’s metric. A simple example is the mapping of an IE’s value of importance for the InformationDemandSide.
Equation reproduced from the original PDF.Figure 4: Tversky's ratio model similarity (Tversky, 1977)
Figure available in the original PDF paper.
When calculations for each InformationDemandSide were carried out, the arithmetic mean is used to rate the entire tasks in relation to the machines. When the metric result equals one, no information gap exists. A result of zero would indicate that there exists no information exchange. Instead of the arithmetic mean, it’s of course also possible to apply other, even more complex functions, which weight in a more meaningful manner, e.g. in accordance to task priority.
IMPLEMENTATION IN A MODELING ENVIRONMENT In this section the implementation of the concept is described. The aim of the implementation is to show how the concept can be integrated into existing integrated modeling environments to automate the static detection and assessment method. We chose to implement the concept as plugin to MagicDraw. The UML-tool supports business process, architecture, software and system modelling (NoMagic, 2014). The main advantage is its extensibility via the provided OpenAPI. The OpenAPI allows access to various internal modelling constructs and enables to extend MagicDraw with custom plugins. The internal models are mapped to the ISDM and a plugin is developed which enables to detect and assess information gaps. The static analysis disregards spatiotemporal aspects of the information gap. An IE property which states the priority within a task under investigation is integrated into the assessment.
Mapping the information supply and demand model The ISDM is mapped to existing constructs of MagicDraw. These constructs are SysML requirement diagrams, UI models and traceability links. In systems engineering SysML requirement diagrams are used to define requirements to a system and requirements’ relations (Weilkiens, 2011). Here, the SysML requirement diagram is used to express the InformationDemander with one InformationDemandSide of the ISDM. The diagram’s parts called ‘information requirements’ represent IEs. The priority of an IE is settable via the information requirement’s property attribute. UI models, which can be created with MagicDraw’s UI Modeler, are used to constitute the InformationSupplier including one InformationSupplySide. Traceability links enable to connect SysML requirement diagram’s information requirements with the UI model’s elements and therefore surrogate the InformationFlow. InformationElementPool, InformationPotential and InformationHybrid are not considered in this implementation.
Plugin implementation The requirement diagram, UI model and traceability links are facilitated by the developed plugin extension. The plugin is implemented in Java and consists of the two classes IGMetricPlugin and IGMetric. These extend the abstract classes Plugin and Metric of the MagicDraw OpenAPI as depicted in Figure 5. The IGMetricPlugin instantiates IGMetric in its init-method and adds it to the MetricsManager of MagicDraw. This makes the metric available in MagicDraw. The IGMetric contains the logic for the automated detection and assessment. In its calculateLocalMetricValue-method the ratio model similarity is calculated. During calculation IEs of the information requirements diagram are mapped to the priority. The result of the calculation is shown as a report in MagicDraw. The report states IG+, IG-, IEs of the “ideal situation” and the result of the ratio model similarity calculation. The method acceptModelElement is used to specify permitted input elements to the metric. Here all required diagram elements are permitted. An example of the results is presented within the use case in the next section. As completion of the implementation the plugin was added to MagicDraw.
Figure 5: Class diagram of the IGA plugin for MagicDraw
Figure available in the original PDF paper.
USE CASE We applied our method to assess the fitness between an autopilot UI (defines the information supply) and a course change task on a ship (defines the information demand). The course change task under investigation is artificial, since it only focuses on operational changes to keep the ship on its track and is not capable for extraction of all required information. For instance, in such a task a target course is identified through other nautical means, which are not considered in this use case.
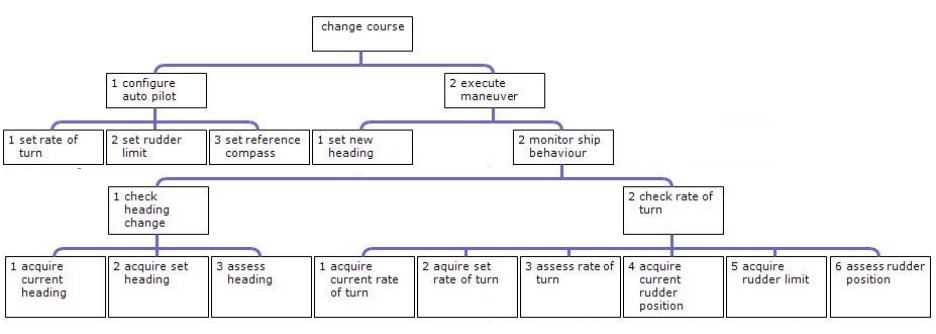
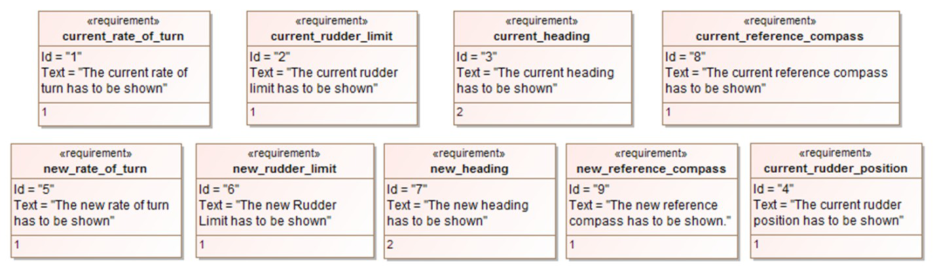
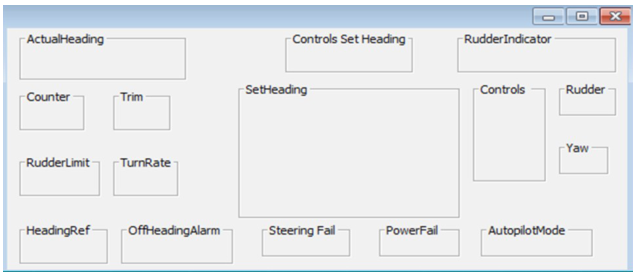
The course change task was examined in a HTA which was conducted and evaluated in an expert interview with a master-licensed seafarer. The resulting HTA is shown in Figure 6 and was used to identify the IEs demanded during the task. To change the course, the autopilot needs to be configured, before maneuver execution is possible. A maneuver is executed by setting a new heading to the autopilot and monitoring the ship’s corresponding behaviour. The identified IEs were added to a requirement diagram in MagicDraw (see Figure 7). The diagram contains nine IEs called current_rate_of_turn, new_rate_of_turn, current_rudder_limit, new_rudder_limit, current_heading, new_heading, current_reference_compass, new_reference_compass and current_rudder_position. Every IE got a priority of 1 assigned. Exceptions to this are the IEs current_heading and new_heading, which got a priority of 2 assigned, only for demonstrative purposes. Next, a commercial autopilot’s UI was recreated in an abstract manner with MagicDraw’s UI modeler. The abstract UI model of the autopilot is shown in Figure 8. Elements of the UI model are represented as GroupBoxes and a variety of control buttons were aggregated to GroupBoxes called “Controls”, to minimize the textual output of the plugin. This of course influences the metric’s result. The GroupBoxes were then linked to the information requirements with MagicDraw’s traceability functionality. Finally the IGMetric was executed to calculate the ratio model similarity between the information supply and the information demand. The textual output containing IG+, IG- and the ratio model similarity’s result is shown in table 1. One information requirement, or IE respectively, was not implemented in the UI model (IG -) and seven supplied IEs were not demanded within the task (IG+). The ratio model similarity results in 0.578947. This results from the mapping function to the information requirements’ priority property. In fractional notation the result equals 11 11+7+1.
Figure 6: HTA of the course change taskFigure 7: Information demand modelled with a MagicDraw SysML requirement diagramFigure 8: Screenshot of the abstract UI model of a commercial maritime autopilotTable 1: Calculation results of the information gap metric plugin WARNING (IG-): Requirement current_rate_of_turn is disregarded in GUI!
Table available in the original PDF paper.
WARNING (IG+): GroupBox AutopilotMode is not derived from information requirement.
WARNING (IG+): GroupBox Yaw is not derived from information requirement.
WARNING (IG+): GroupBox PowerFail is not derived from information requirement.
WARNING (IG+): GroupBox Steering Fail is not derived from information requirement.
WARNING (IG+): GroupBox Controls is not derived from information requirement.
WARNING (IG+): GroupBox Counter is not derived from information requirement.
WARNING (IG+): GroupBox Trim is not derived from information requirement.
Ratio model similarity: 0.578947
EVALUATION We evaluated our approach in collaboration with system engineers from the maritime domain and with a human factors ergonomist. Therefore we presented the concept of the method to them and demonstrated its application. Then we asked the experts to estimate applicability, benefits and shortcomings of the method. Overall, the feedback was positive. The experts found that the method is a good complement for system design processes. Especially the seamless integration into an existing systems engineering tool was stated as beneficial. The experts agreed that the spatiotemporal resolution of the information gap needs to be addressed in future work. Furthermore, the ratio model similarity metric delivering a normalized estimation of the severity of information gaps was considered as helpful. They estimated the metric would have its strength in the assessment for comparison of various UIs and different UI modes during design time. An engineer mentioned that the approach requires a huge initial modeling effort and that detailed task analyses may consume much time. During development this can have a negative bias for the time to market. However, another expert with background in task analysis reasoned that gathering IEs would cause little additional effort to a typical task analysis. In the end a comparison of cost and benefits will drive the decision on whether to invest in additional modelling effort. The discussion with the experts expressed the need for further studies, which examine the costs and benefits. Another point in the discussion concerned the way in which IEs are supplied. For instance information presentation capabilities were not regarded in our use case, but have an impact on how information is demanded. The experts claimed that the integration of a rating for information presentation capabilities would be of interest as an extension to the presented approach. Such a rating could be integrated into the InformationMarketSides and the mapping function of the ratio model similarity calculation.
CONCLUSION AND OUTLOOK In this paper, we have demonstrated a method to assess the fitness of information supply and demand on the UI during the design phase. As basis of our method, we derived the information gap model comprising information supply and information demand. Our method consists of the four steps (1) definition of human tasks and machines under investigation, (2) modelling of human tasks and machine states, (3) detection of information gaps and (4) assessment of information gaps. We applied the method to assess the fitness of information supply and demand of an autopilot component in a course change task on a ship bridge. We presented our method and its application to system engineers and a human factors ergonomist. Then, we interviewed them to get an initial evaluation. In the interview we asked the experts to estimate the applicability, benefits and costs of the method.
The overall result is positive and warrants further research. A study which investigates the applicability of the method with respect to benefits and costs would be of interest for industrial stakeholders. Other research demand concerns the extension of our method by including further properties and the investigation of distributed information supply and demand. In our implementation we considered an IE’s priority out of the demand side’s perspective. As extension to this work, further properties of IEs which influence the information flow between information supply and information demand side could be considered. For instance an integration of the properties of Wickens’ SEEV- Model (salience, effort, expectancy and value) from applied attention theory may be considered (Wickens and McCarley, 2008). In future work, the effort property of this framework can be used to compensate for the spatiotemporal aspects which are not considered within our implementation. Furthermore, we conclude that analysts have to consider IG+ and IG- during assessment with the presented implementation, since the arithmetic mean of multiple ratio model similarity metrics may mask important information gaps. However, our method enables to integrate more powerful aggregation functions, which may compensate that shortcoming. We further identified that the presentation of assessments’ results could be improved. Analysts applying our implementation to optimize complex systems consisting of multiple humans and machines might struggle in finding major system problems in overloading textual results. The results could be improved through visualization, e.g. as a graph visualization (Herman, 2000).
ACKNOWLEDGEMENT
This research has been performed with support from the EU FP7 project CASCADe, GA No.: 314352. Any contents herein are from the authors and do not necessarily reflect the views of the European Commission. The authors would like to thank our partners in CASCADe and the participating domain experts who supported this work.
REFERENCES
Baker, C. C., & McCafferty, D. B. (2005). Accident database review of human element concerns: What do the results mean for classification? Human Factors in Ship Design, Safety and Operation, February 23-24, London, Royal Institution of Naval Architects. Chapanis, A. (1965). Research Techniques in Human Engineering (p. 316). The John Hopkins University Press. Clarke, E. M., Grumberg, O., & Peled, D. A. (2000). Model Checking (p. 313). MIT press. Endsley, M. (2000). Theoretical underpinnings of situation awareness: A critical review. In M. R. Endsley & D. J. Garland
(Eds.), Situation awareness analysis and measurement (pp. 3–32). Lawrence Erlbaum Associates Inc. Endsley, M. R. (1995). Toward a Theory of Situation Awareness in Dynamic Systems. Human Factors: The Journal of the Human Factors and Ergonomics Society, 37(1), 32–64. Endsley, M. R., & Jones, D. G. (2012). Designing for Situation Awareness: An Approach to User-Centered Design (2nd ed., p.
396). Taylor & Francis. Fricke, M. (2009). The knowledge pyramid: a critique of the DIKW hierarchy. Journal of Information Science, 35(2), 131–142.
doi:10.1177/0165551508094050
Grech, M., Horberry, T., & Smith, A. (2002). Human error in maritime operations: Analyses of accident reports using the leximancer tool. In Proceedings of the Human Factors and Ergonomics Society Annual Meeting (Vol. 46, pp. 1718–1721). SAGE Publications. Gregson, R. A. M. (1975). Psychometrics of similarity. Academic Press (p. 262). New York: Academic Press Inc. Herman, I. (2000). Graph visualization and navigation in information visualization: A survey. IEEE Transactions on
Visualization and Computer Graphics, 6(1), 24–43. Hetherington, C., Flin, R., & Mearns, K. (2006). Safety in shipping: the human element. Journal of Safety Research, 37(4), 401–
11. doi:10.1016/j.jsr.2006.04.007 Hollnagel, E. (2003). Handbook of Cognitive Task Design (p. 840). CRC Press. doi:10.1201/9781410607775 ISO9241-210. (2009). ISO 9241-210: Ergonomics of human-system interaction - Part 210: Human-centred design for interactive systems (ISO 9241-2.). Jones, D., & Endsley, M. (1996). Sources of Situation Awareness Errors in Aviation. Aviation, Space, and Environmental
Medicine, 67(6), 507–512. Koreimann, D. S. (2000). Grundlagen der Softwareentwicklung (Third Edit., p. 448). Munich: Oldenbourg. Meolic, R., Kapus, T., & Brezocnik, Z. (2000). Model checking: A formal method for safety assurance of logistic systems. 2nd Congress Transport - Traffic -Logistics Portoroz, Slovenia, 355–358. NoMagic. (2014). NoMagic Website. Retrieved February 22, 2014, from http://www.nomagic.com/products/magicdraw.html Rowley, J. (2007). The wisdom hierarchy: representations of the DIKW hierarchy. Journal of Information Science, 33(2), 163–
180. doi:10.1177/0165551506070706 Stanton, N. A., & Young, M. S. (1999). A Guide to Methodology in Ergonomics: Designing for Human Use (p. 152). CRC Press. Tversky, A. (1977). Features of Similarity. Psychological Review, 84(4), 327–352. Weber, J., & Schäffer, U. (2006). Einführung in das Controlling (p. 503). Schäffer-Poeschel. Weilkiens, T. (2011). Systems Engineering with SysML/UML: Modeling, Analysis, Design (p. 320). Elsevier Science. Wickens, C. D., & McCarley, J. S. (2008). Applied attention theory (p. 240). Taylor & Francis. Wilson, J. R., & Corlett, N. (2010). Evaluation of Human Work (p. 1048). Taylor & Francis.
LISTED IN THE AHFE DIGITAL BOOKSTORE CATALOGUE
Explore the complete digital volume
Advances in Human Aspects of Transportation: Part I
Read this individual research paper free through the original publisher, or explore the full digital proceedings book.
ISBN 978-1-4951-2097-8
Explore this ISBN in the AHFE Bookstore ↗Listed in the July 2026 bookstore catalogue; search by ISBN to confirm current availability · Digital book purchase optional