Kristie L. Younga, Michael G. Lennéa, Vanessa Beanlandb, Paul M. Salmonc, Neville A. Stantond (2021). Drivers’ Visual Scanning and Head Check Behavior on Approach to Urban Rail Level Crossings. In: Advances in Human Aspects of Transportation: Part I. AHFE Open Access, vol. 15. https://doi.org/10.54941/ahfe100651
Rail level crossings in urban areas are often located in areas of high visual clutter such as busy shopping strip areas. The impact of such visual clutter on drivers’ behavior and compliance with level crossing controls is not well understood. This study examines drivers’ visual scanning behavior on approach to five urban rail level crossings located in shopping strips. Twenty participants drove an instrumented vehicle around a pre-defined urban route containing a range of active (flashing light with boom barriers) rail level crossings. Drivers' eye glance and head check behavior during the 150 meter approach to each crossing was coded from video. Results revealed that drivers direct their visual attention off the forward roadway to a range of areas inside and outside the vehicle when approaching the crossing, with around 10 percent of glance fixations made to areas away from the forward roadway and the level crossing. Drivers made very few head checks of the crossing on approach, suggesting that they are heavily reliant on the crossing signals to alert them to the presence of a train. This study provides important insight into drivers’ visual behavior on approach to urban level crossings located in areas of high visual demand.
Crashes at rail level crossings constitute a significant safety concern worldwide. These crashes are often catastrophic, involving multiple fatalities and traumatic injuries. In 2011, 49 collisions between trains and road vehicles at rail level crossing were recorded in Australia, leading to 33 fatalities (ATSB, 2012). The costs associated with rail level crossing crashes in Australia have been estimated at approximately AUD $24 million per year. In the European Union (EU), level crossing collisions and fatalities represent more than one quarter of all railway crashes occurring on the EU railway system, with 604 fatal and serious injury casualties recorded at level crossings during 2011 (European Railway Agency, 2013). Figures from the US are similar, with 247 fatalities and 705 injuries at rail level crossings in 2009 (US Department of Transportation, 2014). Given the high levels of trauma and disruption to rail and road networks associated with rail level crossing crashes, their prevention represents a key priority area for rail and road organizations across the world.
The causes of crashes at rail level crossings are poorly understood; however, driver behavior has been found to play a key role (Davey et al., 2006; Lenné et al., 2011). The direct causal factors relating to driver behavior typically fall into two broad categories (Lenné et al., 2011). The first involves intentional non-compliance with crossing signals, whereby drivers detect the train and/or the activation of crossing warnings and fully understand the meaning of the warnings, but will nevertheless intentionally cross. A propensity to engage in risk taking or sensation seeking behavior and a low perception of risk have both been found to contribute to intentional non-compliance at rail level crossings (Davey et al. 2008; Witte & Donohue, 2000). The second, particularly prevalent category is unintentional non-compliance where drivers, for a range of reasons, fail to detect the crossing signals, fail to comprehend the signals’ meaning or fail to detect the train itself, and will enter the crossing as a train approaches. Indeed, it has been estimated that unintentional non-compliance accounts for almost half of all rail level crossing crashes in Australia (ATSB, 2002). Diminished situation awareness, distraction and inattention are likely to be key contributors to unintentional non-compliance at rail level crossings (Caird et al., 2002; Salmon et al., 2013); however, the reasons why situation awareness is degraded, or why inattention occurs, are less clear. This is primarily because of limitations in the approaches adopted during previous research.
The modest number of studies that have examined driver behavior in this context have been largely observational in nature, employing on-site observers or video analysis (e.g., Meeker et al., 1997; Tenkink & Van der Horst, 1990; Tey et al., 2011). The primary measure derived from such observational studies is driver non-compliance with the crossing signals, which has been estimated to be between 14 and 38 percent for active crossings with flashing lights and boom barriers (Meeker et al., 1997; Witte & Donohue, 2000). Unfortunately observational studies do not allow for an in-depth examination of driver behavior in terms of the factors underpinning compliance and non-compliance; in particular, drivers’ situation awareness, workload and the focus of their attention, as well as the system-wide factors underlying each of these to shape driver behavior. Developments in vehicle instrumentation now make it possible to examine driver behavior at rail level crossings in greater depth in on-road settings using a suite of on- board driver and vehicle monitoring equipment coupled with human factors methods.
The study described in this paper focusses on rail level crossings in urban environments. In such areas, one factor that is likely to shape driver behavior on approach to rail level crossings and contribute to unintentional non- compliance is the location of crossings within high workload segments of the road network. Urban rail level crossings are often surrounded by busy shopping strips with high levels of pedestrian, vehicle and cyclist traffic and a high level of visual clutter (objects unrelated to driving) from surrounding buildings and signs. Complex road environments that contain dense traffic and visual clutter have been shown to increase driver workload and the potential for distraction by removing the driver’s eyes off the road or impairing their visual scanning patterns (Horberry, 1998; Jahn et al., 2005; Patten et al., 2006). Thus, the complex traffic environment in which many urban rail level crossings reside could be inducing high levels of driver workload and distraction, which in turn may lead to drivers paying less attention to the level crossing due to their attention being diverted elsewhere. Indeed, Pickett and Grayson (1996) identified three types of drivers who are likely to be involved in a crash at rail level crossings, one of which involved those drivers who are unaware of the signals due to inattention or distraction. Further, in an analysis of Canadian rail level crossing crashes over a 19 year period, Caird et al. (2002) found that a number of crashes involved driver distraction as a factor contributing to drivers failing to see the signals/train at all, or in time to stop. Driver attention being diverted from the rail level crossing, thus, clearly presents a problem that can lead to a failure to safely negotiate the crossing. When the crossing is currently active and drivers fail to detect the signals or detect them too late the results can be catastrophic. However, distraction and inattention may also affect level crossing behavior when no train is immediately present, such as when drivers fail to detect traffic backed up on the far side of the crossing and are forced to queue on the crossing itself, creating potentially dangerous situations if the traffic does not clear before the next train approaches.
Very little is currently known about where drivers direct their attention on approach to rail level crossings and the influence of a high workload environment on drivers’ attention and behavior in relation to the crossing. The current on-road study aimed to examine where drivers direct their visual attention on approach to urban rail level crossings that are situated in high workload areas of the road network - shopping strips. Drivers’ eye glance data were examined for the 150m approach to urban rail level crossing to identify what aspects of the road environment drivers are focusing their visual attention on when approaching level crossings and how much of this attention is or is not focused on the crossing itself.
METHOD
Participants Twenty drivers (11 males, 9 females) aged 18-53 years (M = 26.8, SD = 9.2) participated in the study. All participants held a current Victorian car driver’s license, drove regularly in urban areas and spoke English as their first language. Eight participants held a valid Full driver’s license while the remaining twelve held a valid P2 (second year provisional) license. Participants had held their drivers license for an average of 8.5 years (SD = 9.2) and drove an average of 7.8 hours (SD = 5.5) per week. Participants were recruited through the weekly on-line Monash University newsletter and were compensated for their time and travel expenses. The study was approved by the Monash University Human Research Ethics Committee.
On-Road Test Vehicle & Measures The On-Road Test Vehicle (ORTeV) is an instrumented vehicle equipped to collect vehicle-related and video data. Vehicle CAN-bus and video data were acquired using a Racelogic Video VBOX Pro system, which combines a GPS logger, multiple cameras and a 32-channel CAN interface. Vehicle data collected included: trip time and distance, GPS location, vehicle speed, brake pressure, and vehicle heading. Video data were derived from seven unobtrusive cameras which recorded forward and peripheral views spanning 90° each respectively as well as the driver, the vehicle cockpit and the rear of the vehicle. For the purpose of the current paper, the video data was used to manually code the drivers’ visual scanning behavior.
Driving Route The driving route comprised an 11 km urban route around the south-eastern suburbs of Melbourne. The test route comprised arterial roads (80, 70 and 60 km/h) and shopping strip (40 and 50 km/h) areas and contained a total of six rail level crossings, all with active controls (flashing lights with boom barriers and bells). The route took approximately 20-25 minutes to complete. To control for traffic conditions, all drives were completed on weekdays at either 10am or 2pm. These times had been assessed by the authors prior to the study to ensure that participants would experience similar traffic conditions. Direction instructions were provided to participants prior to the drive and participants also carried a map with them on the route.
Procedure A demographic (age, gender, license type, driving history) questionnaire was completed by participants prior to the study. Participants were then seated in the ORTeV and the data collection systems were initiated. Participants completed the driving route while driving alone in the vehicle. Two in-vehicle observers followed the participant at a distance in another vehicle to ensure that they could re-direct the participants back on-course in the event that they took a wrong turn. Participants provided verbal protocols throughout the test drive. After the completion of the drive, drivers were taken back to the university where they completed an interview about their experiences during the drive.
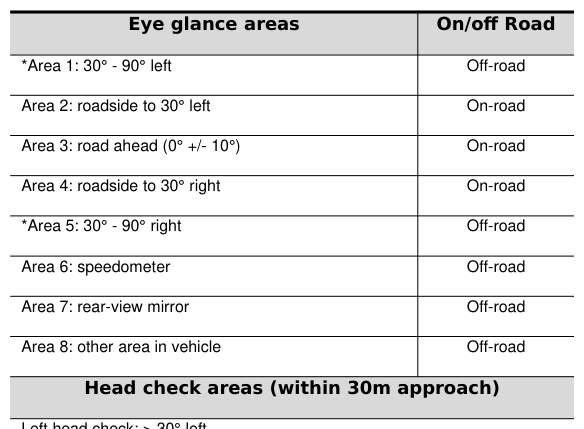
Data Coding Five of the six rail level crossings encountered were examined in this paper. One level crossing was not included in the analysis as it was not located in a shopping strip area. Drivers’ visual scanning behavior on the 150 meter approach to each level crossing to the point where the vehicle cleared the train tracks was manually coded using the on-board videos. The driver and forward facing camera views were used to determine the location of each glance while the vehicle was moving. The location of drivers’ glances were coded across eight different areas including various segments of the forward and side roadway, mirrors and inside the vehicle (Table 1). The number and duration (msec) of glances to each of the eight areas, the mean distance from the level crossing that drivers glanced to off-road areas and the percentage of time spent with eyes off the forward roadway was coded for the approach to the level crossings. A glance was defined as an uninterrupted fixation to the area of interest. The video was recorded at 10Hz, thus fixations were examined in 100 msec intervals by moving through the video frame by frame and recording which area the driver’s gaze was directed. Only glances where vehicle speed was above 0 km/h were coded.
Head checks directed toward the level crossing were also examined. Drivers were coded as having executed a head check if, within the 30m immediately prior to the crossing, their head direction and gaze fixation deviated in excess of ±30° horizontally, where 0° indicates straight ahead. Outside of the 30m approach, glances in excess of ±30° were coded as being directed toward the footpath and shop areas.
The eye glance behavior was coded by a trained coder. A sample of approximately 10 percent of the level crossing approach videos were independently coded by a second coder and inter-rater reliability was examined using Pearson’s r. The reliability between the two raters was excellent for the number of glances made to each area (r = 0.94, p < .001) and the duration of glances (r = 0.95, p < .001).
Table 1: Areas used for coding driver eye glances and head checks on approach to urban rail level crossings Eye glance areas On/off Road
Right head check: > 30° right *only coded 150m to 30m before crossing
RESULTS
The eye glance behavior of driver on approach to the five urban rail level crossings was examined to determine to what areas, and for how long, drivers direct their visual attention when approaching urban crossings. Eye-glance data were not captured for two novice drivers due to video recording issues. As drivers’ eye glance behavior is likely to be affected by the presence of a train or activated crossing signals, crossing events were coded as to whether the driver encountered a train or not and crossings where a train was present were directly compared with those where no train was present. Eye glance behavior was pooled across the five level crossings and examined across the eight glance areas when a train was present and not present in a series of Generalized Estimating Equations (GEE). GEE is an extension of the Generalized Linear Model and is useful for analyses such as these because it factors in correlations due to the repeated measurements. The models to examine the mean duration of glances and total percentage of time fixated on each area were specified with a normal error distribution, an identity link function and the correlation matrix was specified as exchangeable due to convergence problems. The model to examine the mean distance from the crossing when off-road glances were made was specified with a normal error distribution, an identity link function and the correlation matrix was specified as unstructured. Finally, the model to examine the frequency of glances to each area was specified with a Poisson error distribution and a log link function as it was count data and the correlation matrix was specified as exchangeable due to convergence issues.
Frequency and Duration of Glances The mean number and duration of glances taken to each of the eight areas on the 150m approach to urban rail level crossings is displayed in Table 2, separately for when a train was present and when no train was present. As shown, the on-road areas had the highest number of mean glances and glances to these areas were also of longer duration than glances to off-road areas. A GEE model was fitted to examine if the number of fixations made to each area differed across level crossings with a train present versus no train present. A significant train presence by glance area interaction was found (p < .001), whereby when a train was present drivers made a greater number of glances to all areas except the speedometer, which they glanced at more frequently when no train was present. The GEE model for the mean duration of glances to each area revealed a similar pattern of results, with a significant train presence by glance area interaction (p < .001) indicating that, on approach the crossings, drivers glanced to all areas longer when a train was present, apart from the speedometer and rear-view mirror, which they glanced at for longer when no train was present. Taken together, these results reveal that drivers made longer and more frequent glances to the forward roadway on approach to urban level crossings when a train was present, compared to when no train was present. However, they also reveal that drivers made longer and more frequent glances to a number of off-road areas when a train was present, including to footpaths and shops on either side and to other areas inside the vehicle.
Table 2: Mean (SD) frequency and duration (s) of glances made to each area on approach to urban level crossings by train status Mean Frequency Mean duration (s)
Table available in the original PDF paper.
Area
Train No train Train No train 1: 30° - 90° left (footpath and shops)* 0.5 (0.8) 0.2 (0.5) 0.8 (0.2) 0.6 (0.1)
8: other area in vehicle* 0.6 (0.6) 0.5 (1.0) 1.2 (0.4) 0.9 (0.3) *Defined as off-road glances
Percentage of Time Fixated on Off-road Areas Given that the individual glance duration and frequency data are substantially affected by travel speed and the overall duration of the approach period, the percentage of time spent fixated on a particular area was also examined as it controls for the total time spent on approach. Table 3 displays the percentage of time spent fixated on each of the eight areas on approach to the urban rail level crossings. The data show that drivers spent just under 10 percent of time on approach to the urban crossings with their visual attention off the forward roadway (9.5% when train present and 8.3% when no train present). The GEE model for the percentage of time drivers spent looking at each area revealed a significant train presence by glance area interaction (p = .044). The majority of the time was spent glancing at the road ahead, regardless of whether a train was present or not, but when a train was present drivers spent slightly less time glancing at the road ahead and more time glancing at roadside areas, particularly to the left. In contrast, when no train was present drivers predominantly looked at the road ahead but spent a higher proportion of time glancing at the speedometer and rearview mirror. The proportion of time glancing at other in-vehicle areas did not vary between train present and no-train crossings.
Table 3: Percentage of time fixated on each area on approach to urban level crossings by train status % of time
Table available in the original PDF paper.
Area
Train No train 1: 30° - 90° left (footpath and shops)* 2.7 0.7
2: roadside to 30° left 4.6 2.5 3: road ahead (0° +/- 10°) 69.2 73.1
4: roadside to 30° right 16.7 16.1 5: 30° - 90° right (footpath and shops)* 3.2 2.4
8: other area in vehicle* 2.3 2.2 *Defined as off-road glances
Distance from the Rail Level Crossing when Off-Road Glances Made Examining the distance drivers were from the crossing when they glanced to off-road areas can provide insights into drivers’ visual scanning strategies and how they may regulate their off-road glances in relation to the crossing. Drivers were defined as reaching the crossing when the front of the vehicle was level with the first rail of the train tracks. Table 4 shows the mean distance (in meters) drivers were from the crossings when they glanced to each of the five off-road areas on approach to each rail level crossing. As displayed, the drivers were quite far from the rail level crossings when they made their glances to the off-road areas, particularly to the off-road area that was unrelated to driving – ‘other area inside the vehicle’; suggesting a fairly conservative off-road scanning strategy. Results of the GEE model revealed a significant train presence by glance area interaction (p = .002). Drivers glanced to all off-road areas a longer distance from the crossings when a train was present, compared to when no train was present, apart from the rear-view mirror, which drivers were presumably using to monitor vehicles behind them as they came to a stop for the train.
Table 4: Mean (SD) distance (meters) from level crossings when glances were made to each off-road area by train status
Table available in the original PDF paper.
Area Train No train 1: 30° - 90° left (footpath and shops) 91.7 (3.5) 71.5 (24.6)
5: 30° - 90° right (footpath and shops) 97.5 (19.0) 84.4 (25.7) 6: speedometer 103.3 (34.8) 80.6 (36.6)
7: rear-view mirror 53.9 (18.2) 86.5 (39.3) 8: other area in vehicle 92.9 (29.9) 91.9 (37.8)
Head Checks toward the Rail Level Crossings Driver head checks within the 30 meters immediately prior to entering the crossing were examined. Table 5 details the mean number of head checks made and the distance from the crossing when the first and final head checks were made. Data are reported descriptively due to the limited number of head checks made by drivers (the median number of head checks made was 0, regardless of whether a train was present). Drivers made only a small number of head checks of the level crossings, with many drivers making no head checks. Drivers made slightly more head checks overall when a train was present, although head checks were typically performed earlier when no train was present at the crossing.
Table 5: Mean (SD) number of head checks and distance (meters) from RLX when first and final head checks by train status
Table available in the original PDF paper.
Train No train
Mean number of head checks
Left 0.14 (0.14) 0.14 (0.14) Right 0.42 (0.37) 0.23 (0.25)
Mean distance from crossing: First head check
Left 6.9 (12.2) 15.0 (11.2) Right 12.1 (8.0) 15.4 (9.2)
Mean distance from crossing: Final head check
Left -1.3 (11.6) 6.4 (10.6) Right 8.9 (8.1) 11.2 (8.1)
DISCUSSION
This paper presents the findings of an on-road study that aimed to examine, using an instrumented vehicle, where drivers direct their visual attention on approach to urban rail level crossings that are situated within urban shopping strips.
Results revealed that drivers spent the majority of their time on approach to urban crossings with their visual attention focused on the forward roadway (over 90 percent). However, the findings also show that drivers do direct their visual attention from the forward roadway to a range of areas inside and outside the vehicle when approaching urban level crossings, including footpaths/pedestrians, buildings, the speedometer and inside the vehicle. Within the 150 m approach period, drivers spent around 10 percent of the time on approach, fixating on off-road areas.
The presence of a train at the urban rail level crossings did influence drivers’ visual scanning behavior. Drivers took longer and more frequent glances to the forward roadway on approach to urban level crossings when a train was present compared to when no train was present. Drivers also glanced at the speedometer and rear-view mirror for longer periods on approach when no train was present. However, results also revealed that drivers took longer and more frequent glances to a number of off-road areas when a train was present, including the footpaths and shops on either side and to other areas inside the vehicle. One explanation why drivers spent more time looking at these off- road areas when a train was present is that they were travelling slower in these situations due to the need to come to a stop at the crossing. That is, drivers may have felt more confident looking at areas unrelated to driving when travelling at the slower speeds associated with the presence of trains. Glances to these off-road areas were also typically short (< 1.5s) and were made when drivers were a fair distance from the crossings (> 50m), suggesting that drivers better regulated their off-road glances on immediate approach to the crossings. Further, due to the slower speeds drivers also spent more time on approach to the crossing, which explains the fact that overall glance durations and frequencies were greater when a train was present compared to when no train was present. When controlling for this time difference and instead comparing the percentage of time spent looking in each area, drivers still spent longer looking at off-road areas in the presence of a train, compared to when no train was present.
Driver head check behavior within the 30 meters immediately prior to entering the crossing revealed that, on average, drivers made a very small number of head checks at the level crossings, with many drivers not making any head checks at all on approach. Drivers made a slightly higher number of head checks when a train was present, but these were performed later in the approach than when no train was present. These findings indicate that the drivers rarely actively check for trains at urban crossings, and this is particularly the case when the crossing signals have not been activated on approach. In an earlier study of driver behavior at level crossings in rural areas, Lenné et al (2013) found that drivers completed a higher number of head checks (5 to 6) at passive crossings (stop and give way) compared to actively controlled (boom barrier) crossings (1 to 2 checks). Taken together, the results of both studies suggest that at urban rail level crossings located in high workload areas, drivers have become heavily reliant on the crossing signals to alert them to the presence of a train. It is also possible that drivers may be restricted in their ability to perform effective head checks in built-up urban environments, such as the ones examined in this study, as their sightlines are restricted by buildings and other infrastructure. Nevertheless, drivers failing to scan the crossing for trains, regardless of the reason, could be problematic in a number of instances; for example, if the level crossing warning infrastructure fails or when drivers’ attention is diverted momentarily away from the crossing warnings immediately prior to activation.
This is the first study to examine drivers’ visual scanning and head check behavior on approach to urban rail level crossings in an on-road context. Our findings extend previous observational studies (e.g., Meeker et al., 1997; Tenkink & Van der Horst, 1990; Tey et al., 2011) by moving beyond examining driver compliance at rail level crossings to exploring an aspect of driver behavior that may underlie why drivers fail to comply with crossing signals, namely where they focus their visual attention on approach and how this is shaped by the wider road environment. Overall, the visual scanning findings from the current study suggest that while drivers spend the majority of the time on approach to urban crossings with their eyes on the forward roadway, they do also look at various off-road areas, even when a train is approaching. Our findings therefore lend support to previous work by Caird et al. (2002) and Pickett and Grayson (1996) which suggest that driver distraction could play a role in drivers failing to detect the signals at level crossings. Further work should investigate the mechanisms underlying driver distraction at rail level crossings. Is the environment too visually demanding or attention grabbing leading drivers to pay less attention to rail level crossings? Are the level crossings not conspicuous enough in busy urban areas? Or do drivers simply not consider rail level crossings to be risky enough to warrant their undivided attention?
While providing important insights into driver behavior at urban crossings located in high workload areas, visual scanning and head check behavior provide only part of the picture. As part of the wider rail program, the authors are interrogating drivers’ verbal protocols and post-drive interview data to build more comprehensive picture of driver behavior on approach to urban rail level crossings. These analyses will provide insight into where drivers direct their cognitive as well as their visual attention on approach to urban crossings, what information cues drivers use to identify the presence of the crossing and make their crossing decision and how behavior in this context might be influenced by driver experience.
ACKNOWLEDGEMENTS
This project is funded by ARC Linkage Grant (LP100200387) to Monash University in partnership with the University of Sunshine Coast and the University of Southampton, and the following partner organizations: the Victorian Rail Track Corporation, transport Safety Victoria, Public Transport Victoria, Transport Accident Commission, Roads Corporation (VicRoads) and V/Line Passenger Pty Ltd. We gratefully acknowledge the support of project partners and community participants. We also acknowledge the technical assistance provided by Nebojsa Tomasevic, the data collection assistance of Christine Mulvihill and Casey Mackay and the video coding assistance of Campbell Andrea. Associate Professor Salmon’s contribution to this research was funded through his NHMRC post-doctoral training fellowship.
REFERENCES
ATSB. (2002). Level crossing accidents: fatal crashes at level crossings. Paper Presented at the 7th International Symposium on Railroad-highway Grade Crossing Research and Safety, Melbourne, Victoria, Australia. ATSB. (2012). Australian Rail Safety Occurrence Data 1 July 2002 to 30 June 2012. Report number RR-2012-010.
Australian Transport Safety Bureau, Canberra, ACT. Caird, J.K., Creaser, J.I., Edwards, C.J., & Dewar, R.E. (2002). A human factors analysis of highway-railway grade crossing accidents in Canada. TP 13938E. Transport Canada, Ottawa, Canada. Davey, J., Ibrahim, N., & Wallace, A. (2006). Human Factors at Railway Level Crossings: Key Issues and Target
Road User Groups. In Proceedings of the Swinburne University Multimodal Symposium on Safety Management and Human Factors, 9-10 February 2006, Melbourne, Australia. Davey, J., Wallace, A., Stenson, N., & Freeman, J. (2008). Young drivers at railway crossings: an exploration of risk perception and target behaviours for intervention. International Journal of Injury Control and Safety Promotion, 15(2), 57-64. European Railway Agency. (2013). Intermediate report on the development of railway safety in the European
Union. European Railway Agency Safety Unit, 15 May 2013. Horberry, T., 1998. Bridge strike reduction: the design and evaluation of visual warnings. Ph.D. Thesis. University of Derby, UK. Jahn, G., Oehme, A., Krems, J.F., & Gelau, C. (2005). Peripheral detection as a workload measure in driving:
effects of traffic complexity and route guidance system use in a driving study. Transportation Research Part F: Traffic Psychology and Behaviour, 8(3), 255–275. Kirwan, B., Kaarstad, M., Hauland, G., & Follesoe, K. (1995). See no evil, hear no evil, speak no evil: verbal protocol analysis, eye movement analysis, and nuclear power plant diagnosis. In S.A. Roberston (Ed.), Contemporary Ergonomics. London, U.K.: Taylor & Francis. Klein, G., Calderwood, R, & McGregor, D. (1989). Critical decision method for eliciting knowledge. IEEE
Transactions on Systems, Man & Cybernetics, 19(3), pp. 462-472. Lenné, M.G., Beanland, V., Salmon, P.M., Filtness, A.J., & Stanton, N. (2013) Checking for trains: an on-road study of what drivers actually do at level crossings. In Dadashi, N., Scott, A., Wilson, J.R., & Mills, A. (Eds.) Rail Human Factors : Supporting reliability, safety and cost reduction. London, U.K.: Taylor & Francis. Lenné, M.G., Rudin-Brown, M., Navarro, J., Edquist, J., Trotter, M.G., Tomesevic, N. (2011). Driver behaviour at
rail level crossings: responses to flashing lights, traffic signals and stop signs in simulated driving. Applied Ergonomics 42(4), 548–554. Meeker, F., Fox, D., & Weber, C. (1997). A comparison of driver behaviour at railroad grade crossings with two different protection systems. Accident Analysis and Prevention, 29(1), 11-16. Patten, C.J., Kircher, A., Ostlund, J., Nilsson, L., & Svenson, O. (2006). Driver experience and cognitive workload
in different traffic environments. Accident Analysis and Prevention, 38(5), 887–894. Pickett, W., & Grayson, G.B. (1996). Vehicle driver behaviour at level crossings (No. 98). Transport Research Laboratory, Berkshire, United Kingdom. Salmon, P.M., Lenné, M.G., Young, K.L., Walker, G.H. (2013). An on-road network analysis-based approach to
studying driver situation awareness at rail level crossings. Accident Analysis and Prevention, 53, 195-205. Sanderson, P.M., Verhage, A.G., & Fuld, R.B. (1989). State-space and verbal protocol methods for studying the human operator in process control. Ergonomics, 32(11), 1343-1372. Stanton, N. A., Walker, G. H., Young, M. S., Kazi, T., Salmon, P. M. (2007). Changing drivers' minds: the
evaluation of an advanced driver coaching system. Ergonomics, 50(8), 1209-1234. Tenkink, E., & Van der Horst, R. (1990). Car driver behaviour at flashing light railroad grade crossings. Accident Analysis and Prevention, 22(3), 229-239. Tey, L.S., Ferreira, L., Wallace, A., 2011. Measuring driver responses at railway level crossings. Accident Analysis
and Prevention, 43(6), 2134–2141. US Department of Transportation. (2014). Railway-Highway Grade Crossing facts and statistics. Federal Highway Administration. Retrieved 8 January 2014 from: http://safety.fhwa.dot.gov/xings/xing_facts.cfm. Walker, G. H., Stanton, N. A., Kazi, T. A., Salmon, P. M., & Jenkins, D. P. (2009). Does advanced driver training
improve situation awareness? Applied Ergonomics, 40:4, pp. 678-87. Walker, G.H., Stanton, N.A., & Young, M.A. (2007). Easy rider meets knight rider: an on-road exploratory study of situation awareness in car drivers and motorcyclists. International Journal of Vehicle Design, 45(3), 307-322. Witte, K., & Donahue, W. (2000). Preventing vehicle crashes with trains at grade crossings: The risk seeker
challenge. Accident Analysis & Prevention, 32, 127–139. Young, K.L., Salmon, P. M., & Cornelissen, M. (2013). Missing Links? The Effects of Distraction on Driver Situation Awareness. Safety Science, 56, 36-43.
LISTED IN THE AHFE DIGITAL BOOKSTORE CATALOGUE
Explore the complete digital volume
Advances in Human Aspects of Transportation: Part I
Read this individual research paper free through the original publisher, or explore the full digital proceedings book.
ISBN 978-1-4951-2097-8
Explore this ISBN in the AHFE Bookstore ↗Listed in the July 2026 bookstore catalogue; search by ISBN to confirm current availability · Digital book purchase optional