Elena Psyllou, Arnab Majumdar, Washington Y. Ochieng (2021). Airspace Infringements in European Airspace. In: Advances in Human Aspects of Transportation: Part I. AHFE Open Access, vol. 15. https://doi.org/10.54941/ahfe100609
Airspace infringements (AIs), which can be defined as unauthorised entry of an aircraft in controlled airspace, are one of the primary concerns of the general aviation (GA) in Europe. Such incidents can significantly reduce the distance between different types of air traffic, increasing the risk of a catastrophic mid-air collision. Key issues of AIs in GA were identified in previous studies of EUROCONTROL; however, there are concerns about the efficacy of the analysis of incident reports of AIs. Therefore, this paper proposes a robust safety analysis methodology for AIs involving GA in Europe. It initially reviews the studies conducted by EUROCONTROL in relation to the AIs and then it describes the proposed methodology to find contributory factors of AIs from incident reports. Relationships between these factors are investigated using contingency tables and log linear models and these factors are ranked regarding their frequency of occurrence. Finally, two severity models are developed using the contributory factors. For the purpose of the study high quality data were provided from the Norwegian Air Navigation Service Provider Avinor (ANSP) for the period 2008-2012. The results indicate that the ANSP should focus on GA pilots, flying in the springtime in southern Norwegian airspace to ensure appropriate navigation and communication skills.
General aviation (GA) aircraft usually fly in uncontrolled airspace in which VFR traffic is responsible for the separation with other aircraft. GA aircraft, however, might enter into controlled airspace, in which traffic are usually separated by air traffic controllers who are also responsible to choose which aircraft flies in and its flight path, without permission. Such situation can cause considerable problems for air traffic control, any other aircraft in the vicinity as well as for the infringing aircraft. This may reduce the separation between aircraft to a critical level and has the potential to lead to a catastrophic mid-air collision. This unauthorized entry of an aircraft into a controlled airspace can be defined as an airspace infringement (AI).
AIs represent one of the most frequently reported types of incidents in Europe and involve mainly GA aircraft (Safety Regulation Commission, 2012). The European incident reporting scheme changed in 2010 leading to a 25% increase in the total annual number of AIs reported. Of the approximately 250 incidents reported in that year, 25% were not analysed either because of lack of adequate information to assess their severity or lack of time to do so. As for their impact on safety, approximately 70% of the incidents analysed led to a loss of separation with another aircraft in 2010. Given this high proportion of incidents that could not be analysed, there are serious concerns Human Aspects of Transportation I (2021) regarding the efficacy of the methods used to report and to analyse such incidents.
Such concerns about the analysis of AIs, given their potential catastrophic impact, suggests the need to develop a robust safety analysis methodology for AIs involving GA in Europe and this paper aims to do this by using AIs from the Norwegian Air Navigation Service Provider (ANSP) Avinor involving GA. In particular, this paper shows that high-quality safety data, such as those of Avinor, can be used for identifying mathematical relationships between contributory factors and the impact that these factors have on the safety effect using the proposed methodology.
The paper is organized as follow. Studies conducted by EUROCONTROL in relation to the AIs are initially reviewed and the methodology used in this paper and the data that will be used are outlined in the next section. Then, Avinor database is described and assessed in terms of its quality. The next section is centred round the contributory factors of AIs and compares the content of the taxonomies obtained from the literature review with that obtained in the safety data; it also estimates associations between contributors, and designs mathematical models for the severity. This is followed by a discussion of the results including the importance of the proposed analysis for the ANSP in preventing future AIs before concluding.
LITERATURE REVIEW OF THE ANALYSIS OF AIRSPACE INFRINGEMENTS IN EUROPE In a series of studies conducted by EUROCONTROL between 2007 and 2008, retrospective analyses of AIs attempted to identify the people that are involved in such incidents, the events that can lead to an incident as well the likely contributory factors. The first study, which used a relatively small sample of incident reports from nine European countries that occurred between 2004 and 2005, indicated that AIs are more frequent in GA than in commercial aviation (EATM, 2007a). The severity of the incidents, however, could not be determined because of the absence of a detailed taxonomy of contributory factors and event sequences of the AIs. This limitation was partially overcome by outlining the safety barriers that could prevent an AI (EATM, 2007b).
In order to improve the weak taxonomy of contributory factors of AIs, a survey of GA pilots, who are the main contributors of AIs, was designed in the second study (EATM, 2007b). GA pilots were chosen randomly from 28 European countries to answer a questionnaire regarding their view on the contributory factors of AIs and likely mitigation measures. The contributory factors proposed by the pilots, which differed from those of the first study, were mainly related to: pilot behaviour, pilot skills e.g. the misuse of aeronautical data, and knowledge of the rules and procedures of flying. These pilot-related factors also contribute to other incidents and accidents in GA (Hunter, Martinussen, Wiggins, & O’Hare, 2011; Wiegmann et al., 2005).
The capabilities and limitations of these two sources of data for AIs (safety data and questionnaires/interview) were confirmed in the third study. The study used both a sample of reports of approximately 100 AI incidents that occurred in the areas surrounding Geneva and Zurich airports in Switzerland, and in conjunction with a discussion with GA pilots at aviation clubs (EATM, 2008). The analysis confirmed that safety data could identify scenarios in which AIs may occur, however; they are inappropriate for developing taxonomy of contributory factors and for assessing the severity of AIs incidents. Such information can be found from discussions or surveys with the GA pilots but their outcome depends to a large extent on the design of the interview/survey and the available resources. An inappropriate interview strategy, such as that in the third study conducted by EUROCONTROL, is unlikely to determine the detailed factors. A well-designed survey, such as that conducted by the Safety Regulation Group of the CAA UK, can result in an exhaustive taxonomy (Safety Regulation Group, 2003). This taxonomy was developed using approximately 2500 responses of GA pilots, who were based in the UK, in the period July 2001 and January 2003 (Safety Regulation Group, 2003).
Although these studies identified the major areas of factors that are related to AIs and can be used for further studies, concerns were raised regarding the efficacy of the analysis of safety incident reports. This paper, therefore, examines how the capabilities and limitations the current incident reporting scheme has for the analysis of AIs by using incidents from Avinor and presents the basic characteristics of AIs.
METHODOLOGY
The analysis in this paper is separated into two distinct parts. The first part aims to assess the quality of the incident data and to provide an overview of the key characteristics of the AIs in Norway, such as the location of the incident. The quality assessment is based on the criteria of accessibility, consistency, completeness and relevance as (1), (2), (3) and (4) show below (Dupuy, 2012). The database can only be used if the criteria score over 50% as recommended in [7]. When data are missing, the narratives and the other information, such as the airspace class, are used to fill in the gaps.
×100
Equations and mathematical formulas are available in the original paper PDF.
8 N relevant ,i Nrequest, i
where N is the number of variables for each
The second part of the analysis focuses on the contributory factors of AIs. Firstly, the factors obtained by the studies of EUROCONTROL and the Safety Regulation Group of the CAA UK are reviewed to develop a taxonomy of contributory factors that should be clearly defined to specify any underlying assumptions and overlaps with other factors (EATM, 2007a; EATM, 2007b; EATM, 2008; Safety Regulation Group, 2003). This taxonomy is compared with the factors obtained from Avinor database. The likely contributory factors of the data are identified for each incident based on the narratives and they are considered as dummy variables; if a contributory factor is true, it is coded with the number 1 otherwise with 0.
Once the contributory factors are identified, statistical models are used to find relationships between them. The statistical relationships between the factors, which are binary categorical variables, are estimated using the two-way contingency tables and log linear models (Statistical Consulting Group, ). The Pearson’s chi-square test of independence is used to indicate associations between the variables but this test is inefficient for the multi-way contingency tables. The two-way tables are used for associations between a response and a predictor variable, such as the type of the aircraft with each contributory factor. This analysis can be extended towards the log linear analysis in which three variables are used than two and, all the variables are considered as responses instead of responses and predictor. The natural logarithm of the cell counts of the contingency table is modelled as a linear function of the effects and the interactions of the categorical variables.
Further analysis of the frequency and severity can find factors that are more likely to occur than others, and factors that can increase the likelihood of an AI to occur but without any impact on the safety of the aircraft involved. The assumption, in which the frequency and the severity of an incident are mutually independent, is used to develop mathematical models in the long-standing road safety sector (Lee, J. & Mannering, F., 2002; Lord, D. & Park, P., 2008; Savolainen, Mannering, Lord, & Quddus, 2011; Wang, Quddus, & Ison, 2011). Such models can represent the frequency and the severity of incident either individually or combined. The latter has an advantage over the former when a two-stage model is used for the count-data models. Such approach uses more detailed individual incident data and is able to predict low frequency incidents (Wang et al., 2011). Therefore these models can treat the misidentified or unidentified correlations between the incidents and the severity.
The basic idea of the mathematical models is to split the predictions in two levels (Wang et al., 2011). At the first level the contributory factors are ranked regarding their frequency of occurrence when one, two, three and four factors occur for each incident and the total number of contributors is ignored. At the second level the proportions of incidents are estimated at different severity levels for the safety effect on the aircraft involved and on the Air Traffic Management (ATM) service independently. It is expected that contributory factors that have no or little effect on the frequency model may influence the severity.
For the second level, a discrete choice model, which does not aggregate the incidents but analyse each incident individually, is used. A binary logit model is chosen because of its computational efficiency. The model has a binary dependent variable, follows a binomial distribution and has a logit link function (Ben-Akiva, M. & Lerman, S., 1997). The dependent binary variable has the value of 0 and 1 for no impact on the severity (ESARR class D and E) and major impact (ESARR class A, B and C) respectively (EATM, 1999).
As (5) shows, the likelihood that the safety effect of an incident i will be classified as major or no impact is equal to the proportion of the exponential of the utility for the level of safety effect for the incident i and the summation of the exponential of the utility for each level of safety effect. The utility function of the logit model usually consists of alternative specific and generic parameters and its simplest form is the linear function. The model is calibrated using the maximum likelihood estimation. The Akaike Information Criterion and the Bayesian Information Criterion are used for the goodness-of-fit measures. For further details of the mathematical formulation of the model see. (Ben- Akiva, M. & Lerman, S., 1997).
AIRSPACE INFRINGEMENTS IN NORWAY Avinor Database and Quality Assessment
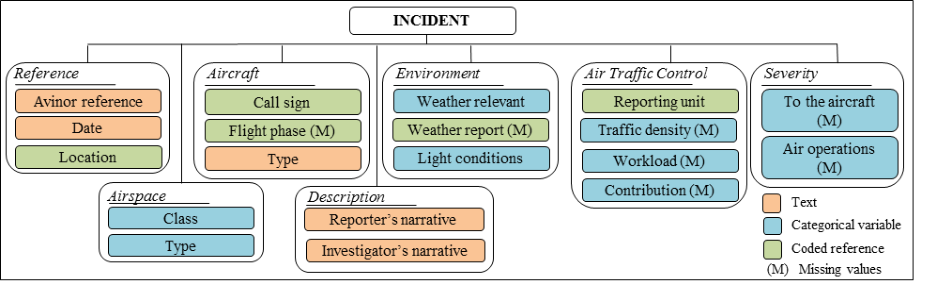
Avinor database consists of 19 fields that can be classified into seven relevant groups based on their definition, as shown in Figure 1. Each group consists of categorical, coded or narrative data fields. For the five-year period from 2008 and 2012, 530 AIs were recorded in the database. The narratives of an incident from the air traffic controller and the incident investigator are used to modify the variables and complete the missing values of any of the variables. For the purpose of the study, new variables were created, which are noted with the letter (N) in
The quality assessment of the safety data, outlined in Section II, supports that the Avinor database can be used for further investigations, with the values for the criteria in excess of 50% except that of the relevance. Low relevance means that there were less variables relevant to the analysis of the AIs than required though the value is close to the 50% threshold, and given the values of the other criteria, this data can be used for further analysis. The values of the criteria are shown in Error: Reference source not found.. The letters (R) and (M) correspond to a variable that already exists in the database and missing information.
Figure 1. Logical arrangement of the data fields of Avinor database
The quality assessment of the safety data, outlined in Section II, supports that the Avinor database can be used for further investigations, with the values for the criteria in excess of 50% except that of the relevance. Low relevance means that there were less variables relevant to the analysis of the AIs than required though the value is close to the 50% threshold, and given the values of the other criteria, this data can be used for further analysis. The values of the criteria are shown in Error: Reference source not found.
Table 1: Avinor database processing Postdata processing Variable topic Original variable variable Incident general information
Table available in the original PDF paper.
Incident reference
Reference number - Location Location Southern/Northern (R) Date Date Month (N) Time Time Light Conditions (R,M) Year Year Year (R) Description By the controller By the controller Narrative (R) By the investigator By the investigator Narrative (R) Aircraft Call sign Call sign - Flight phase Flight phase Flight phase (R,M)
Model Model
Military or Civil aircraft (N) Air Traffic Controller Workload Workload Workload (R,M) Controller's contribution
Light conditions Light conditions (R,M) Airspace Type Type Type (R,M) ICAO class ICAO class ICAO class (R) Traffic density Traffic density Traffic density (R,M) Contributors Contributory factors - Contributory factors (N) Contributor agent - Attributor (N) Category - Category (N) Incident
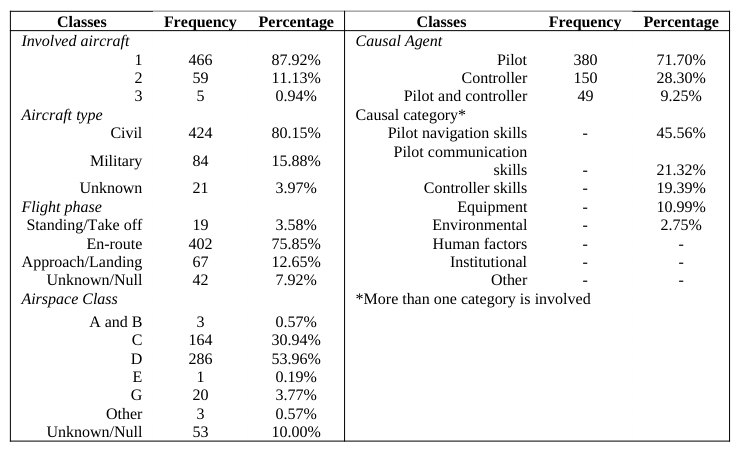
Descriptive Statistics AIs in Norwegian airspace usually involved GA flying in visual flight rules (VFR) at daylight, involving just a single aircraft as shown in . Approximately 75% of the incidents occurred at the en-route flight phase. In terms of airspace, 54% of the aircraft involved infringed Airspace Class D and 31% infringed Airspace Class C. The pilot of the GA aircraft was attributed as the causal agent of the incident in 71% of the AI, with his/her inadequate navigation and communication skills as the biggest contributors to this.
Table 3: Descriptive statistics of AIs in Norway 2008-2012 Classes Frequency Percentage Classes Frequency Percentage Involved aircraft Causal Agent 1 466 87.92% Pilot 380 71.70% 2 59 11.13% Controller 150 28.30% 3 5 0.94% Pilot and controller 49 9.25% Aircraft type Causal category* Civil 424 80.15% Pilot navigation skills - 45.56%
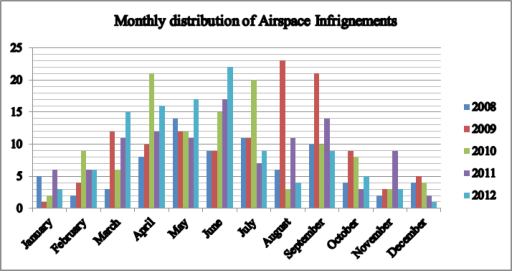
Seasonality AIs occurred when the weather conditions allowed GA pilots to fly, especially in March and April when GA pilots started to fly again following a long period of inactivity during the winter, as shown in Figure 2. Therefore, the period between March and April can be assumed to be the transition period from the inactive season. AIs in winter are almost exclusively due to military activity.
Figure 2. AIs per month
Environmental Conditions Almost all the AIs occurred during daylight. It was impossible to obtain information about the visibility conditions; as such information is not detailed in incident reports.
Location of AIs Approximately 80% of AIs occurred in Southern Norwegian airspace due to the attractive weather conditions for recreational pilots. Particular airspace areas attracted more pilots, such as that adjacent to Bardufoss airport (ENDU) located near to flying schools. Information, such as the VFR traffic distribution, the weather conditions and the quality of the available aeronautical data, can improve the location parameter.
Two-way Radio Contact The time that the two-way radio contact between the pilot and the controller was established was examined following the recommendation of the study of EUROCONTROL (EATM, 2008). For 60% of the incidents, no radio contact was established and, for approximately 25% of the incidents, either the pilot or the controller established contact after the aircraft entered controlled airspace. For approximately 11% of the incidents, the pilot requested a clearance but the pilot entered the controlled airspace either under conditions that did not meet the clearance requirements or after the controller refused so.
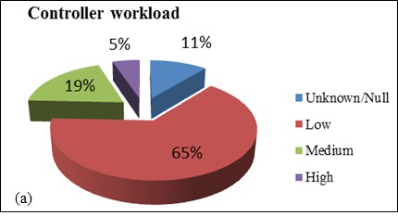
Controller Workload and Traffic Density Considering the subjective terms of the controller workload and traffic density of the sector, about 70% of the incidents occurred at low traffic density of the infringed sector and about 65% of the incidents occurred at low controller workload as Figure 3 shows. About 50% of the unknown values corresponded to incidents in 2012 and this is an area of incident reporting that requires considerable improvement.
Figure 3. (a) Controller workload and (b) traffic density
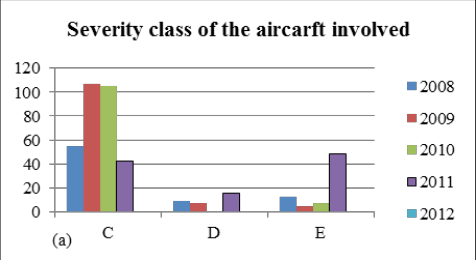
Severity Classification The severity assessment of the incidents changed in 2012 because the provided data were inappropriate to assess the potential that an incident had to the safety effect on the aircraft involved. For the purposes of this study, the severity of the flight is analysed only for the period between 2008 and 2011. As shown in Figure 4, the incidents were more likely to be classified as ESARR class C for the impact on the safety of the flight whereas 95% of the incidents had no impact on safety of the ATM in 2012 (EATM, 1999).
Figure 4. Severity classification (a) of the aircraft involved and (b) the ATM service
CONTRIBUTORY FACTORS Taxonomy of Contributory Factors
The contributory factors that are obtained from the four taxonomies and the safety data of Norway are classified into the following thirteen categories.
i. Aeronautical information, ii. Airspace design, iii. Air traffic management infrastructure, iv. Communication skills of the pilot, v. Environment, vi. Equipment, vii. Human factors, viii. Navigation skills of the pilot, ix. Organizational factors, x. Procedures, xi. Regulation, xii. Skills of the controller and, xiii. Training of the pilot.
The differences between the taxonomies developed from the literature review and the Norwegian data highlight the diversity of reporting of such AI incidents between nations as well as the differences between incident analysis and pilot interviews. Factors that were found important in the previous studies, such as the quality of the flight plan, were identified in the safety data. It was also possible to distinguish the inadequate knowledge of navigation into three factors: inadequate knowledge of the airspace structure, of airspace procedures and, of airspace boundaries. On the other hand, factors related to the skills and behaviour of the pilot were unobserved, reflecting the ANSP nature of the database.
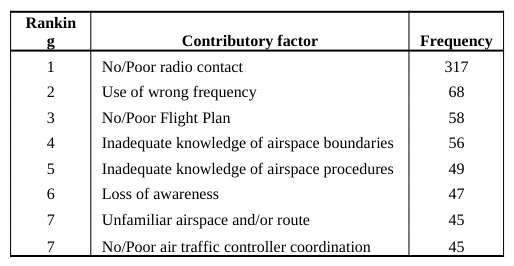
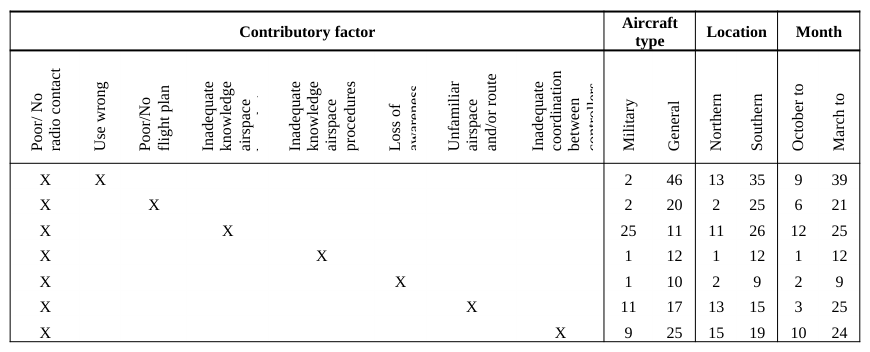
Ranking of Contributory Factors The contributory factors were ranked individually and in pairs, independently of the total number of factors of each incident, given the relatively low frequency of occurrence of each factor. As Table 4 indicates, the most frequent factor was found to be the lack of radio contact between the pilot and the controller, followed by the use of the wrong frequency by the pilot, which was four times less than the first contributory factor. Almost all the factors mentioned had a pilot cause. In situations in which GA was involved, the aircraft flew in the southern Norwegian airspace or the aircraft flew between October and March, as Error: Reference source not foundERROR: REFERENCE SOURCE NOT FOUND shows. In considering pairs of contributors, the pair ‘no/poor lack of radio contact’ and ‘the use of wrong radio frequency’ was ranked first. When an aircraft flew in the northern airspace of Norway, the most frequent pair of contributors was ‘the no/poor radio contact’ and ‘the inadequate coordination between the controllers’.
Table 4: Ranking of Single Contributory Factors Rankin g Contributory factor FrequencyTable 5: Ranking of Pairs of Contributory Factors Contributory factor Aircraft type Location Month
Associations Between Contributory Factors Associations between the categorical variables of the safety data were investigated using the cross tabulation method and the log linear analysis for two and more than two categorical variables respectively. For this study, the tests were run by the Statistical package IBM SPSS Statistics 19.0 and in certain cases variables had to be combined under logical arrangements because of the low expected frequencies. For example, the two categorical variables, which described the attributors of an incident, were replaced by the binary variable that indicates if the pilot is involved or not in the incident.
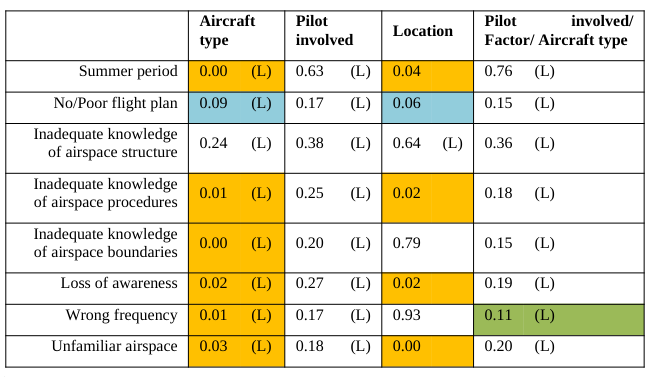
Table 6 shows the results of selected important associations of the factors are statistically significant at the 95% and 90% level of confidence, indicating the Pearson’s value of the test and those associations where the expected cell frequency is below five. The results of the statistical models indicate that more factors are statistically associated with the type of the aircraft than the involvement of the pilot in the incident, highlighting the differences between GA and military. The location of the incident is statistically associated with many factors including the navigation and communication skills of the pilots, such as the quality of the flight plan, the wrong choice of radio frequency and the loss of situational awareness.
Table 6: Associations of Variables at 95% (orange), 90% (blue) and 90% (green for partial associations) level of confidence
Severity Models Two models were calibrated to estimate the severity of the effect on the safe operation of the aircraft involved and, the severity of the effect on the ability to provide safe ATM service using binary logistic regression models. The dependent binary variables are the ‘Severity of aircraft’ and ‘Severity of ATM’ respectively. For consistent severity classification, safety data between 2008 and 2011 were used and involved 420 incidents.
The severity model for the aircraft, as Table 7 shows, had three degrees of freedom. The severity of an incident is more likely to be classified as class A, B or C when the pilot is involved, flies in the southern airspace during summer and he/she has inadequate knowledge of airspace procedures. From these factors, the pilot involvement has the largest effect.
The severity model for the ATM service, as Table 8 outlines, has two degrees of freedom. The severity is more likely to be classified as A, B or C for the following situations: when the flight plan is poor or does not exist, the incident occurs during the summer period and the pilot is not in radio contact with the controller. This model shows the importance of the flight plan and of the radio communication to ensure a safe ATM service.
Table 7: Binary Logit Model – Severity of the Aircraft Parameter Value Odds Significance
Intercept -0.788 0.455 0.036 Pilot is involved 1.588 4.893 0.004 Summer period 0.321 1.379 0.321 Location of incident (South) 0.738 2.092 0.007 Inadequate knowledge of airspace procedures -0.662 0.516 0.095 Likelihood ratio chi square 19.45 Log likelihood -16.819 Akaike’s information criterion 43.637 Bayesian Information Criterion 63.838 Degrees of freedom 3 Significance 0.001 Level of confidence 95%
Table 8: Binary Logit Model – Severity of the ATM Parameter Value Odds Significance
Table available in the original PDF paper.
Intercept -1.984 0.137 0 Summer period 0.925 1.572 0.43 Poor/No flight plan 0.925 2.522 0.082 Poor/No radio contact -0.428 1.535 0.233 Likelihood ratio chi square 7.529 Log likelihood -8.569
Akaike’s information criterion 23.13 9 Bayesian Information Criterion 35.19 5
Degrees of freedom 2 Significance 0.023 Level of confidence 95%
DISCUSSION
The results show that the contributory factors that are found from safety data can be statistically analysed only when the safety data are assessed as a high level of data quality as measured by the criteria of using the criteria of accessibility, consistency, completeness and relevance. Apart from the development of the taxonomy of the contributory factors of AIs, the high quality of the data enabled relationships between contributory factors to be determined and ranked as well as developing severity models. The incident data has room for improvement in that more relevant factors, such as the altitude of the aircraft, should be collected.
Differences between taxonomies in the literature review and that developed with the safety data are directly related to the content of the narratives of the controllers. The developed taxonomy mainly included factors related to the navigation and communication skills of the pilots, which were also found in the second study of the EUROCONTROL; however, the factors were not identical. For example, the factor “Inadequate knowledge of airspace boundaries” could only be identified in the Avinor data. This study also succeeded in confirming the importance of the quality of the flight plan, which was recognised by the GA pilots in the studies of EUROCONTROL. In the absence of a flight plan or for a poor quality plan, the analysis suggested a negative impact on the safety of the ATM service and it may have been related to the location of the incident. Another important factor was also identified in the analysis; if the radio contact was not established or was poor, which ranked as the most frequent factor, the incident was more likely to have an adverse impact on safety.
The new approach of safety analysis of AIs allowed exploring other key parameters, such as the seasonality of flying and the location of the incident. Investigation into the month when the incidents occurred indicated that GA pilots were more likely to infringe controlled airspace during the summer months, which had a negative impact on safety effect as indicated by the severity models. The location of the incident was also important; with the southern Norwegian airspace more likely to have major and significant incidents. These results can be significantly important to the Norwegian ANSP in that Avinor can focus on flying clubs located in particular geographical areas of southern Norway at the start of the flying season to remind GA pilots about the procedures that they must follow. Last but not least, the ANSP can use the results to assess how pilots that fly near to the boundary of controlled airspace can be influenced by the use of new VFR flight planning and navigation software, such as the SkyDemon.
CONCLUSIONS
Current incident reporting schemes across Europe can be modified to collect more relevant, consistent, complete and accessible data. Avinor possesses a high quality database of incidents for the analysis of AIs, which is consequently used in this paper. The mathematical analysis methodology of such data can identify the most significant areas that should be further examined by the ANSP. It should be noted that the analysis focused on the Norwegian airspace, and therefore, the results of this paper cannot be generalised in the European level. However, the methodology would be applicable to any nation that possesses such a high quality database. Further research should focus on a better understanding of the GA pilots’ factors, and on using a methodology of interviews and observations to obtain such factors.
ACKNOWLEDGMENT
The authors are grateful to the Lloyds Registered Foundation for sponsoring this research and Avinor for providing the data and advice through the research.
REFERENCES
Ben-Akiva, M. & Lerman, S. (1997). Discrete choice analysis, theory and application to travel demand. Massachusetts, USA: MIT Press. Dupuy, M. (2012). Framework for the analysis of separation-related incidents in aviation. (Doctor of Philosophy, University of
London and Imperial College). EATM. (1999). Severity classification scheme for safety occurrences in ATM. ().EUROCONTROL. EATM. (2007a). Airspace infringement initiative risk analysis part I, Safety analysis of airspace infringements in europe. ( No.
07/11/29-48).EUROCONTROL. EATM. (2007b). Airspace infringement risk analysis part II, general aviation airspace, infringement survey, analysis of pilotreported causal factors and prevention measures, . ( No. 08/01/07-01).EUROCONTROL. EATM. (2008). Airspace infringement risk analysis part III, case study switzerland. ( No. 08/01/16-04).EUROCONTROL. Hunter, D. R., Martinussen, M., Wiggins, M., & O’Hare, D. (2011). Situational and personal characteristics associated with
adverse weather encounters by pilots. Accident Analysis & Prevention, 43(1), 176-186. doi:http://dx.doi.org/10.1016/j.aap.2010.08.007 Lee, J. & Mannering, F. (2002). Impact of roadside features on the frequency and severity of run-off-roadway accidents: An empirical analysis.(34), 149. Lord, D. & Park, P. (2008). Find the title. Accident Analysis and Prevention, (40), 1441. Safety Regulation Commission. (2012). Annual safety report 2011. ().EUROCONTROL. Safety Regulation Group. (2003). On track – A confidential airspace infringement project. ( No. CAA Paper 2003/2005).CAA
UK. Savolainen, P., Mannering, F., Lord, D., & Quddus, M. (2011). The statistical analysis of highway crash-injury severities: A review and assessment of methodological alternatives. Accident Analysis and Prevention, 43(5), 1666. Statistical Consulting Group.Regression models with count data. UCLA academic technology services. Retrieved from
http://www.ats.ucla.edu/stat/stata/seminars/count_presentation/count.htm Wang, C., Quddus, M., & Ison, S. (2011). Predicting accident frequency at their severity levels and its application in site ranking using a two-stage mixed multivariate model. Accident Analysis & Prevention, 43(6), 1979. Wiegmann, D., Shappel, S., Boquet, A., Detwiler, C., Holcomb, K., & Faabord, T. (2005). Human error and general aviation
accidents: A comprehensive, fine-geained analysis using HFACS - final technical report. ( No. AHFD-05-08/FAA-05-03). University of Illinois: Aviation Human factors dividion Institute of Aviation.
LISTED IN THE AHFE DIGITAL BOOKSTORE CATALOGUE
Explore the complete digital volume
Advances in Human Aspects of Transportation: Part I
Read this individual research paper free through the original publisher, or explore the full digital proceedings book.
ISBN 978-1-4951-2097-8
Explore this ISBN in the AHFE Bookstore ↗Listed in the July 2026 bookstore catalogue; search by ISBN to confirm current availability · Digital book purchase optional