Sanna Pampel, Samantha Jamson, Daryl Hibberd, Yvonne Barnard (2019). Mental Models of Eco-Driving: Comparison of Driving Styles in a Simulator. In: Advances in Cognitive Engineering and Neuroergonomics. AHFE Open Access, vol. 7. https://doi.org/10.54941/ahfe100236
Passenger cars contribute 12% of the overall carbon dioxide emissions in the EU. Eco-driving skills such as avoiding excessive braking and accelerating could reduce passenger car fuel consumption by up to 10% and consequently reduce vehicular emissions. However, educational material and the prospect of saving a considerable amount of money in the long-term do not change the behaviour of the majority of drivers. Little is known about drivers' current understanding of eco-driving, how they make decisions to put this knowledge into practice and what motivates them to do so. For this research drivers’ knowledge, behavioural rules and skill were tested in an experiment. Sixteen participants drove the University of Leeds desktop driving simulator on a varied road layout. Each participant was asked to drive four times, having had different instructions. These instructions were ‘Drive normally’ for the first and the last run; ‘Drive safely’ and ‘Drive fuel-efficiently’ in the remaining two. Each time they were presented with an urban setting with traffic lights as well as with busy traffic on a motorway. By finding out more about drivers' mental models of eco-driving and how they put them into practice, it will be possible to design more targeted and effective support systems.
The EU has managed to decrease overall carbon dioxide emissions in most sectors, but for road transport these emissions have been rising continuously . Eco-driving may be a way to dampen these effects, as it promises to reduce fuel consumption and therefore carbon dioxide emissions by 5 to 10% , without even taking technological advancements such as hybrid engines into account. In order to achieve a considerable reduction in emissions, the behaviour of a large share of drivers needs to be changed. This large-scale behavioural change cannot be achieved by educational material alone . Recent research also suggests that monetary savings may not be a sufficient motivator for people to take on the effort of practising a new driving style . However, in-vehicle technology has the potential of attaining some behavioural change by providing continuous real-time feedback on parameters such as pedal pressure, gear or miles per gallon . There is still a need to research drivers' actual knowledge and skills of eco- driving as well as the decision making processes that lead drivers to practise and use eco-driving techniques . In this study the concept of mental models is utilised. Mental models are defined as representations of reality in people’s minds . These mental models make decisions about actions and perceptions . They are organised on different cognitive levels and therefore range from strategic and easily accessible knowledge to highly automated action sequences . This research aims to identify the mental models regular drivers have of eco-driving by measuring Cognitive Engineering and Neuroergonomics (2019) behavioural changes when they have been asked to drive eco-friendly. Specifically, longitudinal driving behaviour, which includes accelerating, braking and coasting, is examined.
ECO-DRIVING AND ITS SUPPORT SYSTEMS Effective Eco-Driving Techniques
In this study eco-driving focusses on ways, drivers of conventional passenger cars can save fuel, rather than decrease emissions . Hof et al. summarised a number of effective eco-driving practises. In their wider scope, they include regular services, tyre pressure checks and an optimal route choice. When the vehicle and route are given, eco- driving is about maintaining a constant speed, avoiding braking and accelerating where possible by anticipating traffic situations, using higher gears and optimal acceleration. To date there has been little agreement on the optimal strategy to utilise acceleration and speed for fuel saving purposes. Mensing et al. modelled normal and eco-driving and showed a 34% reduction of fuel consumption when eco-driving with fast acceleration to optimal speeds, which are then maintained as much as possible. The concentration on an optimal speed can be very unsafe, though, due to a possible compromise on safety distances to preceding vehicles. Others support smooth acceleration for eco-driving, for example by pushing the accelerator pedal not more than 50% .
Eco-Driving Support Systems On the market there are a number of different eco-driving support systems (EDSS), including pre-trip route planning systems, in-trip systems with visual, haptic and audio feedback, as well as post-trip systems which inform about past eco-driving performance and motivate with scores . In an experiment by Nouvelière et al. drivers with a visual EDSS giving feedback on speed and gears could improve fuel efficiency between 1.6% and 12.9%, compared to driving with eco-driving instructions only. Tulusan et al. show that drivers of business cars using an eco-drive application for mobile phones in an experiment reduced their fuel consumption by 3.23%, even though they did not receive any tangible incentives. There is little agreement if money savings are an effective motivator to drive fuel- efficiently. In a large-scale survey Man et al. found that information about money savings are the biggest motivator for drivers to change their behaviour, followed by information about fuel consumption. Information about the impact on the environment was least motivating. In contrast, Stillwater and Kurani suggest that these financial savings are not motivating actual behaviour changes. Participants in their qualitative study using feedback devices in hybrid cars found cost related feedback simply informative, with a few being surprised by the cheapness of a trip with a hybrid vehicle. Information about miles per gallons coupled with personalised goals had a much stronger effect on eco- driving. It seems that money is initially a high motivator and is mentioned in people’s intentions and plans . However, when it comes to driving with feedback devices the goal to achieve a low miles-per-gallon (mpg) measure seems to be a stronger actual motivator for behavioural change for many drivers . This work aims to improve drivers’ learning of eco-driving by improving the role of information and feedback. Ideally, EDSS tap into gaps in the drivers' knowledge and skills to maximize their effects.
FRAMEWORK FOR MENTAL MODELS OF ECO-DRIVING Mental models are defined as representations of reality and direct people’s perceptions and actions . Mental models originate from the fields of education , robotic and user-friendly design . They are also utilised in research to assess people’s knowledge and skills . They are especially useful for exploring cognitive processes that people are unable to access with introspection .
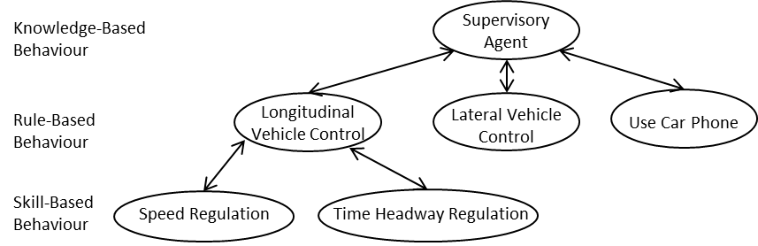
Figure 1. Communication and Control with a Society of Mental Models, adapted from Goodrich and
Boer
Figure 1 depicts the way mental models work during driving. On the knowledge-based level the mental models select the strategy. They then supervise the mental models below, which can include the rules for controlling the vehicle longitudinally or laterally, but also for using a car phone. In the example of eco-driving, drivers could choose to generally accelerate slowly to an efficient speed and plan to avoid braking as much as possible to save fuel. The rule-based mental models select which skill-based mental models are activated, hence which actions are consequently executed, and which skill-based mental models receive attentional resources. Using perceptual input fed back from the skill level, the rule-based mental models then refine their decisions and control further actions . As an example, with perceptual information about traffic lights or the headway to a car in front, the mental model for longitudinal vehicle control on the rule-based level makes the instant decision, if cruising is acceptable or if a braking action needs to be initiated. On the skill-based level the eventual braking action is executed.
In an experiment by Waters and Laker a convenience sample were asked to drive normally, as they would every day, and then in an eco-friendly manner around a specified course. The eco-driving session improved the average fuel efficiency by around 8%. This was achieved with slower speeds and higher gears. This result indicates that drivers have mental models of eco-driving that could be brought to use by prompting them.
Rationale and Hypotheses In this study mental models of eco-driving are measured in more detail. It measures eco-driving behaviour on the knowledge-, rule- and skill-based levels and compares it to normal, which is the baseline condition, and safe driving behaviour. The hypotheses listed in the table below are tested in this study. They are based on the assumption that drivers behave differently once they are asked to eco-drive, but not on proven techniques to reduce fuel consumption, as drivers could have ineffective mental models of eco-driving. On the knowledge level drivers select the eco-driving strategy. They may decide to apply swift acceleration to efficient speeds , which are then kept as constant as possible by avoiding braking as much as reasonably possible. They may also decide to accelerate as smoothly as possible , apply more engine braking and drive at lower speeds . On the rule level the driver switches between cruising and braking, for example, or between free driving on the motorway and actively following a car in front. On the skill level the required action, such as braking, is executed:
Hypotheses on the Knowledge Level:
Hypotheses on the Rule Level: Braking from cruising speed (speed limit of 40 mph) to standing
Hypotheses on the Skill Level:
Hypotheses for Between-Subject Factors:
1. There are no significant interaction effects for gender.
2. There are no significant interaction effects for the order of instructions. Cognitive Engineering and Neuroergonomics (2019)
METHODOLOGY
Participants A group of 16 drivers, between 26 and 43 years old (mean age 33.8 years, SD 5.7 years), 8 of them male (mean age 37.0) and 8 of them female (mean age 30.6), was recruited and participated in a price draw of three times £20. Every participant had to drive at least 5000 miles per year (mean annual mileage was 8750 miles), and held a driver’s license for at least two years (mean driving experience was 13.3 years). The participants entered a prize draw with three cash prizes of £20.
Simulator and Materials The experiment was conducted with a desktop version (‘Baby Sim’) of the University of Leeds Driving Simulator (UoLDS). For steering a Logitech G27 Racing Wheel was used. On the floor were accelerator, brake and clutch pedals, but the clutch was not in use for this experiment. Placed on the desk was a monitor, a Samsung 400MX2 (40 inch size, resolution 1920 x 1080) with a vertical field of view of 45 degrees and a horizontal field of view of 80 degrees. The computer was equipped with a 2.67GHz Xeon W3520 quad core CPU and an ATI Radeon HD 5800 graphics card. A sound system with a speaker mimics the sound of the participant vehicle’s engine and other driving noises.
Data were collected at 60 Hz and included data inferred from the driver’s inputs, such as steering wheel angle, brake pedal pressure and accelerator pedal angle, data describing the movement and position of the vehicle in the form of speed, acceleration and deceleration. Data related to other vehicles on the simulated roads included time to collision with and time headway to a preceding vehicle.
Driving Scenarios A varied test layout was created with an urban and a busy motorway section. The urban section consisted of a road with one lane in each direction, no traffic in the participant’s lane and several junctions. The speed limit was set at 40 mph. Braking was defined as driving on a street with the speed limit of 40 mph and then bringing the vehicle to a stop at a red traffic light. Accelerating was defined as being stationary in front of a red traffic light that switched to green and being allowed to accelerate to the same speed limit. Cruising involved cruising scenario without any traffic lights. The figures below illustrate the measurement points. The acceleration scenario begins when the traffic lights at the junction turn green and ends 364 metres after the junction. The braking scenario begins 364 metres before the junction and ends when the traffic lights turn green. The cruising scenario consists of rad sections with light curves, 252 metres long. These scenarios occur several times in each urban section. The motorway section consisted of three lanes in each direction and busy traffic driving slightly slower than the speed limit of 70 mph allowed. Here the participants were required to drive into the middle lane and remain there for the duration of the scenario.
Acceleration Scenario:
Figure 1: Urban junction with lights turning from red to green
Braking Scenario:
Figure 2: Approaching a junction with red traffic lights
Cruising Scenario:
Figure 3: Urban, slightly curvy road without junction
Motorway Scenario:
Figure 4: Motorway with busy traffic
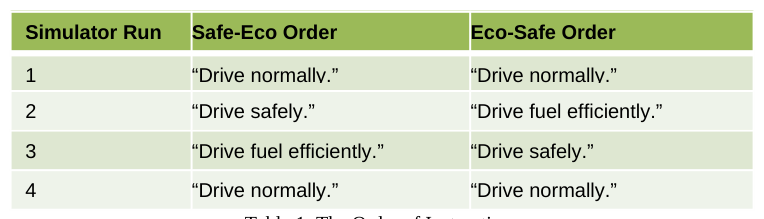
Design and Procedure A two-way (4x2x2) repeated measures mixed design was employed, with Instructions as a within-subjects factor with 4 levels (‘normal(1)’, ‘safe’, ‘eco’, and ‘normal(2)’). The between-subject factors were Gender and the Order of the Instructions. The participants got the Order randomly assigned. Eight participants were asked to perform the experimental runs in the Safe-Eco Order, which positions the ‘safe’ before the ‘eco’ run. The other eight participants received the Instructions in the Eco-Safe Order with the ‘eco’ before the ‘safe’ run. During recruiting the participants were told that the study is about ‘driving styles’, without mentioning the eco-driving focus, to prevent the participants preparing for the study.
Table 1: The Order of Instructions
The participants were briefed and asked to sign a consent form and then performed a test run on an urban road leading into a rural road to become familiar with the desktop driving simulator. For the experimental runs, each participant was asked to drive through a set of an urban section and a motorway section four times, according to the assigned Order. The first and the last run were normal runs to measure people’s everyday driving behaviour as well as to evaluate practice or boredom effects. No further explanations, for example what ‘fuel-efficient’ means, were provided with the instructions. After all runs were completed, a debriefing took place, where the purpose of the study was explained to the participants.
Analysis Each of the 16 participants performed 4 sets of runs, containing urban and motorway sections. The urban sections were further separated into situations requiring braking, accelerating and cruising behaviour, as specified in the scenario descriptions above. The motorway sections were stripped of cut-in events in front of the participant vehicle, so the analysis of the motorway sections was limited to data where the participant was following a car that was driving at a steady speed. For dependent variables such as speed, positive and negative acceleration as well as time headway, average and standard deviation were calculated for each scenario, where applicable. Maxima or minima were extracted for variables such as brake pedal pressure, accelerator pedal angle and headway distance. These values were subjected to the Kolmogorov-Smirnov test as well as the Levene’s test. Depending on the results either a repeated measures ANOVA with post hoc Bonferroni-corrected pairwise comparisons was performed or the experimental conditions were compared using the Wilcoxon signed-rank test with Bonferroni-corrected thresholds. For the ANOVA the sphericity was tested and, if applicable, the Greenhouse-Geisser correction was applied. Between-samples tests dividing the participants by gender or the sequence of instructions were conducted with the ANOVA or the Mann-Whitney U test.
RESULTS
Overview of Supported Hypotheses: Acceleration Scenario The maximum accelerator pedal angle is lower for eco-driving compared to normal driving.
Acceleration Scenario
The acceleration scenario occurred once in half of the runs and twice in the other half. The analysis was conducted with the first occurrences only, which resulted in a total of 107.444 data points, or data of around 30 of driving.
There was a main effect of Instruction on the maximum accelerator angle, [F(3,36) = 6.314, p = .001, partial eta squared = .345]. Post-hoc comparisons revealed that the maximum accelerator angle for the eco runs (mean = 27.31°, SE = 2.28°) was significantly lower than for the normal 1 runs (mean = 48.75°, SE = 5.45°). The related- samples Wilcoxon signed-rank test shows a significant difference between normal 2 (mean = 47.06°, SE = 5.92°) and eco (p = .001). There was a main effect of Instruction on the standard deviation of positive acceleration, [F(3,36) = 4.466, p = .009, partial eta squared = .271]. Post-hoc Bonferroni-corrected t-tests show that it is due to a lower standard deviation during eco-driving (mean = .70 m/s2, SE = .049 m/s2) than for the safe runs (mean = .91 m/s2, SE = .051 m/s2). There was no main effect on average positive acceleration.
Braking Scenario The analysis was conducted with the combined data of two occurrences of the braking scenario in each run, which resulted in altogether 366.699 data points, equivalent to data of around 102 minutes of driving including the waiting time at the junction.
There was a main effect of Instruction on average negative acceleration, [F(1.748,20.970) = 9.086, p = .002, partial eta squared = .431]. Post-hoc analysis showed that for the eco-driving run (mean = -.56 m/s2, SE = .034 m/s2) the absolute value of the average negative acceleration was significantly lower than for every other condition (normal 1: mean = -.72 m/s2, SE = .031 m/s2, safe: mean = -.67 m/s2, SE = .041 m/s2, normal 2: mean = -.72 m/s2, SE = .054 m/s2). There were neither main effects of Instruction on the standard deviation of negative acceleration nor on average speed at braking initiation.
The between-subjects test in the ANOVA showed that women (mean = 157.00N, SE = 12.56N) had a higher maximum brake pressure than men [mean = 105.69N, SE = 12.56N, F(1,12) = 6.378, p = .027, r = .347]. An independent-sampled t-test attributed these differences to the safe (p = .019) and the eco (p = .022) runs. There are no significant interactions effects between Instruction and Gender.
Cruising Scenario The cruising scenarios provided between 9.642 and 13.508 data points for each run, summing up to a total of 713.823 data points, equivalent to around 198 minutes of driving.
There was a main effect of Instruction on average speed, [F(3,36) = 18.038, p = .000, partial eta squared = .601]. Post-hoc Bonferroni-corrected analysis showed that for the eco-driving (mean = 37.13mph, SE = .49mph) run the average speed was significantly slower than for all other conditions (normal 1: mean = 39.89mph, SE = 0.40mph, safe: mean = 39.24mph, SE = .54mph, normal 2: mean = 40.13mph, SE = .56mph). Furthermore, there was a main effect of Instruction on the standard deviation of positive acceleration, [F(3,36) = 7.941, p = .000, partial eta squared = .398]. Post-hoc comparisons show that it is due to a lower standard deviation of positive acceleration during eco- driving (mean = .28 m/s2, SE = .016 m/s2) than for the normal 1 (mean = .39 m/s2, SE = .023 m/s2) and safe (mean = .36 m/s2, SE = .018 m/s2) runs. The Wilcoxon signed-rank test revealed the significance of the difference between the eco and the normal 2 runs (mean = .41, SE = .029, p = .001). There was no main effect on standard deviation of speed.
Motorway Scenario After being stripped of cutting-in events, the motorway scenarios provide a total of 1.134.094 data points, which constitute around 315 minutes of driving.
A repeated measures ANOVA was showing a main effect of Instruction [F(3,36) = 10.891, p = .000, partial eta squared = .476]. Post-hoc Bonferroni-corrected t-tests revealed that it was due to a lower standard deviation of positive acceleration during eco-driving (mean = .25 m/s2, SE = .026 m/s2) compared to the normal runs (normal 1: mean = .39 m/s2, SE = .028 m/s2, normal 2: mean = .35 m/s2, SE = .021 m/s2). Comparisons with the Wilcoxon signed-rank test show that the standard deviation of negative acceleration is higher for the normal 1 run (mean = -.30 m/s2, SE = .078 m/s2) than for the eco (mean = -.15 m/s2, SE = .025 m/s2, p = .010) run. There were no main effects on standard deviation of speed and no significant differences between standard deviation of time headway to other runs.
According to independent-samples Mann-Whitney U tests the standard deviation of negative acceleration in the eco runs is significantly higher for women (M = -.19 m/s2, SE = .046 m/s2) than for men (M = -.11 m/s2, SE = .008 m/s2, p = .015). There was no significant interaction effect between Instruction and gender.
DISCUSSION
In a driving simulator experiment drivers were asked to eco-drive and their subsequent behaviours were measured and compared to normal runs as well as to a run where the drivers were asked to drive safely.
Knowledge: The results indicate that the participants changed their behaviour when they were asked to eco-drive. In many cases this behaviour was not just different from the normal runs, but also from what they did when asked to drive safely. Hence, the behaviour change in the eco runs cannot only be explained by an allocation of more attentional resources to the driving task, but by applying some eco-driving knowledge. Participants were not applying the well-known strategy of quick acceleration to efficient speeds that are then kept as constant as possible. Instead, the participants tended to accelerate and decelerate smoother than during normal driving. It could not be established that a constant speed was kept during eco-driving, but the average speed was slower than during normal and safe driving.
Rules: It was expected that the participants would apply rules derived from the expected eco-driving strategy. These rules cover the speed at braking initiation when approaching red traffic lights as well as, in the case of a busy motorway, the own speed and the time headway to the vehicle in front. Eco-driving could encourage approaching traffic lights with engine braking and keeping the speed constant on a busy motorway and let the headway to the vehicle in front fluctuate more than during other driving styles. Nevertheless, no consistent behaviour of this kind could be measured. This could indicate that many drivers do not have consistent eco-driving rules to follow.
Skills: Asking the participants to eco-drive resulted in smoother pedal actions. The positive acceleration after traffic lights turned green is less erratic for eco than for safe driving. For braking at a junction with red traffic lights, there was no such effect. During driving on the junction-free urban roads and on the motorway the accelerations were executed in smoother movements compared to normal driving.
Between-Subject Effects: The analysis provided some effects for Gender on maximum brake pressure and standard deviation of negative acceleration. However, the relevance of these effects should not be overestimated, as similar effects have not been found in the literature. They could be related to difficulties some participants had with the pedals of the simulator. Furthermore, these gender differences that are isolated to brake pedal use and deceleration are in conflict with a study by Graving et al. , who found that, with the simple verbal prompt to drive as fuel efficiently as possible, women improved their fuel efficiency, while men only effectively changed their behaviour with a visual feedback system.
The absence of significant between-subjects effects for Order indicates that whether there was a safe run before the eco run had no influence on the dependent variables in the eco run. Only one difference between normal runs could be found, which implies that beside a possible practise effect related to brake pedal use, there were no more significant practise nor boredom effects in the behaviours measured in this study.
General Discussion: The most unexpected finding is the slower speed the participants applied during eco-driving, but not during safe driving. In the literature it is agreed that slow driving is considered safe . However, it has been shown before that many drivers associate eco-driving with slow driving . Surprisingly, in experiments where participants used feedback devices, time losses were either low or not present at all . This implies that many drivers wrongly associate eco-driving with slow speeds and therefore time losses. This misconception on the knowledge level may prevent many drivers from giving eco-driving a chance, but it could be addressed with educational information about speeds and driving time as well as feedback on eco-driving performance. Another unexpected finding is the absence of significant results on the rule level. This could mean that many drivers in this experiment did not utilise consistent eco-driving rules and that such rules could be improved with feedback systems.
One limitation of this study is the nature of the desktop simulator. Firstly, its steering wheel and pedals react in an overly sensitive way to small inputs. These could have caused the participants to drive in more erratic ways than they would in real vehicles and therefore compromise the validity of some measurements. Furthermore, without mirrors it was made difficult for the participants to take eventual traffic behind them into account. In addition, the absence of traffic in the participants’ lane in the urban road and the requirement to stay in the middle lane on the motorway are not very realistic. The study served to measure behaviour that has to be validated with a larger sample size and more realistic driving conditions. As the prompt to eco-drive could mean different things to different drivers, a larger study could also be able to identify individual differences. In addition, a fuel consumption model may help evaluating the actual fuel consumption the participants achieved during the different experimental runs.
This work is an attempt to research mental models of drivers and learn more about their cognition when driving. It was able to identify eco-driving on the knowledge and skill levels of the mental model hierarchy. Results of this and further studies will help designers of EDSS to tap into mental models on these different levels for more effective feedback. This may not only lead to cost savings for drivers, but significant reductions in carbon dioxide emissions as well.
CONCLUSIONS
This study has shown that drivers do apply different behaviours when they are asked to eco-drive, although behavioural differences could not be measured on all cognitive levels. Drivers were accelerating and braking in smoother ways, but were driving slower without keeping the speed more constant than in other driving styles. This means that many drivers do have mental models of eco-driving in place, which they usually do not use in their normal, everyday driving. Misconceptions about speed and the absence of eco-driving rules provide potential for more effective EDSS, which tap into different cognitive levels and encourage effective eco-driving behaviour. This study was a step towards understanding the cognition of drivers by measuring mental models on the knowledge- rule- and skill-based levels. Further studies will be necessary to research the eco-driving knowledge in more detail and to validate design implications for EDSS.
REFERENCES
Anderson, J. R. 1982. Acquisition Of Cognitive Skill. Psychological Review, 89, 369-406. Anderson, J. R., Bothell, D., Byrne, M. D., Douglass, S., Lebiere, C. & Qin, Y. 2004. An Integrated Theory Of The Mind. Psychological Review, 111, 1036-1060. Barkenbus, J. N. 2010. Eco-Driving: An Overlooked Climate Change Initiative. Energy Policy, 38, 762-769. Birrell, S. A., Young, M. S. & Weldon, A. M. Delivering Smart Driving Feedback Through A Haptic Pedal. In:
Martin Anderson Fiehf, E. A. C., Ed. Proceedings Of The International Conference On Contemporary Ergonomics And Human Factors 2010, 2010 Keele, Uk. Taylor & Francis, 431-439. Boer, E. R., Hildreth, E. C. & Goodrich, M. A. 1998. A Driver Model Of Attention Management And Task Scheduling: Satisficing Decision Making With Dynamic Mental Models. 17th European Annual Conference On Human Decision Making And Manual Control. Valenciennes, France. Cognitive Engineering and Neuroergonomics (2019)
Boriboonsomsin, K., Vu, A. & Barth, M. 2010. Eco-Driving: Pilot Evaluation Of Driving Behavior Changes Among U.S. Drivers. Delicado, A. 2012. Environmental Education Technologies In A Social Void: The Case Of ‘Greendrive’.
Environmental Education Research, 18, 831-843. European Commission 2007. Communication From The Commission To The Council And The European Parliament 6 Results Of The Review Of The Community Strategy To Reduce Co2 Emissions From Passenger Cars And Light-Commercial Vehicles Brussels: Commission Of The European Communities Goodrich, M. A. & Boer, E. R. 1998. Semiotics And Mental Models: Modeling Automobile Driver Behavior.
Intelligent Control (Isic), 1998. Held Jointly With Ieee International Symposium On Computational Intelligence In Robotics And Automation (Cira), Intelligent Systems And Semiotics (Isas), Proceedings, 1998. Ieee, 771-776. Graving, J. S., Manser, M. P. & Becic, E. Reduction In Fuel Consumption Depends On The Fuel Economy Display And Driver Sex: An Observed Interaction. Adjunct Proceedings Of The Second International Conference On Automotive User Interfaces And Interactive Vehicular Applications (Automotiveui 2010), 2010 Pittsburgh, Pennsylvania, Usa. Harvey, J., Thorpe, N. & Fairchild, R. 2013. Attitudes Towards And Perceptions Of Eco-Driving And The Role Of
Feedback Systems. Ergonomics, 56, 507-521. Hof, T., Conde, L., Garcia, E., Iviglia, A., Jamson, S., Jopson, A., Lai, F., Merat, N., Nyberg, J., Rios, S., Sanchez, D., Schneider, S., Seewald, P., Weerdt, C. V. D., Wijn, R. & Zlocki, A. 2012. D11.1: A State Of The Art Review And User’s Expectations. Ecodriver Project. Johansson, H., Färnlund, J. & Ergström, C. 1999. Impact Of Ecodriving On Emissions And Fuel Consumption: A
Pre-Study. Swedish National Road Administration Report Borlange, Sweden. Johnson-Laird, P. N. 1988. The Computer And The Mind: An Introduction To Cognitive Science, Cambridge, Massachusetts, Harvard University Press. Kim, S. Y. & Kim, Y. S. 2012. A Virtual Driving System For Enhancing Efficient Driving Style. International
Journal Of Multimedia And Ubiquitous Engineering, 7, 291-296. Man, W., Bie, J. & Van Arem, B. User Needs In Green Its: The Result Of A Questionnaire Survey On Dutch And Japanese Drivers. Proceedings 17th Its World Congress 2010-10-25 To 2010-10-29 2010 Busan, South Korea. Martin, E., Chan, N. & Shaheen, S. 2012. How Public Education On Ecodriving Can Reduce Both Fuel Use And
Greenhouse Gas Emissions. Transportation Research Record: Journal Of The Transportation Research Board, 2287, 163-173. Mensing, F., Bideaux, E., Trigui, R., Ribet, J. & Jeanneret, B. 2014. Eco-Driving: An Economic Or Ecologic Driving Style? Transportation Research Part C: Emerging Technologies, 38, 110-121. Mensing, F., Bideaux, E., Trigui, R. & Tattegrain, H. 2013. Trajectory Optimization For Eco-Driving Taking Into
Account Traffic Constraints. Transportation Research Part D: Transport And Environment, 18, 55-61. Morgan, M. G., Fischhoff, B., Bostrom, A. & Atman, C. J. 2002. Risk Communication: A Mental Models Approach, Cambridge, Uk, Cambridge University Press. Norman, D. 1983. Some Observations On Mental Models. In: Gentner, D. & Stevens, A. L. (Eds.) Mental Models.
Hillsdale, New Jersey, Usa: Lawrence Erlbaum Associates Inc. Nouvelière, L., Mammar, S. & Luu, H. T. Energy Saving And Safe Driving Assistance System For Light Vehicles: Experimentation And Analysis. Networking, Sensing And Control (Icnsc), 2012 9th Ieee International Conference On, 11-14 April 2012 2012 Beijing. 346-351. Rasmussen, J. 1983. Skills, Rules, And Knowledge; Signals, Signs, And Symbols, And Other Distinctions In
Human Performance Models. Systems, Man And Cybernetics, Ieee Transactions On, Smc-13, 257-266. Schank, R. C. & Abelson, R. P. 1977. Scripts, Plans, Goals And Understanding: An Inquiry Into Human Knowledge Structures, Hillsdale, Nj, Lawrence Erlbaum Associates. Stillwater, T. & Kurani, K. 2011. Field Test Of Energy Information Feedback. Transportation Research Record:
Journal Of The Transportation Research Board, 2252, 7-15. Stillwater, T. & Kurani, K. S. 2013. Drivers Discuss Ecodriving Feedback: Goal Setting, Framing, And Anchoring Motivate New Behaviors. Transportation Research Part F: Traffic Psychology And Behaviour, 19, 85-96. Taylor, M., Lynam, D., Baruya, A. & Britain, G. 2000. The Effects Of Drivers' Speed On The Frequency Of Road
Accidents, Transport Research Laboratory Crowthorne. Tulusan, J., Staake, T. & Fleisch, E. 2012. Providing Eco-Driving Feedback To Corporate Car Drivers: What Impact Does A Smartphone Application Have On Their Fuel Efficiency? Proceedings Of The 2012 Acm Cognitive Engineering and Neuroergonomics (2019)
Conference On Ubiquitous Computing. Pittsburgh, Pennsylvania: Acm. Van Der Voort, M., Dougherty, M. S. & Van Maarseveen, M. 2001. A Prototype Fuel-Efficiency Support Tool.
Transportation Research Part C: Emerging Technologies, 9, 279-296. Vogt, C. & Schaefer, M. 2012. Seeing Things Differently: Expert And Consumer Mental Models Evaluating Combined Oral Contraceptives. Psychology And Health, 27, 1405-1425. Waters, M. H. L. & Laker, I. B. 1980. Research On Fuel Conservation For Cars. Crowthorne, England: Transport
And Road Research Laboratory.
LISTED IN THE AHFE DIGITAL BOOKSTORE CATALOGUE
Explore the complete digital volume
Advances in Cognitive Engineering and Neuroergonomics
Read this individual research paper free through the original publisher, or explore the full digital proceedings book.
ISBN 978-1-4951-2101-2
Explore this ISBN in the AHFE Bookstore ↗Listed in the July 2026 bookstore catalogue; search by ISBN to confirm current availability · Digital book purchase optional