Roger W. Cholewiak (2019). Do you feel... like I do? Individual Differences and Military Multi-Modal Displays. In: Advances in Cognitive Engineering and Neuroergonomics. AHFE Open Access, vol. 7. https://doi.org/10.54941/ahfe100213
The design and implementation of multi-modal information displays can be affected by individual differences within the target user population. These differences manifest themselves at a number of sensory, perceptual, and cognitive levels. In general, such differences and their ranges are rarely taken into account in system design. Instances of significant differences among “normal” individuals will be considered particularly in the visual, auditory, and tactile sensory modalities. As will be discussed in this review of some of the pertinent literature, there can be substantial variation in sensation, perception, and cognition both within an age group as well as over the age span of the target population. For example, because the ages of military personnel can range over five or six decades, device designers have to account for the fact that levels of sensory sensitivity and acuity deteriorate significantly with age. This paper will survey a number of these individual differences, particularly those that have the potential for complicating the design and general application of informational displays for the military. Subtle variations in individual sensitivity and even perceptual “style” can undermine the “one-size-fits-all” philosophy of display design. These have the potential to affect the utility of the system under battlefield stress conditions.
Early in my career studying cutaneous sensitivity and pattern processing, as I was being introduced to the large body of research concerned with the development of sensory prostheses for individuals with visual or auditory deficits, it became noteworthy that the bulk of the basic research conducted in academic laboratories, was being done with the human “white rat:” That is, the university undergraduate student…. The bulk of Psychological research on sensation (e.g., sensitivity, variations in quality, pattern perception, and so on) involved subjects, participants, observers, who were “volunteers” and of college age – ranging from about 18 to 21 years of age for the undergraduate populations, perhaps up to 26 years with graduate populations included. The data provided by these studies formed the bases for the design of sensory systems and devices to aid or supplement persons with such disabilities. Yet, from the demo- graphic data that was available at that time, the typical user of those systems and devices was a person whose age was typically decades greater than the baseline populations we were studying. When considering military systems, the age of the youngest recruit can be 18 or 19, with a common endpoint of fighter pilot “combat readiness” in the Cognitive Engineering and Neuroergonomics (2019) late 30s, while retirement can be as late as mid 60s… potentially a 50-year age span.
It has been reported that in the working population (ages 21-64), 44% have some level of difficulty seeing, while 64% have hearing problems, and over 2.5 million people are either deaf or blind (McNeil, 1997). Importantly, the proportion of the population of persons who have auditory disabilities increases dramatically for those over the age of 60 (Fozard, 1990), while 88% of visually disabled persons are over the age of 60 (ANSI, 1982; CENSUS, 1991; Gill, 1993). Consequently, taking into account the available information on the changing capabilities of the senses over the age span is of crucial importance, particularly when designing displays either for augmenting or supple- menting remaining sensory capacity, or as a prosthetic to replace a missing sensory system.
Sensory Acuity and Device Design Indeed, Stevens et al. (1996) argue that the reduction in static tactile acuity with age that they measured has serious consequences for blind persons trying to read Braille characters. It is likely that the active movement of the fingers over the cells in normal Braille reading adds a level of richness to the tactile pattern that may compensate for the in- herent mismatch between static stimulus and aging receptive systems (though Phillips & Johnson, 1985, argue that resolution is the same for active and passive exploration). In contrast, once the Tactaid 7, Queens Aid, Optacon, TVSS, or TSAS (all vibrotactile displays), are applied to the body’s surface, one cannot actively explore the display. These have fixed tactor arrays designed for passive reception, usually at a single body site (but see Robbins, et al., 1993, p. 16). In none of these has there been a quantitative measure of their ability to accurately present vibrotactile patterns that have spatial characteristics matching those of the site, nor the effect of age of the user.
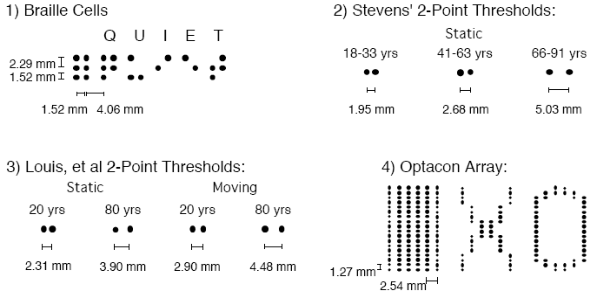
The illustrations in Figure 1 demonstrates some of these complications with regards to two particular displays, men- tioned above. These were designed to provide cutaneous communication for persons with visual disabilities: Braille cells and the Optacon array. The Optacon was an OPtical to TActile CONverter comprised of a small hand-held camera with a 6 x 24 matrix of optical sensors, each of which was connected to miniscule vibrating pins, also ar- ranged in a 6 x 24 array. It was commercially available from 1972 to the mid-1990s, and allowed persons who were blind to feel printed text without reliance on Braille translation by moving the finger-sized camera over a printed page. The pattern of vibrating pins that might occur if the camera was sitting over the printed letters “X” and “O” are illustrated, although the pattern would move over the tactile array as the camera scans the letter. Shown in this Figure are the dimensions of the Optacon vibrotactile array as well as those for the 2 x 3 Braille cell, in relation to human tactile spatial resolution over several age ranges. The Braille dimensions are taken from Nolan and Kederis (1969) while those for the Optacon are from Bliss et al. (1970). Stevens’ data were taken from his 1992 paper, while the static and moving 2-point thresholds were from Louis et al. (1984). Note how the spatial resolution of the skin changes (gets poorer) with age, supporting Stevens et al. (1996) proposition that the usefulness of the display could deteriorate with age.
Figure 1. Comparison of tactile 2-point thresholds over several age spans, compared to the standard displays in two tactile reading aids for persons who have visual disabilities (illustrations approximated). (Cholewiak, 1994).
These changes are simply a consequence of aging, and similar deterioration occurs in all sensory modalities. For ex- ample, because of everyday noise exposure, significant changes in auditory frequency sensitivity begin to occur as early as the late teens and early twenties, the ages of many of our frontline soldiers. In a college classroom demonstration, I often am able to show a 3 kHz variation in sensitivity (from 16-18 kHz) in a small group of similarly-aged students. Vibrotactile sensitivity on the palm or finger at a particular frequency can vary by more than 20 dB (a fac- tor of 10) over this same population of young persons, but this variation increases substantially as one ages. Figure 2 illustrates data collected in the Princeton laboratory on a large number of college-age individuals (with one excep- tion – CS, closed inverted triangles, was 67 years old, and showed the poorest sensitivity in the high range of fre- quencies). Note the remarkable variation in threshold, taken with one of the more precise psychophysical techniques – 3-alternative forced choice adaptive tracking. Each of the data points was the result of a single tracking series that could have had as many as 50-70 trials to criterion.
Figure 2. Vibrotactile thresholds measured on the left index fingertip of 42 observers using the 3-alternative 3- step adaptive tracking method. The fingertip touched a 7-mm contactor through a 9-mm diameter hole, creating a 1-mm surround. The contactor protruded through the hole by 1 mm. From Cholewiak, Sherrick, & Collins (1992).
Figure available in the original PDF paper.
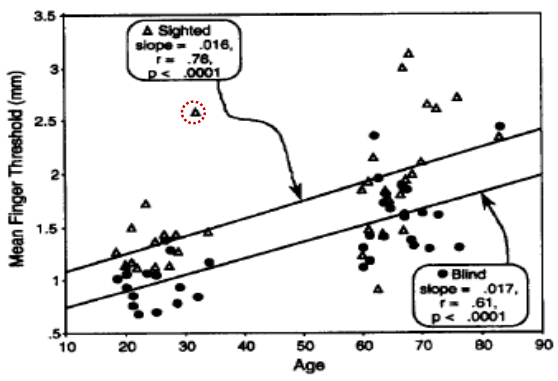
Variability of Sensory Acuity with Age What is most notable is the variation in this otherwise uniform group of students. Yet, as large as this variation ap- pears, within the age group, a consistent finding has been that variability increases with age. Stevens and his col- leagues have studied sensory thresholds for a number of different modalities, and over the life span (Stevens, 1992; Stevens et al., 1995, 1996, 1998). The next illustration (Fig. 3) shows this increase for a measure that combined three measures of tactile acuity: discrimination of 2-point gaps, line orientation, and length.
Figure 3. Means of three fingertip acuity measures as a function of age for sighted (∆) and blind (●) observers. The range for young vs old sighted observers is estimated by the arrows, although there is a clear outlier (circled) in the younger group. Adapted from Stevens et al., 1996.
There are numerous possible reasons for this increase in variability. Note that one of the elderly observers in Figure 3 showed a lower combined threshold than the whole group of younger persons (We have also seen this occur with tactile pattern perception studies in the Princeton laboratory). But the majority performed at poorer levels.
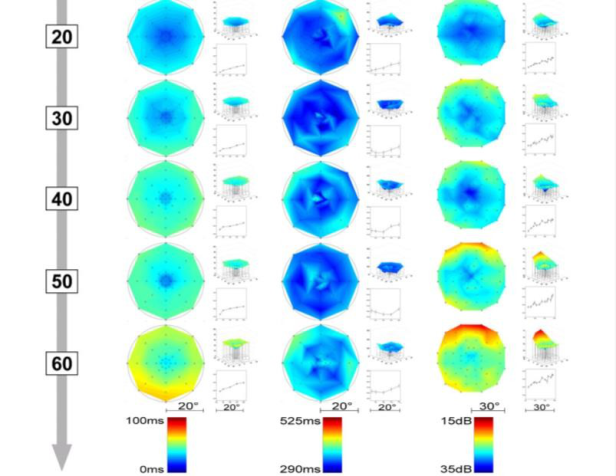
Regardless of the sensory modality, important changes occur in many measures of acuity over the life span. The next figure (Fig. 4) is taken from the work of Poggel, Treutwein, Calmanti, and Strasburger (2012), who took mea- sures of spatial as well as of temporal resolution within the topography of the retina, over the same age range that is of interest to us here. In the figures below (4), responses to stimuli are shown as a function of where they were pre - sented on the surface of the retina. There is an old dictum that says the eye is poorer than the skin which in turn is poorer than the ear when it comes to temporal resolution (the opposite being true for spatial resolution). The eye’s poor ability to resolve temporal stimuli as a function of location on the retina and age is shown for paired flashes of light in the leftmost column, where the foveal (central) superiority is shown over all ages. Reaction time to these flashes, as well as luminance detection threshold intensities are shown in the other two columns.
Age Double Pulse Reaction Perimetry Resolution Time
Figure 4. Topographic mapping of visual spatial-temporal sensitivity as a function of retinal position and age. Cooler colors represent better performance. (Adapted from Poggel, Treutwein, Calmanti, & Strasburger, 2012)
Overall, note that peripheral vision deteriorates for all of these measures, but particularly with perimetry and pulse resolution measures. Even mod- erate amounts of “tunnel vision” are potentially hazardous to pilots, espe- cially if they are wearing the newest Heads-Up Displays that present vast amounts of information in the periphery of their visual field (right).
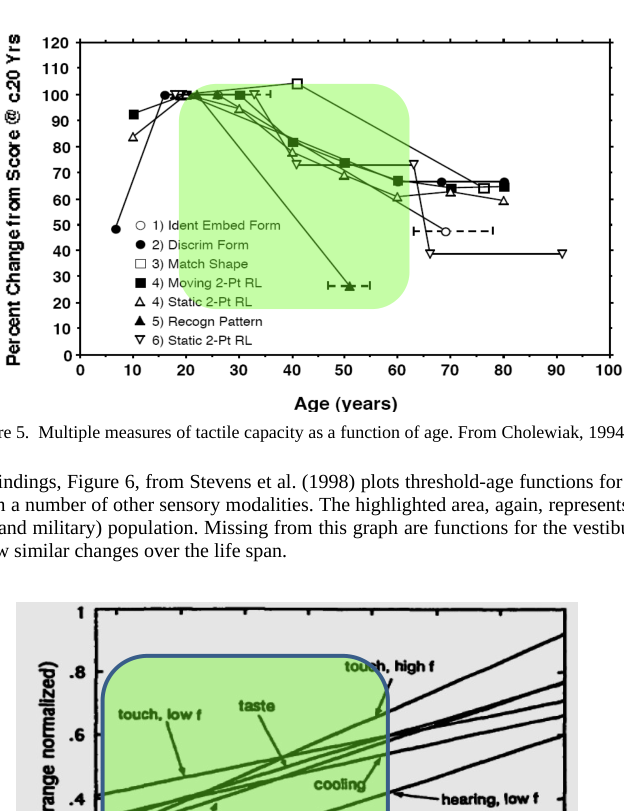
A similar plot of a number of different tactile capabilities is shown in the Figure below (5). In this case, comparisons are made among several mea- sures important in tactile pattern perception. These functions were plotted with reference to participant’s average performance for that particular task at the age of 20 (or as close as the study parameters would allow). Specifically, Axelrod and Cohen’s (1961) data (1) show percent correct identification of tactile embedded figures: The baseline was the 26-year-old group with 63% correct performance. Cote and Schaefer’s (1981) data exploring discrimination of tactile form (2) are plotted with reference to the performance of their 19 year old participants, who had 6 errors in the task. Kleinman and Brodzinsky (1978) examined haptic exploration of shapes where participants had to match alternatives. The baseline data plotted here (3) was for their 19-year-olds who had an average of 2.9 errors. Louis et al. (1984) ex- plored moving and stationary 2-point discrimination (4). Their 20-year-old observers had thresholds of 2.9 mm for the moving condition and 2.3 mm for the static test conditions. Muller, et al. (1992) examined tactile pattern recog- nition (5) in the early stage of primary degenerative dementia compared with normal aging. The baseline here is the proportion of trials with tactile pattern recognition errors for 22-year-olds who had 3.4% of trials with errors. Fi- nally, the data from Stevens (1992) reports stationary 2-point discrimination threshold on the fingertip (6) where the 19 yr olds baseline was 1.95 mm. What is clear from these different measures in a consistent decrement in perfor- mance through the majority of the working-military age range.
Figure 5. Multiple measures of tactile capacity as a function of age. From Cholewiak, 1994: To generalize these findings, Figure 6, from Stevens et al. (1998) plots threshold-age functions for tactile sensitivity along with those from a number of other sensory modalities. The highlighted area, again, represents the age range of the typical working (and military) population. Missing from this graph are functions for the vestibular and orienting senses, but these show similar changes over the life span.
Figure available in the original PDF paper.
Figure 6. Seven aging functions relating thresholds (as z scores) to age, with the working/ military age range highlighted. (Adapted from Stevens, Cruz, Marks, & Lakatos, 1998)
For the most part, these functions show substantial changes that should be accounted for in any man-machine system design. Given the number of different possible progressive health problems that individuals experience, combined with the wide disparity in susceptibility to these problems, it is not surprising that variability in almost any measure of human capability increases with age, despite the general average deterioration that is found in many of these.
But some differences are inborn: there are many documented sex differences in sensory, perceptual, and cognitive measures. For example, whereas visual reaction time and bright-light acuity are better in men, women’s low-light acuity is better and dark adaptation is faster. Even the normal variation in certain hormone levels over the course of the menstrual cycle in women can result in as much as 8-12-dB fluctuations in vibrotactile sensitivity to 250-Hz vi- bration, with a mean less than that of men (Gescheider et al., 1984). Such variation means that during part of the cy- cle, women are much more sensitive than their male cohorts. The NIH and the FDA (e.g., 2012, 2013) emphasize the importance of taking sex differences into account when designing studies as well as prescribing medications.
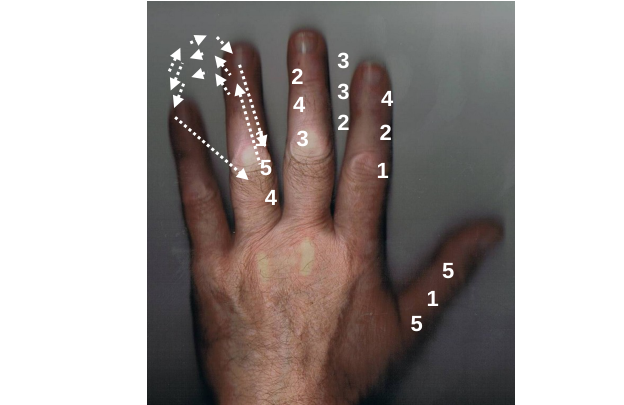
Individual Differences in Perceptual and Cognitive Tasks There are other differences that are more perceptual or cognitive in nature, sometimes described as differences in perceptual and/or cognitive styles or set. These are often more subtle, typically appearing under certain specific cir- cumstances in otherwise homogenous populations. For example, a simple instruction [e.g., to numerically order one’s fingers] can lead to very different response patterns among a group of persons, as shown in Figure 7.
2 3
4
3 4
2
2 3
5 1
1
4
5
5 1
Figure 7. Obtained labels when observers were asked to “number their fingers” From Cholewiak & Collins, 2004.
These “natural” ordering patterns were found when we were conducting a study of tactile spatio-temporal memory, in which we presented taps to the fingerpads of the five digits in various sequences. Observers were required to re- port the pattern on a keyboard, either in order (rote memory) or in reversed order (working memory). We quickly re- alized that, without specific labels, our participants generated one or the other of the patterns shown above (the thumb wasn’t considered a finger for some, so was numbered “5” almost as an afterthought!) An experimenter’s naïve request to raise finger “1” would potentially lead to very different responses over this population.
In 1977, Corcoran showed how a kind of personal “point of view” extends to the perception of asymmetric patterns (like the letter “R” is drawn on the forehead. Observers were simply asked to report the shape that they “saw, using their “mind’s eye.” Depending on the location of the drawing on the body and the position of that site in space (e.g., the palm facing outwards or towards the observer), the figure might be reported in its correct position, or reversed.
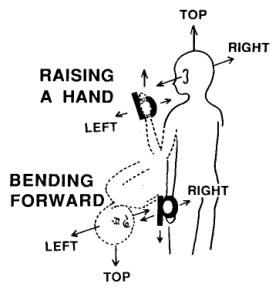
Similarly, a pattern drawn on the palm of the hand will be reported differently, not only depending on the position of the hand in 3-dimensional space, but on the personal proclivities of the participant. Sekiyama (1991) drew letter-like patterns on the hand (as well as on the forehead) of observers, asking them to report the perceived pattern. The pat- terns (and responses) were intended to be particularly susceptible to translational misinterpretation: They were the lower case English letters q, p, d, and b. The reported form was found to depend on the physical orientation of the hand in 3-dimensional space. Depending on one’s “point-of-view,” as well as the position of the limb, as shown in Figure 8, the same drawn pattern could be reported as any of the other potential alternatives in the response set. It was found that, depending on the participant, a pattern could be reported as “objectively” drawn, mirrored right-to- left, flipped up-to-down, or rotated 180 degrees (see Table 1).
Figure 8. Importance of head axes in the perception of cutaneous patterns drawn on vertical body surfaces.
Adapted from Sekiyama,. 1991.
Table 1: Individual differences in perceived orientation (from Sekiyama,. 1991.)
Table available in the original PDF paper.
The results from one of Sekiyama’s studies, shown in the Table, indicate the variety of responses generated by the tested group. Note that the sites are those that are commonly considered when cutaneous pictorial displays intended to augment the other senses. Parsons and Shimojo (1987) For example, the surface of the volar thigh was used by Englemann and Rosov (1975), Cholewiak (1979), and Clements et al. (1982) in their attempts to develop tactile dis- plays for cutaneous communication. The forearm is a common site for linear arrays (e.g. Cholewiak & Collins, 2000), presenting navigational information for the military, as well as for the vibrotactile display of spectral speech information (e.g., Weisenberger 1989), while the waist has been studied for orientation and navigational displays (e.g., Cholewiak, et al., 2004; van Erp, et al., 2005). What is remarkable is both the variety of response styles within as well as across individual observers. The unpredictability of these “natural” or “intuitive” responses underscores the cautious approach that the designer of a display system has to take when assuming how a user will appreciate a particular presentation.
“views” can take time that may or may not interfere with the task at hand.
Figure 9. Schematic from Newell, et al.’s model, showing that the information received from haptic exploration is analogous to viewing the object with a “disembodied” eye from behind the object, rather than from the viewer’s visual point of view. From Newell, Ernst, Tjan, & Bulthoff, 2000.
Figure available in the original PDF paper.
These personal inclinations, or preferences, can be difficult to work around (think handedness), are resistant to counter “training,” yet can affect a person’s natural response to a particular stimulus, particularly when task de- mands produce heavy cognitive loading with competing responses.
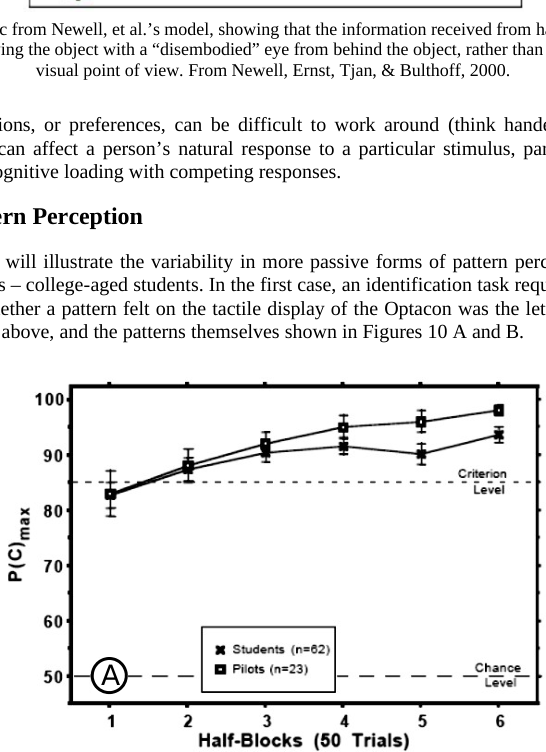
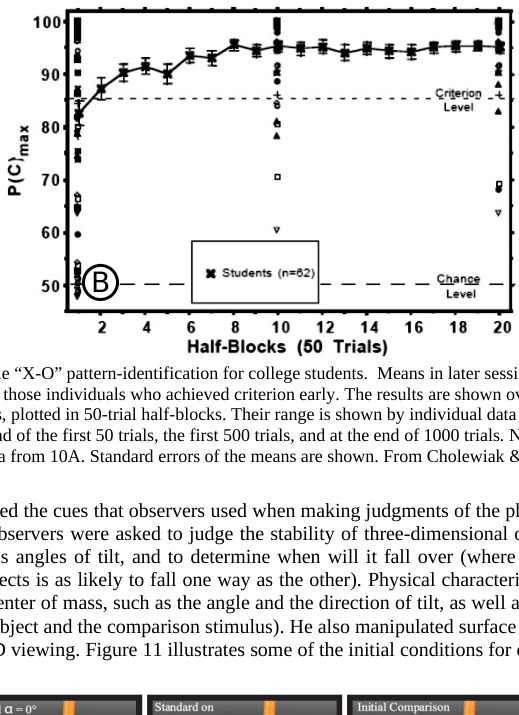
Variability in Pattern Perception The final two examples will illustrate the variability in more passive forms of pattern perception within relatively homogenous populations – college-aged students. In the first case, an identification task required the observers to re- port with a keypress whether a pattern felt on the tactile display of the Optacon was the letter “X” or “O.” The de- vice is described briefly above, and the patterns themselves shown in Figures 10 A and B.
A
Figure 10A. Vibrotactile pattern-identification for an “X-O” pattern set for two groups of initially-naive students. The results for Princeton college students and Naval student pilots are shown here over their first 3 blocks of 100 trials of training/testing, plotted in 50-trial half blocks to emphasize the early rapid changes for each group. Chance (50%) and criterion performance levels (85%) are indicated by dashed lines. Standard errors of the means are shown. From
Cholewiak & Collins, 1997.
Sixty-two college age students at Princeton University and twenty-three student pilots at the Naval Air Station, Pen- sacola, were tested in blocks of 100 trials. Figure 10A shows gradual improvement in performance for both groups over successive half-blocks of 50 trials, in order to emphasize the rapid improvement for the group over the first
150-200 trials. Figure 10B, below (for only the college students) shows that these means in 10A hide a remarkable degree of variability. Some students were able to distinguish between the two patterns within the first few presenta - tions of each (generating performance scores near 100% accuracy – see the individual points in the upper left corner of the graph below), while some other individuals were operating at near-chance (~60%) levels even at the end of a series of sessions with a total of 1000 trials. We were unable to identify any personal characteristic that was related to this variability. In a later experiment with senior citizens (>62 years of age), the variability remained, but the group was heavily skewed towards chance levels of performance rather than mastery. The next demonstration shows the variability in performance in intuitive judgments of the physics of everyday life, again, in a normal group of col- lege students.
B
Figure 10B. Vibrotactile “X-O” pattern-identification for college students. Means in later sessions include extrap- olated final levels from those individuals who achieved criterion early. The results are shown over the course of 10 blocks of 100 test trials, plotted in 50-trial half-blocks. Their range is shown by individual data points at three lev- els of training: at the end of the first 50 trials, the first 500 trials, and at the end of 1000 trials. Note a change in the scale of the abscissa from 10A. Standard errors of the means are shown. From Cholewiak & Collins, 1997.
Figure available in the original PDF paper.
S. Cholewiak (2012) explored the cues that observers used when making judgments of the physics of some everyday phenomena. Specifically, observers were asked to judge the stability of three-dimensional objects. The task was to observe an object at various angles of tilt, and to determine when will it fall over (where the critical angle is the amount of tilt where an objects is as likely to fall one way as the other). Physical characteristics were also manipu- lated that could affect the center of mass, such as the angle and the direction of tilt, as well as the object’s shape (in- cluding aspect ratio of the object and the comparison stimulus). He also manipulated surface texture, and other view- ing conditions, including 3D viewing. Figure 11 illustrates some of the initial conditions for one of his studies.
Figure 11. Examples of the two standard skew directions (α = 0º and 180º), two standard object locations (left and right), and two initial comparison aspect ratios (1:2 and 16:2).” from Cholewiak, S. A. (2012)
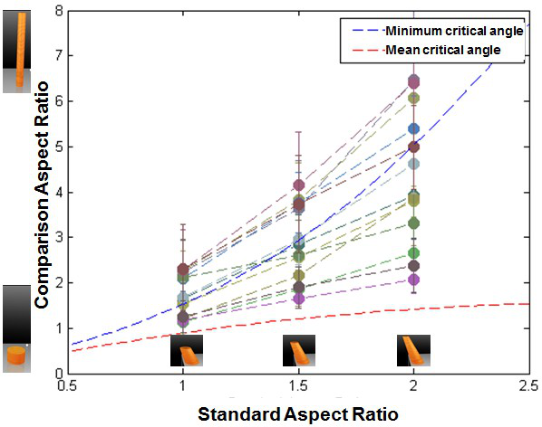
In the case of the manipulations shown in this Figure, the characteristics (aspect ratio) of the comparison cylinder were adjusted to match the stability of the standard “slanted frustrum.” But note that the stability of the standard can be perceived to vary as a function of direction around the base: Is it more likely to tilt to the left or to the right, to - ward the back or front of the table? Cholewiak described two alternative strategies for making the stability judg- ment – it could depend on either the average critical angle regardless of the direction of skew, or observers could just focus on the direction of maximal tilt and make their judgments using the minimum critical angle. The dashed lines in Figure 12 show these two alternative predictions as the aspect ratio of the standard varied.
Figure 12. Participants' settings compared against predictions derived from (i) the minimum critical angle model and (ii) the average critical angle model. If participants used the lowest critical angle to make their judgments, their data would be close to the minimum critical angle (blue dashed curve…). Conversely, if an estimate was made that uniformly took into account the object's critical angle in all possible directions, then judgments should be closer to the average critical angle (red dashed curve…).” After Cholewiak, S. A., et al. (2011)
Although the majority of participants (10/13) followed the predicted minimum-critical-angle model, the data for the remaining students were consistent with the alternative mean-critical-angle model. Again, the natural, or intuitive in- clination of individual participants in their perception of the human-environment (man-machine) interrelation is shown to vary in important enough ways that the designer/ engineer has to maintain awareness of the alternatives, particularly if those alternatives might lead to conflicting consequences.
CONCLUSIONS
In this brief survey, the proposition has been made that the development of systems and devices to augment (or re- place) existing sensory and perceptual capabilities must take into account sometimes substantial individual differ- ences in the population of potential users. These differences can be found at the sensory level, manifest in wide vari- ation in threshold and discrimination measures, and at the perceptual and cognitive levels, shown in pattern identifi- cations, perceptual “styles” and cognitive “points of view.” Furthermore, these differences, at least in the case of sensory changes, are exacerbated by the processes involved with aging. These individual differences and age-related changes can play a role in the design and versatility of a number of operational displays used by military personnel. When these are combined in multimodal displays, the potential for confusion can be profound. The manner in which these difference might be accommodated in the man-machine interface could include controls as simple as ad- justable intensities, that account for changing baseline sensitivity for each user, or in extensive over-training to at- tempt to circumvent inborn proclivities. Ultimately, the goal of good man-machine system design is to take advan- tage of the natural capabilities of the operator with a natural and hopefully-intuitive interface that would require a minimum of training for mastery.
ACKNOWLEDGEMENT
The author would like to express appreciation to Engineering Acoustics, Inc, for their support in the preparation and presentation of this manuscript.
REFERENCES
Axelrod, S., & Cohen, L. D. (1961). Senescence and embedded-figure performance in vision and touch. Perceptual and Motor Skills, 12, 283-288. Bliss, J. C., Katcher, M. H., Rogers, C. H., & Shepard, R. P. (1970). Optical-to-Tactile image conversion for the blind. IEEE
Transactions on Man-Machine Systems, MMS-11(Whole No. 1), 58-64. Cholewiak, R. W. (1979). Spatial factors in the perceived intensity of vibrotactile patterns. Sensory Processes, 3, 141-156. Cholewiak, R. W. (1994). A comparison of vibrotactile pattern perception by young and old observers. (Report No. NMAB-478: Currency Features for Visually Impaired People): National Research Council, National Materials Advisory Board report to the Bureau of Engraving and Printing, Department of Treasury, National Academy Press. Cholewiak, R. W., Brill, J. C., & Schwab, A. (2004). Vibrotactile localization on the abdomen: Effects of place and space. Per-
ception & Psychophysics, 66(6), 970-987. Cholewiak, R. W., & Collins, A. (1997). Individual differences in the vibrotactile perception of a "simple" pattern set. Perception & Psychophysics, 59(6), 850-866. Cholewiak, R. W., & Collins, A. A. (2000). The generation of vibrotactile patterns on a linear array: Influences of body site,
space, and time. Perception & Psychophysics, 62(6), 1220-1235. Cholewiak, R. W., Sherrick, C. E., Collins, A. A. Princeton Cutaneous Research Project Report No. 60, December 1992 Cholewiak, S. A., Fleming, R. W., & Singh, M. (2011) Perceived stability and center of mass of 3D objects. Paper presented at the 11th Annual Meetings of the Vision Sciences Society, Naples, FL. Cholewiak, S. A. (2012). The Tipping Point: Visual Estimation of the Physical Stability of Three-Dimensional Objects. A disser-
tation submitted to the Graduate School, Rutgers, The State University of New Jersey in partial fulfillment of the require- ments for the degree of Doctor of Philosophy Clements, M. A., Braida, L. D., & Durlach, N. I. (1982). Quantitative methods for the comparative-evaluation of artificial tactile speech displays. In IEEE Transactions on Biomedical Engineering (Vol. 29, No. 8, pp. 607-607). 345 E 47th St, New York, NY 10017-2394: IEEE-Inst Electrical Electronics Engineers Inc. Corcoran, D., (1977), "The phenomena of the disembodied eye or is it a matter of personal geography?" Perception 6(3) 247 –
253 Cote, J., & Schaefer, E. G. (1981). Perceptual processing strategies in the cross-modal transfer of form discrimination: A developmental study. Journal of Experimental Psychology, 7(6), 1340-1348. Engelmann, S., & Rosov, R. J. (1975). Tactual hearing experiment with deaf and hearing subjects. Journal of the Exceptional
Child, 41, 245-253. FDA News Release (2013). FDA requiring lower recommended dose for certain sleep drugs containing zolpidem. Retrieved from < http://www.fda.gov/newsevents/newsroom/pressannouncements/ucm334798.htm> on Feb 14, 2014. FDA Website (2012). Understanding Sex Differences. Retrieved from <http://www.fda.gov/ScienceResearch/SpecialTopics/
WomensHealthResearch/ucm131182.htm> on Feb. 14, 2014. Fozard, J. L. (1990). Vision and hearing in aging. In J. E. Birren & K. W. Schaie (Eds.), Handbook of the Psychology of Aging (3rd ed., pp. 150-171). New York: Academic Press. Gescheider, G. A., Verrillo, R. T., McCann, J. T., & Aldrich, E. M. (1984). Effects of the menstrual cycle on vibrotactile sensitiv-
ity. Perception & Psychophysics, 36(6), 586-592. Kleinman, J., & Brodzinsky, D. (1978). Haptic exploration in young, middle-aged, and elderly adults. Journal of Gerontology., 33(4), 521-527. Louis, D. S., Greene, T. L., Jacobson, K. E., Rasmussen, C., Kolowich, P., & Goldstein, S. A. (1984). Evaluation of normal val-
ues for stationary and moving two-point discrimination in the hand. The Journal of Hand Surgery, 9A(4), 552-555. McNeil, J. M. (1997). Census Brief: Disabilities affect one-fifth of all Americans (CENBR/97-5): U. S. Department of Commerce. Muller, G., Richter, R., Weisbrod, S., & Klingberg, F. (1992). Impaired tactile pattern recognition in the early stage of primary
degenerative dementia compared with normal aging. Archives of Gerontology & Geriatrics, 14(3), 215-225 Newell, F. N., Ernst, M. O., Tjan, B. S., & Bülthoff, H. H. (2000). Viewpoint dependence in visual and haptic object recognition (Technical Report No. 080). Tübingen, Germany: Max-Planck-Institut für biologische Kybernetik. Nolan, C. Y., & Kederis, C. J. (1969). Perceptual factors in braille word recognition (Research Series No. 20). New York:
American Foundation for the Blind. Parsons, L., & Shimojo, S. (1987). Perceived spatial organization of cutaneous patterns on surfaces of the human body in various positions. Journal of Experimental Psychology: Human Perceptual Performance, 13(3), 488 - 504. Phillips, J. R., & Johnson, K. O. (1985). Neural mechanisms of scanned and stationary touch. Journal of the Acoustical Society of
America, 77(1), 220 - 224.
Poggel, D., Treutwein, B., Calmanti, C., & Strasburger, H. (2012). The Tölz temporal topography study: Mapping the visual field across the life span. I: The topography of light detection and temporal-information processing. Attention, Perception & Psychophysics, 74, 1114-1132. Poggel, D., Treutwein, B., Calmanti, C., & Strasburger, H. (2012). The Tolz Temporal Topography Study: Mapping the visual
field across the life span. Part II: Cognitive factors shaping visual field maps. Attention, Perception, & Psychophysics, 74, 1133-1144. Robbins, A. M., Hesketh, L. J., & Bivins, C. (1993). Tactaid 7 Reference Guide and Orientation. Somerville, MA: Audiological Engineering Corp. Sekiyama, K. (1991). Importance of head axes in perception of cutaneous patterns drawn on vertical body surfaces. Perception &
Psychophysics, 49(5), 481 - 492.. Shimizu, Y., & Frost, B. (1990). Effect of orientation on visual and vibrotactile letter identification. Perceptual and Motor Skills, 71(1), 195-198. Stevens, J. C. (1992). Aging and spatial acuity of touch. Journal of Gerontology: Psychological Sciences, 47(1), 35-40. Stevens, J., Foulke, E., & Patterson, M. (1996). Tactile acuity, aging, and Braille reading in long-term blindness. Journal of Ex-
perimental Psychology: Applied, 2(2), 91-106. Stevens, J., Cruz, L., Marks, L., & Lakatos, S. (1998). A multimodal assessment of sensory thresholds in aging. Journal of Gerontology: Psychological Sciences and Social Sciences, 53(4), 263-272. Stevens, J., & Patterson, M. (1995). Dimensions of spatial acuity over the life span. Somatosensory and Motor Research, 12(1),
29-47. van Erp, J. B. F., van Veen, A. H. C., Jansen, C., & Dobbins, T. (2005). Waypoint navigation with a vibrotactile waist belt. ACM Transactions on Applied Perception, 2, 106-117. Verrillo, R. (1993). The effects of aging on the sense of touch. In R. Verrillo (Ed.), Sensory Research: Multimodal Perspectives
(pp. 285-298). Hillsdale, NJ: Erlbaum. Weisenberger, J. M. (1989). Tactile Aids for Speech Perception and Production by Hearing-Inpaired People. Volta Review, 91(5), 79-100.
LISTED IN THE AHFE DIGITAL BOOKSTORE CATALOGUE
Explore the complete digital volume
Advances in Cognitive Engineering and Neuroergonomics
Read this individual research paper free through the original publisher, or explore the full digital proceedings book.
ISBN 978-1-4951-2101-2
Explore this ISBN in the AHFE Bookstore ↗Listed in the July 2026 bookstore catalogue; search by ISBN to confirm current availability · Digital book purchase optional