Francoise Meyer, Tim Jeske, Sönke Duckwitz, Christopher M. Schlick (2020). Influence of Instructional Methods on Learning Sensorimotor Tasks. In: Advances in The Ergonomics in Manufacturing: Managing the Enterprise of the Future. AHFE Open Access, vol. 12. https://doi.org/10.54941/ahfe100460
Against the background of demographic change, stress-optimized deployment scheduling can help to achieve the ability of employees to work in assembly areas over an extended working lifetime. However, realizing an optimal assignment of personnel from an ergonomic point of view often requires qualifying employees to process new tasks. When employees are for the first time confronted with unfamiliar sensorimotor tasks they have to learn task-specific skills. This includes being provided with an introduction to the new task as well as subsequent practice until achieving a reference performance. For introduction purposes a variety of work instructions can be used; each of them is assumed to have a different effect on learning. To assess this influence quantitatively, a laboratory study was conducted. The study focused on the repeated assembly of a carburetor which was executed by participants which received either a previous interactive filmbased instruction as well as a graphical task description or received only the graphical task description. The results show the instruction’s influence on execution times as well as on assembly errors to be significant.
Preserving the employees’ ability to work over an extended working lifetime becomes more and more important within the context of demographic change. Implementing such aims for employees in assembly areas requires a reduction of high physical demands. In order to achieve this, different options like redesigning workplaces or training of employees in ergonomically beneficial behavior can be conducted. Additionally, the so called “stress- optimized deployment scheduling” enables reducing physical demands, which means the assignment of employees to workplaces under consideration of individual ergonomic criteria. For example, this suits in case of employees having different body heights: at the same workplace a taller employee would likely have another posture than a smaller one. Such different postures usually come along with different physical demands. Consequently, one aim of stress-optimized deployment scheduling is to assign employees to workplaces in that way that employees can capture in each case the best possible posture. For reducing physical demand in this case it is conceivable to assign only employees with nearly the same body height to a workplace, which required team work, at the same shift. When a new assignment is necessary, e.g. cause of shift start, another team with employees, which have nearly the same body height, have to be assigned to this workplace. Since not all employees have nearly the same body height the second team includes employees with other body height than the first mentioned team. Thus this type of stress- optimizes deployment scheduling requires a workplace, which can be adapted to body height. If it is not possible to adapt a workplace to the employee, there is - if applicable - the possibility to reduce the timely exposure of physical demand by assigning a physical demanded employee to another workplace after a certain time. The regular changing of assignments within a working team also called job rotation. However job rotation requires appropriate qualified employees. If an employee has no sufficient qualification for job rotation it has to be deliberated whether to qualify this employee for a new task to enable job rotation or not. Tasks in assembly areas mostly require sensorimotor skills which need to be learned task-specifically and require sufficient practice (Rohmert et al. 1974). Hence, it takes a certain time until an employee is able to execute a new sensorimotor task in a required quality and quantity. The period, in which an employee is introduced into a task and in which the same employee trains the task self- determined until achieving a reference performance level, is referred to as learning time. Since knowledge about the learning time’s duration is essential for deciding whether an employee has to be qualified or not, a model for forecasting the learning time of sensorimotor tasks has been developed by Jeske and Schlick (2012). The model describes the increase in performance by repeated execution of a task during self-determined practice. Until now this model does not consider the influence of work instructions before the period of self-determined practice. Since different types of work instructions are available, it is to assume they are having different influences on learning time.
BACKROUND Stress-optimized Deployment Scheduling
Deployment scheduling is aimed at proper assignment of employees and workplaces to ensure a company’s operational sequences. For that matter, individual characteristics of the employees and special requirements of the workplaces have to be considered (Buck and Spath 2012). To conduct a stress-optimized deployment scheduling it is first of all necessary to verify which employee could – due to its qualifications – be generally assigned to which workplaces. For example (s. also Jeske et al. 2014), there are four employees with different qualifications and four workplaces with different requirements. Now each employee’s qualifications are compared with the requirements of each workplace. Adequate assignments of employee and workplace were denoted with ‘ok’ and unsuitable assignments were marked with ‘×’ (s. Figure 1).
employee a b c d A
൮
workplace
൲ B C D
𝑜𝑘 𝑜𝑘 𝑜𝑘 𝑜𝑘 × 𝑜𝑘 𝑜𝑘 𝑜𝑘 𝑜𝑘 𝑜𝑘 𝑜𝑘 𝑜𝑘 𝑜𝑘 𝑜𝑘 𝑜𝑘 ×
Figure 1: Possible assignments in consideration of employee’s qualifications
Figure available in the original PDF paper.
The next step is an analysis in consideration of ergonomic criteria. For this purpose evaluation methods as for example the key indicator method (BAuA 2001) or the OVAKO-Working-Posture-Analyzing-System (OWAS, Stoffert 1985) come into consideration. Basically all assignments can be analyzed, but for deployment scheduling only the assignments marked with ‘ok’ are allowed. For the illustrated example an ergonomic analysis on the base of the key indicator method could led to the following result (s. Figure 2). The numbers represent risk classes, which describes the degree of health risk of an employee to incur an injury of the muscular-skeletal system in a special load situation. The meanings are (BAuA 2001): 1 = “low load situation, health risk from physical overload is unlikely to appear”; 2 = “Moderate load situation, physical overload is possible for less resilient persons.” 3 = “Increased load situation, physical overload also possible for normally resilient persons.”. The crossbred assignments may not be used for deployment scheduling since they lack of sufficient qualification.
employee a b c d A
൮
workplace
൲ B C D
2 1 3 2 3 2 1 1 1 1 2 3 3 2 2 1
× ×
Figure 2: Ergonomic analysis for all assignments
Figure available in the original PDF paper.
With the help of heuristic methods or optimization analyses a stress-optimized deployment scheduling can be carried out. However, as indicated in Figure 2 an assignment of employee d to workplace D would come along with low physical demand. Thus this assignment would be advised from an ergonomic point of view. Due to the fact that employee d is not qualified for workplace D, this assignment is not allowed. In such cases qualification measures are recommended to enable the assignment.
Learning Time Prediction Learning time refers to the period in which an employee gets to know a new work task and practices it self- determinedly until reaching a given reference performance. Figure 3 schematically illustrates learning time. According to this learning time consists of two parts along the horizontal axis. The first part refers to the “introduction into the work task”. In this part the learning person gets to know the work task and also receives, depending on the chosen instructional method, information about the task, e.g. the employee reads a tutorial or an instructor explains how to handle the new task. Overall this part is characterized by a non self-determined time flow and the duration of this part depends on the chosen instructional method. The second part refers to the “training until reaching the reference performance”. This part begins with the first self-determined execution of the task and ends by reaching the reference performance level. The duration of the second part depends on many factors, which de Greiff (2001) subsumed to three classes: factors of the working person (e.g. age, gender, qualification,…), factors of the learning method (e.g. task description, instructional method,…) and factors of the work task (number of components, predetermined time,…). The increasing performance during the second part can be mathematically described with the help of learning curves.
performance reference performance
introduction in training until reaching the
time
the work task reference performance learning time
Figure 3: Schematic illustration of learning time (Schlick et al. 2010b)
Figure available in the original PDF paper.
The first mathematical learning curve model for industrial use was formulated by Wright (1936). In his model the learning process is described with the help of a power function. The time of the nth execution tn is described as a product of the duration of the first execution t1 and a value, which decreases with a rising number of repetitions n. The dimension of reduction is described in the proportionality k. The structure of the model is given by:
Equation reproduced from the original PDF.
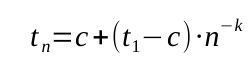
(1) Due to the characteristics of the used power function, the model suggests the possibility of an unlimited increase in performance. For this reason, Wright's model was criticized and other models were developed. One of them was formulated by de Jong (1960). He added a so called irreducible factor c, which describes a limit of improvement in performance (Hieber, 1991; Laarmann, 2005;):
−k (2)
Equation reproduced from the original PDF.
Further models have since been developed, which are reviewed for example in Hieber (1991) or Laarmann (2005). Ergonomics in Manufacturing (2020)
All of these models have been developed task-specifically and are not suitable for predicting the learning time. Therefore, Jeske and Schlick (2012) developed a method for predicting learning time, which is based on a statistical model. They describe the time of the nth execution tn by the use of an irreducible factor c and the two model parameters λ and k, which can be forecasted with knowledge about the working person, the work task and the learning method:
Equation reproduced from the original PDF.
The irreducible factor c is estimated in this model by the Methods-Time Measurement Universal Analyzing System (MTM-UAS). The prediction of λ results from information about – sorted by the three classes of influencing factors – the experience of the working person with assembly E (none/1, little/2, medium/3, much/4), the gender of the working person G (m/1, w/2), the type of task description D (textual/1, graphical/2, animated/3) and the difficulty of the work task H. The difficulty of a work task is determined by first order entropy of parts and movements according to MTM-UAS combined by using the Euclidean norm. The forecast of k results from the parameter λ added with information about the fine motor skills of the working person expressed in the first and the sixth factor of Fleishman F1 and F6 (Fleishman, 1962; Fleishman & Ellison, 1962), which can be measured according to Schoppe (1974) and Hamster (1980), and the age of the working person A.
The statistically determined equations, which Jeske (2013) found for the prognosis of the model’s parameters λ and k, are: λ=2,256+0,978∙H−0,755∙E−0,45∙D+0,87∙G (4)
Equation reproduced from the original PDF.
METHOD
Since the above prediction model does not consider work instruction before an employee begins to work actual further research focuses on the influence of work instructions. For this purpose several empirical studies with different types of work instructions will be conducted.
To quantify the influence of instructional methods on learning time an empirical study was conducted. For this purpose a film-based instruction was specially developed.
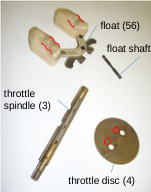
Work Instruction The instruction was created according to the first two steps of Training Within Industry (TWI) (REFA 1991). The first step of this method is intended to prepare employees for the instruction by acquainting them with the work task, the work environment and the conditions of employment. In the second step an instructor demonstrates and explains the work task to the employee. In practice this instructional method is usually carried out by a real person like a foreman. For replication purposes the instruction was provided via a 20-minute interactive film, which was created specially for the study and was presented on a touch-screen-monitor. The film is sub-divided in seven learning parts. Each learning part is followed by questions that test the learning success. For each question three possible answers are provided, one of which is correct. Additionally it is possible to answer each question with “I do not know the answer!”. The answering is conducted by touching the monitor. Whenever a wrong answer or the answer “I do not know the answer!” is given, the related learning part is presented again. This shall ensure that the learning person knows the content of the instruction adequately. In case of a right answer the next learning part starts automatically. The left side of Figure 4 shows a sequence of a learning part, while the right side depicts the related question which is posed after the presentation of the full learning part. In this example, the carburetor’s components for the regulation of fuel level and fuel-air-flow are presented to the learning person. The single components were named and some information for the assembly are provided. After the full presentation of the learning part the learning person has to answer the question “Which component is shown on the following picture?”.
Question 3:
Regulation of fuel level and fuel-air- flow
Which component is shown on the following picture?
float (56)
Please note the „humps“ of the float!
float shaft (57) Please note the marks on the throttle disc!
throttle spindle (3)
float throttle disc insulated pliers I do not know the answer!
throttle disc (4)
Figure 4: Extract of the instructional film (translated from German)
Participants Ten male participants between the ages of 23 and 29 years (M=25.7 years, SD=2.214 years) took part in the study. They were either already holding a university degree in engineering or were engineering students. All participants had normal or corrected to normal vision (visual acuity ≥80% at 0.40m and 0.55m) and were right-handed. The participants were randomly assigned to two groups. The participants of one group were instructed by the interactive film. The participants of the other group did not receive any previous instructions.
Task The investigation required participants to assemble a carburetor (Type Stromberg 175 CD-2) ten times without a target time, but they were asked to assemble in a timely manner. This meant to assemble 34 components of different sizes, e.g. screws or a case cover. Some attached parts and components which are prone to wear, such as gaskets were excluded from the experimental task. For this task the number of part-related and motion element-related entropies H is 4.682; the target time according to MTM-UAS is 146.2 sec (Jeske 2013).
Experimental Variables The independent variable is the type of instructional method with two levels of treatment (no instruction vs. instruction with an interactive film). Execution times and assembly errors in each trial are as well as the subjective work load the dependent variables.
Procedure Before the main test all participants were asked to self-evaluate their experiences with assembly tasks, with technical drawings and with carburetors on a four-stepped Likert-scale (none, little, medium, much). To control fine motor skills the sixth factors of Fleishman (Fleishman, 1962; Fleishman and Ellison, 1962) were determined with the help of the motor test series according to Schoppe (1974) and Hamster (1980) afterwards. Subsequent the assembly of the carburetor as main test starts. During assembly, all participants, whether they were instructed or not, were supported by a graphical task description. This description shows the assembly of the carburetor in three steps in form of exploded drawings with short textual explanations. The participants had to execute the assembly ten times without any target time, but were requested to assemble in a timely manner. The repeated assembly should cause the occurrence of a learning effect. After the main test the participants were asked about their subjective perceived workload with the help of the NASA Task Load Index (NASA-TLX) questionnaire (Hart and Staveland 1988).
Statistical analysis The statistical analysis was calculated using the statistical software package SPSS (Version 19.0). The participants’ execution times have been analyzed with the help of an analysis of variance with repeated-measures. Thereby, the instructional method as well as the repetition of the task execution was analyzed as main effects. Additionally, the Ergonomics in Manufacturing (2020) effect size ω² was calculated for significant effects. The χ²-test and the Mann-Whitney U test have been used to assess assembly errors. In case of a significant effect in the Mann-Whitney U test the effect size r was calculated. The chosen level of significance for each analysis was α=0.05 (Field 2005).
RESULTS AND DISCUSSION
Characteristics of the Participants The experience with assembly differs between all participants. However, there is no significant difference between the groups of participants who achieved a previous instruction respectively achieved no previous instruction. All participants have nearly the same experience with technical drawings and carburetors. While the participants have hardly any prior experiences with carburetors the participants have much experience with technical drawings. This can be ascribed to the engineering education of the participants. The reading and compiling of technical drawings are major parts of this education. All in all the groups do not differ in relation to the participants’ experiences.
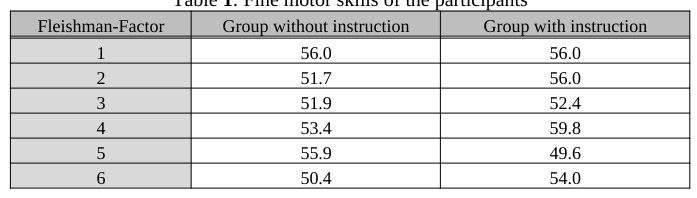
The results of the motor test are shown in Table 1. All values are within the range of 50±10, which means all participants have normal fine motor skills.
Table 1: Fine motor skills of the participants Fleishman-Factor Group without instruction Group with instruction 1 56.0 56.0 2 51.7 56.0 3 51.9 52.4 4 53.4 59.8 5 55.9 49.6 6 50.4 54.0 Execution Times
The average execution times and their 95% confidence intervals are shown in Figure 5. It becomes apparent that the execution times decrease from a comparatively high value at the first execution to a lower and relatively stable value at the end of the learning period. This learning effect is statistically significant (F(1.836; 14.690)=35.803; p<0.001) and has a very large effect size of ω²=0.691.
Figure 5: Average execution times and 95% confidence intervals of both groups
Figure available in the original PDF paper.
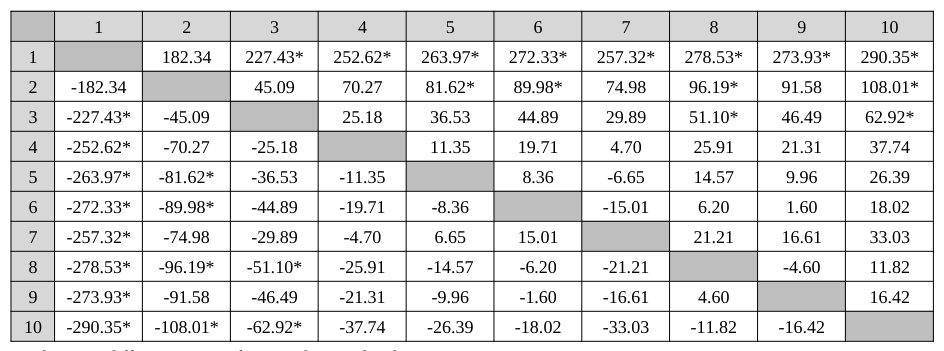
Pairwise comparisons (s. Table 2) confirm this. Significant differences occur between the first execution time and the execution times of the third until to the tenth execution as well as between the second execution time and most following execution times. To control the familywise error the Bonferroni correction was applied.
Table 2: Pairwise comparisons of mean execution times [s]
* The mean difference is significant at the 0.05-level
Furthermore, a significant interaction between the executions’ repetition and the type of instructional method (F(1.836; 14.690)=9.085; p=0.003) can be proven, which influences the learning progress with a large effect size of ω²=0.3414. Participants who did not receive any previous instructions showed more increase in their performance especially in the beginning of the learning period than participants that received previous instructions. It is assumed that instructed participant have already generated a mental model of the product and a certain procedure knowledge before the self-determined practice. The instructional method has a significant effect on the cumulated execution time of all repetitions (F(1; 8)=9.098; p=0.017); the related effect size is large (ω²=0.6200). In this context the cumulated execution time is higher for participants who did not receive any previous instruction. Instructed participants needed on average 75% of the time that non-instructed participants needed. This is equivalent to an average time saving during the self-determined practice of 13.2 minutes. However, the total duration of the laboratory study was for instructed participants 6.8 minutes higher since the previous instruction took 20 minutes (see Figure 6).
t [min] 20 40 60
Figure 6: Time requirements for the laboratory study of both groups in comparison Further investigations on the difference between participant with and without instruction were carried out with the help of a t-test. The difference that can be seen in Figure 5 between the first execution time for participants with and without instruction was proven to be significant. Participants with instruction (M=348.93; SD=56.830) required significantly (T(4.738)=3.600; p=0.017) less time for their first execution than participants without previous instruction (M=662.66; SD=186.356). As for the last five repetitions there are no significant differences in execution times between participants with or without previous instruction all participants achieved a similar quantitative proficiency level independent of the instructional method.
Figure available in the original PDF paper.
Assembly Errors
Figure 7 shows the average number of assembly errors for each repetition. It is evident that participants with previous instruction performed nearly free from assembly errors already in the beginning of the learning period, whereas participants without previous instruction made comparatively many errors throughout the learning phase. This initial difference was proven to be significant by the Mann-Whitney-U test, as the number of errors in the first execution for participants with instruction (M=0.200) is significantly lower (U=3.50; z=-2.012; p=0.044) than for participants that did not receive a previous instruction (M=1.850). The related effect size is large (r=0.636). With a growing number of repetitions, a significant decrease of errors can be observed for participants without instruction, which represents a learning effect. This could be evidenced by the Kendall-W-test (χ²(9)=26.031; p=0.002).
Figure 7: Average numbers of errors of both groups
Figure available in the original PDF paper.
Subjective Perceived Workload
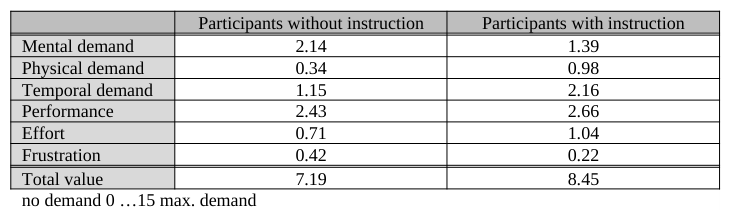
Table 3 shows the results of the NASA-TLX. According to these, participants with previous instruction feel less mentally demanded and frustrated than participants without previous instruction. This can possibly be ascribed to the given assembly rules in the instruction, which allowed participants to think less about how to assemble. However, they feel more physically and temporally demanded as well as they feel a higher stress in effort than participants without instruction. This might result from the fact that participants with previous instruction were involved in the study for a longer time then participants without instruction (see section “Execution times”). Furthermore, it is possible that participants with instruction sensed the instructional film lengthy due to detailed explanations. However, the groups do not differ significantly neither in one of the single loads nor in the total subjective workload.
Table 3: Results of the NASA-TLX
CONCLUSION AND OUTLOOK The conducted laboratory study shows how an instructional method can influence the learning process of sensorimotor tasks – especially the self-determined practice. Thus, the considered instruction prior to the self- determined practice leads to lower executions times and less errors. Analyzing ten executions, instructed participants required 75% of the time non-instructed participants required. At the same time the number of errors for instructed participants is significantly lower than for non-instructed participants. For stress-optimized deployment scheduling this means that unqualified employees, which are proper for a workplace in consideration of ergonomic criteria, can be qualified faster by the use of instructional methods like the analyzed film-based instruction. However, the effort for creating an instruction like the used film can be rated as high. For this reason future research should investigate the influence of other instructional methods, e.g. the Learning Guidelines Method (Schelten 2005). This would also allow a differential analysis concerning the effect of different instructional methods on productivity and quality of products. Furthermore, future research could focus on the integration of the influence of instructional methods in Jeske’s model (Jeske 2013). This would require investigating whether the influence of instructional methods can be integrated in the forecast of the existing model parameters or if the model can be extended by a parameter describing the instructional methods’ influence. Aspects of a higher remuneration for higher qualified employees did not receive any attention in this study.
ACKNOWLEDGEMENTS
This research was elaborated in the research project ENgAge4Pro, which is publically funded by the German Federal Ministry of Education and Research (BMBF) and the European Social Fund (ESF); the grant number is 16SV6143.
REFERENCES
BAuA (2001), “Gefährdungsbeurteilung mithilfe der Leitmerkmalmethode“ The website of Bundesanstalt für Arbeitsschutz und Arbeitsmedizin: http://www.baua.de/de/Themen-von-A-Z/Physische-Belastung/Gefaehrdungsbeurteilung.html Buck, H., Spath, D. (2012), “Personalmanagement”, in: HÜTTE – Das Ingenieurwissen, Czichos, H., Hennecke, M. (Ed.).
Berlin: Springer. De Greiff, M. (2001). “Die Prognose von Lernkurven in der manuellen Montage unter besonderer Berücksichtigung der Lernkurven von Grundbewegungen.“ Düsseldorf: VDI. De Jong, J.R. (1960) “Die Auswirkung zunehmender Fertigkeit“. REFA Nachrichten Volume 13 No. 1. pp. 155-161.
Fleishman, E.A. (1962). “The description and prediction of perceptual motor skill learning”. In R. Glaser (Ed.), Training research and education (pp. 137-175). Pittsburgh. Fleishman, E.A., Ellison, G.D. (1962). „A factor analysis of fine manipulative performance”. Journal of Applied Psychology, 46:
96-105. Field, A. (2005). “Discovering Statistics Using SPSS”. London: Sage Publications. Hamster, W. (1980). „Die Motorische Leistungsserie – MLS“. Mödling: Schuhfried Hart, S.G.; Staveland, L.E. (1988): „Development of the NASA-TLX (Task Load Index): Results of Empirical and Theoretical Research”. in: Hancock, P.A.; Meshkati, N. (Hrsg.): Human Metal Workload, North Holland Press, Amstadam, Niederlande, pp. 239-250 Hieber, W. L. (1991), “Lern- und Erfahrungskurveneffekte und ihre Bestimmung in der flexibel automatisierten Produktion“.
München: Vahlen. Jeske, T. (2013), “Entwicklung einer Methode zur Prognose der Anlernzeit sensumotorischer Tätigkeiten”. in: Industrial Engineering and Ergonomics, Schlick, C. (Ed.), Aachen: Shaker Verlag Jeske, T., Schlick, C. (2012), “A New Method for Forecasting the Learning Time of Sensorimotor Tasks”, in: Conference
Proceedings of 4th Internatinal Conference on Applied Human Factors and Ergonomics (AHFE), USA Publishing (Ed.), Stoughton, WI: The Printing House. Jeske, T., Brandl, C., Meyer, F., Schlick, C. (2014) “Personaleinsatzplanung unter Berücksichtigung von Personenmerkmalen“ in: Gestaltung der Arbeitswelt der Zukunft, Gesellschaft für Arbeitswissenschaft e.V. (Ed.). in press Laarmann, A. (2005) “Lerneffekte in der Produktion“, Wiesbaden: Deutscher Universitäts-Verlag. REFA (1991), “Methodenlehre der Betriebsorganisation - Arbeitspädagogik”. München: Carl Heiser Verlag. Rohmert, W., Rutenfranz, J., Ulrich, E. (1974), “Das Erlernen sensumotorischer Fertigkeiten”. Institut für Arbeitswissenschaft,
TU Darmstadt. Frankfurt a.M.: Europäische Verlagsanstalt Schelten, A. (2005). “Grundlagen der Arbeitspädagogik”. Stuttgart: Franz Steiner Verlag. Schlick, C., Bruder, R., Luczak, H. (2010a), “Arbeitswissenschaft“. Berlin: Springer.
Schlick, C., Jeske, T.; Jochems, N.; Hasenau, K.; Tackenberg, S.: “Untersuchung des Einflusses der informatorischen Reichhaltigkeit von Arbeitsplänen auf die Anlernzeit sensumotorischer Fertigkeiten“, in: Wandlungsfähige Produktionssysteme, Schriftenreihe der Hochschulgruppe für Arbeits- und Betriebsorganisation e.V. (HAB), Nyhuis, P. (Ed.) GITO, Berlin. Schoppe, K.J. (1974). “Das MLS-Gerät: ein neuer Testapparat zur Messung feinmotorischer Leistungen“. Diagnostica, 20: 43-47 Stoffert, G. (1985) “Analyse und Einstufung von Körperhaltungen bei der Arbeit nach der OWAS-Methode”, Zeitschrift für
Arbeitswissenschaft, No.1. pp. 31-38. Wright, T.P. (1936), “Factors Affecting the Cost of Airplanes”, Journal of the Aeronautical Sciences Volume 3 No. 4. pp. 122-
128.
LISTED IN THE AHFE DIGITAL BOOKSTORE CATALOGUE
Explore the complete digital volume
Advances in The Ergonomics in Manufacturing: Managing the Enterprise of the Future
Read this individual research paper free through the original publisher, or explore the full digital proceedings book.
ISBN 978-1-4951-2103-6
Explore this ISBN in the AHFE Bookstore ↗Listed in the July 2026 bookstore catalogue; search by ISBN to confirm current availability · Digital book purchase optional