Rita Ferreiraa, Emília Duartea, Carlos Rosaa, Paulo Noriegabc, Francisco Rebelobc, Elena Noriegad (2022). Development of Pictograms Depicting the Five Moments of Hands Hygiene for Healthcare Workers: A User-Centered Design Approach. In: Advances in Ergonomics In Design, Usability & Special Populations: Part I. AHFE Open Access, vol. 18. https://doi.org/10.54941/ahfe100785
The Health Care-Associated Infections (HCAIs) are a serious health problem, having contributed to high morbidity and mortality rates, as well as an increase in associated costs. Together with a set of good practices, hand hygiene is considered one of the key measures of preventing and controlling the spread of HCAIs. However, compliance with hand hygiene is relatively low. Therefore, there is a well-recognized need for measures that increase compliance rates. This paper describes the development and evaluation of a set of pictograms that illustrate the "Five Moments for Hand Hygiene”. The pictograms depict the key moments where hand hygiene is a mandatory obligation to healthcare workers. In the design and validation of the pictograms, a user-centered design approach was adopted, involving the participation of health care workers through methods such as focus group sessions, the comprehensibility judgment test and the perceived adequacy, effectiveness and preference assessment questionnaire. The gathered results could serve to improve the effectiveness of the present campaigns, which are intended to promote hand hygiene compliance among healthcare workers.
The ‘National Hand Hygiene Campaign’ is a multimodal strategy, proposed by World Health Organization’s (WHO’s) World Alliance for Patient Safety, which is intended to promote compliance with hand hygiene (HH). Annually, the ‘Global Patient Safety Challenge’ launches international programs that seek to control, reduce and prevent Health Care-Associated Infections (HCAIs), as well as improve patient safety. One of the first challenges Ergonomics In Design, Usability & Special Populations I (2022) https://openaccess.cms-conferences.org/#/publications/book/978-1-4951-2106-7
was the “Clean Care is Safer Care” program, which was duly translated and adapted in Portuguese with the slogan – ‘Medidas simples salvam vidas’ (i.e., ‘Simple measures save lives’). Promoted by the Portuguese Directorate- General of Health (DGS), the purpose of this Portuguese program was to advocate hand hygiene compliance as one of the most effective measures, with great impact in the antimicrobial resistance and all the associated costs, to pre- vent HCAIs. Since 2008, Portugal adheres annually to the WHO’s challenge (DGS, 2010-2011).
HCAIs are a serious health problem, having contributed to high morbidity and mortality rates, as well as an increase in associated costs. In Europe, recent estimates indicate that HCAIs are associated to 37 000 deaths per year (Jenner et al., 2006). Together with a set of good practices, HH is considered one of the key measures for preventing and controlling the spread of HCAIs. Therefore, in the last few years, diverse multimodal strategies have been implemented to promote HH, as well as to develop visual communication materials (e.g., posters, brochures, instructions). The “Five Moments for Hand Hygiene” leaflet is often included in such campaigns. The “Five Moments” is a conceptual model, proposed by the WHO (WHO, 2009), which defines the key moments where HH is a mandatory obligation, i.e., (1) before touching a patient; (2) before cleaning/aseptic procedures; (3) after body fluid expo- sure/risk; (4) after touching a patient, and; (5) after touching patient surroundings. However, despite all efforts, compliance with HH is relatively low. In Portugal, compliance rates approximate 64% in 2010 and 66% in 2011 (Paiva et al., 2013). Therefore, there is a well-recognized need for measures that contribute to an increase in compliance rates. Moreover, through focus group meetings with healthcare workers and interviews with experts in patient safety, many professionals reported that they have no knowledge, and/or have forgotten about the “Five Moments”, as well as that they found the current leaflets difficult to understand and memorize. In this context, the DGS’ goals to promote patient safety, together with IADE’s efforts to endorse the designers’ role in society, afforded this initiative to improve information design for healthcare contexts, particularly those which are related to the promotion of HH compliance.
In this context, the purpose of this study was to develop a system of pictograms that depict the “Five Moments” and are to be applied in a new leaflet targeted at healthcare workers. For such, a user-centered design (UCD) approach was implemented and aimed to include the healthcare workers’ contributions (e.g., comprehension difficulties, perceptions, attitudes/ beliefs, motivation to comply) in the design process/ activities. Previous research suggests that compliance rates differ significantly between professional categories (e.g., Duggan, Hensley, Khunder, Papadimos, & Jacobs, 2008; Erasmus et al., 2010; Pittet et al., 2004). Therefore, the study conducted interviews, focus groups, a comprehensibility judgment test (ISO, 2001), as well as an adequacy and preference assessment with diverse professional groups (i.e., doctors, nurses, technicians and operational assistants).
Pictograms are becoming increasingly important for graphic communication, as well as to convey safety information. Most of the information contained in the leaflet is communicated by pictograms; thus, its success is heavily dependent on the users being able to correctly comprehend their meaning. Although the terms ‘pictogram’, ‘symbol’, and ‘icon’ are used in an interchangeable manner, they are not equivalent. Pictograms are simple, concrete and usually self-explanatory visual forms, which translate ideas or objects. Their main function is to communicate a message in the most effective and direct manner, without ambiguity. A symbol does not have a formal relation with the elements or ideas that it stands for. The meaning of a symbol is decided in “convention”, therefore, it must be learned (Hubner & Abdullah, 2006; Mollerup, 2005). This difference is very well explained in the seminal text from Krampen (1965), in which he uses, as examples, the letter “e”, a silhouette of a man and a dollar sign. According to him, a letter is a ‘logogram’ (alphabetic, typographic), while both the silhouette of a man and the dollar sign belong to the category of ‘phonograms’ (independent of speech sound). However, the first is a ‘pictograph’ (resemblance with the real thing/ object) and the latter is a ‘diagram’ (not iconic/ pictographic). The pictographs themselves can also be very distinct from each other, as illustrated by the cases of the elephant used to portray the Republican Party or the lion that stands for the British Empire (indirect symbols), which are culture- dependent, and the snail used to symbolize slowness (direct symbol). But, the association between the pictogram of a snail and the referent ‘slow- ness’ might not be universal, because a snail is also slimy and shielding. Thus, Krampen (1965) call such cases ‘quasi-symbols’. When the symbol is universally comprehended, then it is called an ‘emblem’. In literature, other terms which identify the pictograms/ symbols’ relationship to the concept they intend to evoke, can be found (Wogalter, Silver, Leonard, & Zaikina, 2006), for example: (a) Representational symbols (images directly or closely related to the concept), (b) Abstract symbols (images that have a distant relationship to the concept), (c) Arbitrary symbols (images that have a little meaning in and of themselves or relationship to the concept).
Pictograms, if well designed, have the potential to communicate complex information quickly and effectively. They are considered to be an international language, which is free of language problems, and can be understood by all sorts/types of individuals, with different educational, social and cultural backgrounds. In addition, they require little Ergonomics In Design, Usability & Special Populations I (2022) https://openaccess.cms-conferences.org/#/publications/book/978-1-4951-2106-7
space, are better perceived in unfavorable visibility conditions, are more rapidly perceived than text and they facilitate top-down processing. They also tend to increase the graphic materials’ attractiveness, as well as capture and maintain more the users’ attention (e.g., Bzostek & Wogalter, 1999; Laughery, Young, Vaubel, & Brelsford, 1993). However, the effectiveness of pictograms is affected by a number of variables, such as concept, context, depiction quality, age (e.g., Hancock, Rogers, Schroeder, & Fisk, 2004; Lesch, Horrey, Wogalter, & Powell, 2011), culture (e.g., Chan, Han, Ng, & Park, 2009; Piamonte, Abeysekera, & Ohlsson, 2001), previous knowledge and training (e.g., Lesch et al., 2011). For more information about symbols and pictograms, readers are referred to Wogalter, Silver, Leonard and Zaikina (2006).
Since bad solutions can lead to dangerous misunderstandings (e.g., give rise to unexpected and opposite behaviors in order to maximize the effectiveness of pictograms, a UCD approach is advisable and should be adopted so as to prevent the development of inadequate solutions from the earlier stages of conception. This paper focuses on the results of the comprehensibility judgment test and the perceived adequacy, effectiveness and preference questionnaire.
METHOD
For this study, we adopted an iterative and participative methodology, which was conducted by a multidisciplinary team (i.e., designers, ergonomists, psychologists and nurses) and divided into the following steps: (a) Background – focus group sessions, interviews and field observations (to determine the concepts to be conveyed, the hazard, the context); (b) Exploration (collection and analysis of benchmark examples); and (c) Iterative design and evaluation of solutions, involving methods such as the Comprehensibility Judgment Test (ISO 9186, 2001). The solutions considered adequate were later applied in the leaflets, which were then subjected to evaluation with potential users, through web-based questionnaires (Perceived Adequacy, Effectiveness and Preference Assessment Questionnaire). The study ended with the prototyping/ normalization of the leaflets.
Background
This first step was carried out in order to determine the concepts to be conveyed, as well as to obtain additional details about the hazard and the context of use. Therefore, we conducted interviews and focus group sessions with healthcare professionals, e.g., doctors, nurses, hospital managers and DGS members who were responsible for patient safety and from two partner hospitals in Lisbon, Portugal. Also, a literature review on hand hygiene, warnings and graphic design was done. The inputs gathered this step informed the design process.
Exploration The second step was intended to determine whether other solutions (pictograms or leaflets) or similar materials, to convey this type of information exist and/or could be used/ adapted for this purpose. For such, we collected and analyzed benchmark examples. We examined similar leaflets gathered from the Internet and from the experts involved in this study, as well as pictograms collections (e.g., Ravi Poovaiah1, Hablamos Juntos2).
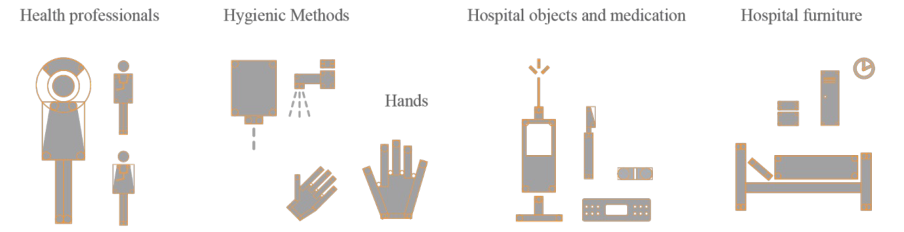
The Pictograms Design After having defined the concepts to be depicted, as well as the existent solutions to be analyzed, we began to create elementary pictograms, such as for the human figure (e.g., healthcare workers) and for specific objects (e.g., syringe, bistoury, and stretchers) (see Figure 1). Thereafter, as Otto Neurath did for the “Isotypes” (Lupton, 1989; Neurath, 1936, 1937), a combination of pictograms was considered in order to generate new concepts or actions (e.g., before touching a patient; before performing the clean or aseptic procedure) (see Figure 2). Rosa (2012) identified four methods which are usually used in the design of pictograms, i.e., the Modular Standardized Grid Method, the Modular In-Line Method, the Geometric Design Method and the Free Method. The Geometric Design Method was adopted for this study. This method is based on the use of geometrical components to create the pictograms, without
Ergonomics In Design, Usability & Special Populations I (2022) https://openaccess.cms-conferences.org/#/publications/book/978-1-4951-2106-7
Proceedings of the 5th International Conference on Applied Human Factors and Ergonomics AHFE 2014, Kraków, Poland 19-23 July 2014 Edited by T. Ahram, W. Karwowski and T. Marek
using modules or free-style drawings. Such a method creates silhouettes which depict the observable reality. Although the solutions generated in this way can have less formal coherence, they demonstrate a more faithful approximation to reality (Massironi, 1983). Furthermore, the respect for a series of design procedures, whether using modular or non-modular elements (formal syntactic attributes), articulated according to a generating principle (grid or skeleton), obtains better within and between formal coherence (Rosa, 2012).
Figure 1. Examples of elementary pictograms, designed according to the geometric method, which depict the human figure and objects.Figure 2. Examples of combined pictograms to depict concepts and actions.
Comprehensibility Judgment Test A set of variants for each concept resulted from the previous steps; i.e., exploration and pictograms design. Some variants were pre-existent solutions, from diverse authors, while others were brand-new solutions proposed by the design team, created having in mind the healthcare workers’ inputs gathered during the background step. Because of the number of alternatives collected, a rating procedure was required in order to cull down the set. The Comprehensibility Judgment Test, recommended by ISO 9186 (2001) standard, was adopted for this purpose.
Although a formal comprehension test (with open-ended questions) is considered the best option, the estimation procedure is a way to determine comprehension at a lower cost. This procedure is based on the individuals’ judgments on the percentages of the population that they expect would understand a given meaning (population estimation). Each respondent is asked to judge the comprehension of each pictogram and indicate a value between 0% and 100%. The attained mean value corresponds to the estimated comprehension of the pictogram (the median of the responses should be used if the responses are not normally distributed). Pictograms with the highest percentages were identified and later used in the final artwork. The purpose is to determine the most promising pictograms for further refinement.
Participants Twenty-one healthcare workers (4 males and 17 females) aged from 23 – 51 years old (M = 37.33, SD = 9.31) participated. All were recruited from Portuguese hospitals.
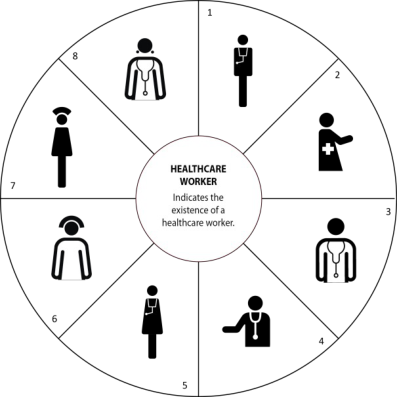
Procedure and materials The questionnaire was built using the Google Drive platform and was forwarded to a mailing list of healthcare workers. The candidate pictograms were positioned equally-spaced around a circumference (see Figure 3) and were identified by a code (i.e., a number). The name of the referent was written in the center, together with the probable context of use. Below was a line for the response (percentage of estimated comprehension). Participants were
Ergonomics In Design, Usability & Special Populations I (2022) https://openaccess.cms-conferences.org/#/publications/book/978-1-4951-2106-7
Proceedings of the 5th International Conference on Applied Human Factors and Ergonomics AHFE 2014, Kraków, Poland 19-23 July 2014 Edited by T. Ahram, W. Karwowski and T. Marek
instructed to write the percentage of people who, in their opinion, would correctly understand the meaning of each pictogram.
Figure 3. Sample page of Comprehensibility Judgment Test.
Results
Table 1 shows the mean values and standard deviation for each tested variant.
Table 1: Mean values (Standard Deviation) of the responses for each variant according to the referent.
Table available in the original PDF paper.
Ergonomics In Design, Usability & Special Populations I (2022) https://openaccess.cms-conferences.org/#/publications/book/978-1-4951-2106-7
Proceedings of the 5th International Conference on Applied Human Factors and Ergonomics AHFE 2014, Kraków, Poland 19-23 July 2014 Edited by T. Ahram, W. Karwowski and T. Marek
Regarding the referent – “Before touching a patient”: variant 6 (70.24%), variant 4 (64.52%) and variant 2 (51.67%) elicited the highest levels of estimated comprehension. Therefore, variant 6 was the selected one. For the referent – “Before clean/ aseptic procedure”: variant 2 (75.10%), variant 1 (56.43%) and variant 4 (47.95%) elicited the highest levels of estimated comprehension. Therefore, variant 2 was the selected one. Regarding the referent – “After body fluid exposure risk”, the highest values were attained by variant 3 (62.14%), variant 5 (61.38%) and variant 1 (57.43%). Variant 1 was the selected one because variant 3, which attained the highest value, was considered to have a high level of similarity to the one selected for the referent “Before touching a patient” and variant 5 was from a different author. Regarding the referent – “After touching a patient”, variant 1 (70.90%), variant 8 (44.19%) and variant 7 (41.00%) elicited the highest values of comprehension. In this case, variant 1 was selected. Finally, regarding referent – “After touching patient surroundings”, the three variants with the highest values were variant 7 (54.43%), variant 3 (39.05%) and variant 1 (34.90%). Variant 7 was the one selected. The chosen variants, together with their estimated comprehension values, are shown in Figure 4.
Figure 4 . Selected set of pictograms for depicting the “Five Moments of Hand Hygiene” and their estimated comprehension (%).
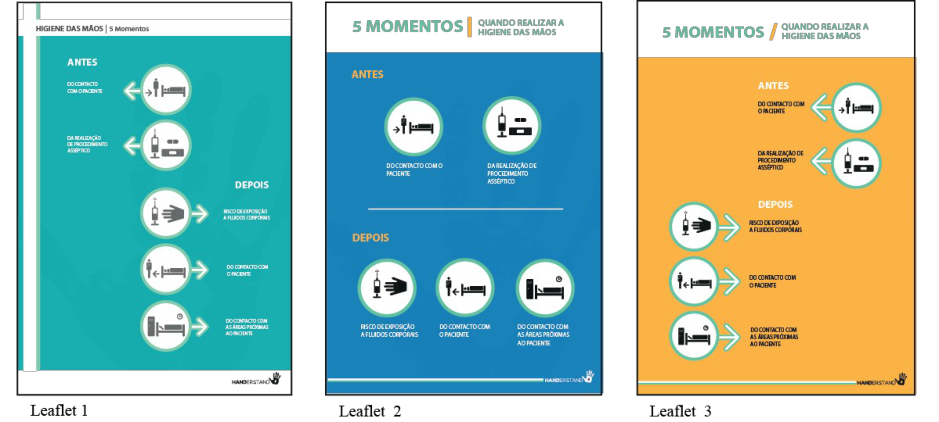
Leaflet adequacy and preference The set of pictograms, selected in the previous step, was then incorporated into the leaflets. Three versions of the leaflets were developed and subject to evaluation by potential users (see Figure 5). A questionnaire adapted from Sojourner and Wogalter (1997), was created to assess the participants’ perceptions on the leaflets’ adequacy and preference.
Figure 5. Variants of leaflets for the “Five Moments of Hand Hygiene”.
Ergonomics In Design, Usability & Special Populations I (2022) https://openaccess.cms-conferences.org/#/publications/book/978-1-4951-2106-7
Proceedings of the 5th International Conference on Applied Human Factors and Ergonomics AHFE 2014, Kraków, Poland 19-23 July 2014 Edited by T. Ahram, W. Karwowski and T. Marek
Participants Thirteen healthcare workers (2 males and 11 females) participated, ranging in age from 23 – 45 (M = 32.62, SD = 6.83). All were healthcare workers recruited from Portuguese hospitals and did not participate in the previous analysis.
Procedure and materials As it was previously done, the questionnaire was built using the Google Drive platform and was forwarded to a mailing list of healthcare workers. Participants were shown the leaflets and asked to rate them according to a 9-points Likert type scale, with the following questions:
1. Likelihood to read – If you notice this leaflet at your workplace, next to the alcoholic solution dispenser, how likely is it that you would read it? (0 = Extremely unlikely, 8 = Extremely likely). 2. Ease to understand – How easy is it to understand the information of hand hygiene on this leaflet? (0 = Extremely difficult, 8 = Extremely easy). 3. Layout effectiveness – How effective is the layout of leaflet in conveying the information of hand hygiene? (0 = Extremely ineffective, 8 = Extremely effective). 4. Overall preference – Globally, what is your opinion about this leaflet? (0 = I don’t like at all, 8 = I like it very much). 5. Pictograms comprehension – How effective are the pictograms in helping you understand/ comprehend the information? (0 = Extremely ineffective, 8 = Extremely effective). 6. Memory of Pictograms – How effective are the pictograms in helping you remember all of the information? (0 = Extremely ineffective, 8 = Extremely effective).
Results
Medians and interquartile ranges for the leaflets can be seen in Table 2. This table shows that leaflet two is the one with the highest average (6.7), followed by leaflet one with an average of 6. Leaflet three is the one which has the lowest average (5.7).
Table 2: Median (Interquartile Range) ratings by leaflet.
Memory of Pictograms 5.00 (1.58) 6.00 (3.00) 5.00 (3.00) Average 6 6.7 5.7
Participants’ ratings for each of the dimensions were analyzed using the Friedman Test. The Dunn-Bonferroni test was used to perform, when appropriate, the post hoc multiple comparisons. All tests of significance were conducted with an alpha level of .05. The results showed a significant effect for the type of leaflet for the dimensions ‘Likelihood to read’, χ2(2) = 6.437, p = .040, ‘Ease to understand’, χ2(2) = 6.054, p = .048, ‘Layout effectiveness’, χ2(2) = 8.647, p = .013, and ‘Overall preference’, χ2(2) = 8.977, p = .011. Despite the perceived differences, there were no significant differences on the dimension ‘Likelihood to read’ between the leaflet 1 vs. 2 (p = .607), 1 vs. 3 (p = .150), and 2 vs. 3 (p = 1.000). Similar results were found on the dimension ‘Ease to understand’ between the leaflet 1 vs. 2 (p = .350), 1 vs. 3 (p = 1.000), and 2 vs. 3 (p = .150), as well as on the dimension ‘Layout effective- ness’ between the leaflet 1 vs. 2 (p = .118), 1 vs. 3 (p = 1.000), and 2 vs. 3 (p = .118). However, for ‘Overall preference’, significant differences were found between leaflet 1 vs. 2 (p = .043), but not for the other pairs, 1 vs. 3 (p =1.000), and 2 vs. 3 (p =0.72). As expected, no significant differences were found for ‘Pictograms comprehension’, χ2(2) = 2.774, p = .280, and ‘Memory of Pictograms’, χ2(2) = 2.846, p = .283.
Ergonomics In Design, Usability & Special Populations I (2022) https://openaccess.cms-conferences.org/#/publications/book/978-1-4951-2106-7
Proceedings of the 5th International Conference on Applied Human Factors and Ergonomics AHFE 2014, Kraków, Poland 19-23 July 2014 Edited by T. Ahram, W. Karwowski and T. Marek
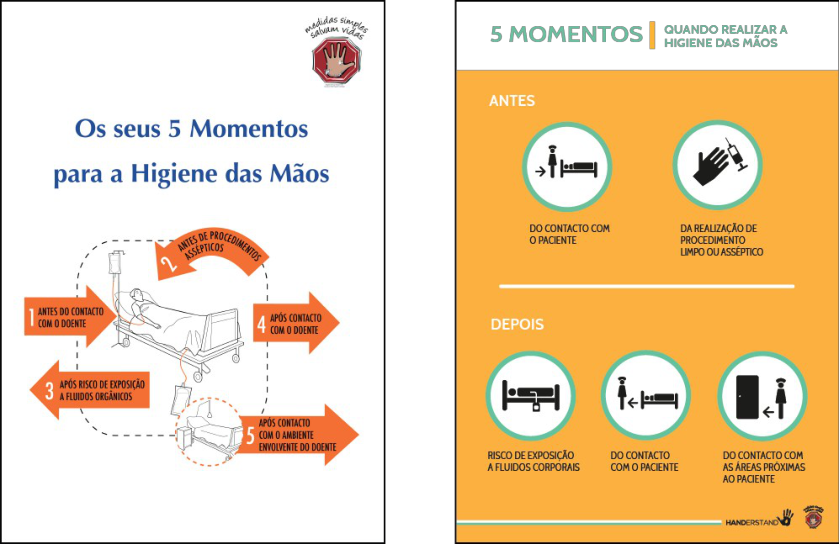
Figure 6. The current (left) and the new (right) leaflets for the “Five Moments of Hand Hygiene”.
CONCLUSIONS
The main goal of this work was to design an effective leaflet for the “Five Moments for Hand Hygiene”, targeted to healthcare workers, for the purpose of replacing the existing leaflet (see Figure 6 on the left). Since the results of previous analyses indicated that the current leaflet (which uses illustrations to depict the five moments of hand hygiene) is difficult in terms of understandability and memory, this study focuses on the design and evaluation of a set of pictograms intended to depict the key moments where hand hygiene is mandatory for healthcare workers. An user-centered design approach was adopted, involving the participation of health care workers through methods such as focus group sessions, the comprehensibility judgment test and a perceived adequacy, effectiveness and preference assessment questionnaire Collectively, the results of this study reveal that the designed variants for the leaflet attained higher ratings (between 5.00 and 7.00, where 8 was the maximum value possible) on the addressed dimensions (i.e., likelihood to read, ease to understand, layout effectiveness, overall preference, pictograms comprehension and memory). Variant 2 was the one selected (see Figure 5), but its background color was changed to yellow in order to increase noticeability (see Figure 6). The ‘pictograms understanding’ and ‘memory’ were the dimensions which attained the lowest ratings, which can mean that they still need to be refined. Furthermore, despite being exactly the same in all leaflets, the pictograms mean ratings vary across the variants presented. The reasons for this are not clear, but one explanation can be the influence of other design variables (e.g., layout, background color).
Some limitations of this study should be noted: the sample for the leaflet evaluation was small, which could limit the results’ generalization; the evaluation used web-based questionnaires; and the participants’ perceptions were assessed through scales. Therefore, further development and evaluation are required, for example, ask more/ different questions, and the use of the open-ended formal compression test should be applied in order to obtain compression scores, as well as the participants’ inputs for improving the solutions (e.g., Mayhorn & Goldsworthy, 2007). Also, other methods for evaluating the pictograms’ quality should be used to test other topics beyond comprehension, such as legibility, memorization and actual compliance. One possibility fir this type of research can be to conduct future studies with the solutions posted in real contexts of use (e.g., hospitals), since environmental Ergonomics In Design, Usability & Special Populations I (2022) https://openaccess.cms-conferences.org/#/publications/book/978-1-4951-2106-7
Proceedings of the 5th International Conference on Applied Human Factors and Ergonomics AHFE 2014, Kraków, Poland 19-23 July 2014 Edited by T. Ahram, W. Karwowski and T. Marek
clutter and situational variables (e.g., mental workload, time pressure, fatigue) might be critical factors in judging the leaflet’s quality. The results here may differ if the testing was done in a real-world context. Another possibility is to conduct compliance studies using a Virtual Reality-based methodology, which has been found as a promising approach for these types of studies (e.g., Duarte, Rebelo, Teles, & Wogalter, 2013).
To summarize, the user-centered design approach was found adequate for the study’s purpose. While education and training can increase the awareness and importance of hand hygiene for patient safety, efforts to improve the design of the information material (e.g., leaflets, warnings) must continue to be undertaken. These results may serve to improve the effectiveness of the present campaigns, which are intended to promote hand hygiene compliance among healthcare workers.
ACKNOWLEGDMENTS The authors would like to thank the Directorate-General of Health, Department of Quality in Health for their contributions. Thanks are also extended to the Patient Safety Teams from the Santa Maria and Beatriz Ângelo Hospitals, in Lisbon, Portugal, for their assistance in conducting the focus groups sessions, interviews and visits to the hospitals. Authors also want to acknowledge the assistance of Dr. Sibila Marques, from ISCTE-IUL, in the planning of the study, and Joana Cruz for her participation on the focus group and assistance with the literature review.
REFERENCES
Bzostek, J. A., & Wogalter, M. S. (1999). Measuring visual search time for a product warning label as a function of icon, color, column and vertical placement. In Proceedings of the Human Factors and Ergonomics Society 43rd Annual Meeting (Vol. 1 and 2, pp. 888-892). Santa Monica: Human Factors and Ergonomics Society. Chan, A. H. S., Han, S. H., Ng, A. W. Y., & Park, W. (2009). Hong Kong Chinese and Korean comprehension of
American security safety symbols. International Journal of Industrial Ergonomics, 39(5), 835-850. Direcção-Geral da Saúde. (2010-2011). Relatório: Campanha de Higiene das Mãos. Retrieved from http:// www . m in - saude.pt/ NR /rdonlyres/EE D F8 B F B -3F2E-423 B - A 4F9-17 C FE5 C 19 B F5/0/relatorio_ m aos_dgs.pdf Duarte, E., Rebelo, F., Teles, J., & Wogalter, M. S. (2013). Behavioral compliance for dynamic versus static signs in an immersive virtual environment. Applied Ergonomics. doi: http://dx.doi.org/10.1016/j.apergo.2013.10.004 Duggan, J., Hensley, S., Khunder, S., Papadimos, T., & Jacobs, L. (2008). Inverse correlation between level of
professional education and rate of handwashing compliance in a teaching hospital. Infection Control Hospital Epidemiology, 29(6), 534-538. Erasmus, V., Daha, T., Brug, H., Richardus, J., Behrendt, M., Vos, M., & Beeck, E. v. (2010). Sistematic review of studies in compliance with hand hygiene guidelines in hospital care. Infection Control Hospital Epidemiology, 31(3), 283-294. Hancock, H. E., Rogers, W. A., Schroeder, D., & Fisk, A. D. (2004). Safety symbol comprehension: Effects of
symbol type, familiarity, and age. Human Factors, 46(2), 183-195. Hubner, R., & Abdullah, R. (2006). Pictograms icons and signs: A guide to information graphics. New York: Thames & Hudson. International Organization for Standardization. (2001). Graphical Symbols - Part 1:Test Methods for Judged Comprehensibility and for Comprehension ISO 9186:2001. Geneva, Switzerland: International
Organization for Standardization. Jenner, E., Fletcher, B., Watson, P., Jones, F., Miller, L., & Scott, G. (2006). Discrepancy between self-reported and observed hand hygiene behaviour in healthcare professionals. Journal of Hospital Infection, 63(4), 418-422. Krampen, M. (1965). Signs and symbols in graphic communication. Design
Quarterly, 62, 31. Laughery, K. R., Young, S. L., Vaubel, K. P., & Brelsford, J. W. (1993). The noticeability of warnings on alcoholic beverage containers. Journal of Public Policy & Marketing, 12(1), 38-56. Lesch, M. F., Horrey, W. J., Wogalter, M. S., & Powell, W. R. (2011). Age-related differences in
warning symbol comprehension and trainning effectiveness: effects of familiarity, complexity, and comprehensibility. Ergonomics, 54(10), 879-890. Lupton, E. (1989). Reading Isotype. In V. Margolin (Ed.), Design Discouse: History, Theory, Criticism. Chicago: University of Chicago Press. Massironi, M. (1983). Ver pelo desenho: Aspectos técnicos, cognitivos, comunicativos. Lisboa: Edições 70. Mayhorn, C. B., & Goldsworthy, R. C. (2007). Refining teratogen warning symbols for diverse populations.
Ergonomics In Design, Usability & Special Populations I (2022) https://openaccess.cms-conferences.org/#/publications/book/978-1-4951-2106-7
Proceedings of the 5th International Conference on Applied Human Factors and Ergonomics AHFE 2014, Kraków, Poland 19-23 July 2014 Edited by T. Ahram, W. Karwowski and T. Marek
Birth Defect Research (Part A): Clinical and Molecular Teratology, 79(6), 494-506. Mollerup, P. (2005). Wayshowing: A guide to environmental signage principles and practices. Baden: Lars Muller Publishers. Neurath, O. (1936). International picture language: The first rules of ISOTYPE. London: Kegan Paul, Trench Trubner & Co. Neurath, O. (1937). Visual education: A new language. Survey Graphic: Magazine of Social Interpretation, 26, 25. Paiva, J. A., Pina, E., Silva, M. G., Nogueira, P. J., Silva, A. J., Rosa, M. V., . . . Oliveira, N. (2013). Portugal –
Controlo da Infeção e Resistências aos Antimicrobianos em números - 2013. Direcção-Geral da Saúde (Ed.). Retrieved from https://http:// www .dgs.pt/estatistica s -de-saude/estatistica s -de-saude/publicacoes/portu g al- controlo-da-infecao-e - resistencia-aos-anti m icrobianos-e m -nu m eros-2013-pdf.aspx Piamonte, D., Abeysekera, J., & Ohlsson, K. (2001). Understanding small graphical symbols: a crosscultural study.International Journal of Industrial Ergonomics, 27(6), 399-404. Pittet, D., Simon, A., Hugonnet, S., Pessoa-Silva, C. L., Sauvan, V., & Perneger, T. V. (2004). Hand hygiene among
physicians: Performance, beliefs, and perceptions. Annals of Internal Medicine, 141, 1-8. Rosa, C. (2012). Sistemas de informação pictográfica. O Universo dos pictogramas: métodos e procedimentos de design para obtenção de coerência formal. Doctoral thesis, Universidade Técnica de Lisboa, Lisbon, Portugal. Sojourner, R. J., & Wogalter, M. S. (1997). The influence of pictorials on evaluations of prescription medication
instructions. Drug Information Journal, 31, 963--972. Wogalter, M. S., Silver, N. C., Leonard, S. D., & Zaikina, H. (2006). Warning symbols. In M. S. Wogalter (Ed.), Handbook of Warnings (pp. 159-176). Mahwah, NJ: Lawrence Erlbaum Associates, Inc. World Health Organization. (2009). WHO Guidelines on Hand Hygiene in Health Care First Global Patient Safety
Challenge Clean Care is Safer Care. Geneva: World Health Organization.
Ergonomics In Design, Usability & Special Populations I (2022) https://openaccess.cms-conferences.org/#/publications/book/978-1-4951-2106-7
LISTED IN THE AHFE DIGITAL BOOKSTORE CATALOGUE
Explore the complete digital volume
Advances in Ergonomics In Design, Usability & Special Populations: Part I
Read this individual research paper free through the original publisher, or explore the full digital proceedings book.
ISBN 978-1-4951-2106-7
Explore this ISBN in the AHFE Bookstore ↗Listed in the July 2026 bookstore catalogue; search by ISBN to confirm current availability · Digital book purchase optional