JIN Huibina CAI Yaminb HONG Yuanc (2022). Visual Search in Airport-Security Screening. In: Advances in Ergonomics In Design, Usability & Special Populations: Part I. AHFE Open Access, vol. 18. https://doi.org/10.54941/ahfe100763
Security screening is a special visual search process. The quality of the airport-security screeners directly determines the safety of the passengers, and understanding is the premise of improvement, so, it is necessary to learn the visual search details in security screening. Two groups of subjects (screeners’ group and students’ group) were selected to conduct a screening simulation experiment, to test the rationality of the current security principle (from difficult to easy, from complex to simple) and the difference between the two groups. Tobii T120 eye tracker was used to record the eye movements in the process and some parameters were selected to characterize eye movements. The data visually showed that screeners’ accuracy rate was 28.7% higher than students’, and screeners’ experiment time was shorter on average. Moreover, the accuracy of the judgment increases were produced by changes of observers’ experience on airport-security screening, not by changes of the number of the fixation point, and there were significant differences on fixation time percent, saccade distance, judgment accuracy between the two groups. The screeners tended to examine the images systematically according to the principle of screening but the students group preferred to random searching.
INTRODUCTIONS According to an airport security research by DOT (United Stated Department of Transportation), the rate of lost detection of contraband is up to 68% (Dillingham, 2000). Recent concern over aviation security has focused interest on the role of airport-security screeners in keeping weapons and other potential threats off aircraft. The job of these screeners is to examine x-ray images of carry-on luggage to detect the presence of suspicious or threatening objects from their colors and appearances (Yu Ruifeng, 2013). Airport-security screening, a visual search process, is an important part of aviation safety, so, the quality of screeners’ work is closely related with the aviation safety.
Visual search is an important research content of Ergonomics, and currently, the related research is mainly achieved through the analysis of eye movement parameters. In terms of basic research, Wolfe found that the main effect of the complicated background was to slow the speed of target acquisition (Wolfe et al., 2002). Verghese and Neider proved that increasing the orientation difference between the paired noise and the signal improved detection evidently (Verghese & McKee, 2004; Neider & Zelinsky, 2006). Over et al., Najemnik & Geisler and Araujo et al. studied the relations between eye movements and visual search strategies and search patterns (Over et al., 2007; Najemnik & Geisler, 2001; Araujo, 2005). Current visual search research centers on the areas of reading (Goonetilleke et al., 2002; Ojanpää, 2002), driving cars (Christ & Abrams, 2006) and web page designing, focuses on the eye movement features in the process of visual searching and impacts of a variety of factors, such as type size, car speed and sign text (YUAN Wei et at., 2011), the information density (LIU Jie & Pei luen Patrick RAU, Ergonomics In Design, Usability & Special Populations I (2022)
2006), page layout (SHI Jin-fu et al., 2008) on visual search performance. In the area of security screening, Smith, Redford and Washburn (Smith et al., 2005) simulated airport x-ray baggage inspection, and found that accuracy rate improved while test images repeated but it dropped sharply when unfamiliar targets from the same categories appeared. Simulation of x-ray Baggage Inspection Wolfe and others studied the contraband probability impact on search performance (Wolfe et al., 2005). McCarley found that sensitivity increases were produced entirely by changes in observers’ ability to recognize target objects, not by changes in the effectiveness of visual scanning (McCarley et al., 2004).
The above researches focused on the analysis of related factors impacted on the results from a macro point of view, but less attention was given to the process of the visual search. In this paper, in terms of the details, Tobii T120 eye tracker was used to record the eye movements in the process of simulating security screening experiments, and several parameters were selected to characterize eye movements. Screeners’ visual search data in the process of judging was analyzed to examine the validity of the current security screening principles. Summarizing the visual search patterns of good screeners (whose judgment accuracies were higher, who use less time to judge), could provide some suggestions for novice training. The experimental results could also help improve the principles in airport-security screening.
METHOD
Subjects A total of seven male subjects were selected in the experiment, divided into two groups: students group and screeners group, including four students majoring in security screening department and three airport security screeners. All had normal or corrected-to-normal visual acuity and normal color vision. The students were all freshmen, and they were numbered with P01~P04. All the screeners had more than five years of working experience, and they were numbered with P05~P07.
Apparatus and Stimuli Stimuli were presented on a 17-in. monitor with a resolution of 1024×768 pixels. Eye movements were recorded with Tobii T120 eye tracker with temporal resolution of 120 Hz and spatial resolution of 0.3[Equation or mathematical symbol available in the original paper PDF]. An eye movement was classified as a saccade either when its distance exceeded 0.3° and its velocity reached 50°/s or when its distance exceeded 0.3° and its acceleration reached 9500°/s2. Observers viewed displays from a distance of 55~65cm, with a head moving range of 30cm horizontally, and 22cm vertically.
Stimuli were produced from chromatic x-ray images, with a resolution of 500×520 pixels, provided by the Tianjin Binhai International Airport. Images of 10 bags served as backgrounds, and these images were numbered with B1~B10. All bags were moderately to densely cluttered with a variety of objects (e.g., clothes, hair dryers, hangers, and so on). Of all the bags, four contained contraband, e.g., batteries, explosive and tinderboxes. These images were displayed in a fixed order.
Procedure All the subjects did the same experiment. The subjects’ task was to judge the stimulus images for the presence of contraband. Each time, there was only one image showed on the screen. To each subject, he reported whether the image contained contraband and clicked the left mouse button once he finished the judgment, then the next image would be showed on the screen automatically. A subject finished his experiment when all the images were judged. The experiment ended when all the subjects finished judgment. Subjects’ judgment results were recorded by the same experimenter.
The whole processes were as follows: i) Before the experiment, each subject should finish a form including personal information, such as age, sex, qualifications.
ii) Kinds of contraband information and detailed operation process were explained by the experimenter. The Ergonomics In Design, Usability & Special Populations I (2022) experimenter should avoid give information about the images.
iii) Did pupil calibration for subject and adjusted the location of him properly.
iv) The experiment begun, participants started to search and judge, and the experimenter started to record the judgment results of the subject.
Parameters for characterizing eye movements In order to characterize eye movements, referring to some studies (McCarley et al., 2004; ZHANG Xian-feng & YE Wen-ling, 2006; LIU Zhong-qi et al., 2006), the author selected five parameters: the first fixation time, the number of the fixation point, the percentage of the fixation time, the saccade distance, and fixation duration. Base on the differences of the two groups’ data on the five parameters, their visual search features in the process of the simulation were found. The five parameters were defined as follows:
i) The first fixation time: The first time when the subject located his sight in the area of an interest.
ii) The number of the fixation point: The number of the fixation point in the whole process of the screening simulation experiment.
iii) The percentage of the fixation time: The percentage of the fixation time in the whole process of the experiment.
iv) The saccade distance: The length of the saccadic trajectory in a period of time.
v) Fixation duration: The duration of the gaze.
RESULTS
In the process, the eye movements were recorded by Tobii T120 eye tracker, and the subjects’ judgment results were recorded by the experimenter. The judgment results were as follows: To screeners (P05~P07): the error numbers of the judgment were 1, 1, 0, and the average was0.67;
To students (P01~P04): the error numbers were 3, 2, 2, 4, and the average was 2.75, which was 4.125 times of that of the screeners’.
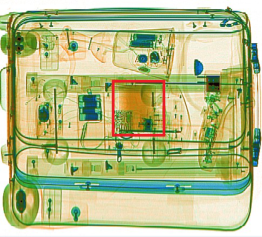
Comparison of the first fixation time These 10 images contained 13 areas of interest marked with A1, A2,[Equation or mathematical symbol available in the original paper PDF], and A13. All the areas of interest (AOIs) were drawn by security screening experts. The AOIs that contained contraband information were mark with a rectangle (Figure 1 (a)), while others were marked with an ellipse (see Figure 1 (b)), and one image may contain multiple AOIs (see Figure 1).
(a) Containing contraband (explosive) (b) Containing no contraband
Figure 1. Diagram of AOIs Ergonomics In Design, Usability & Special Populations I (2022)
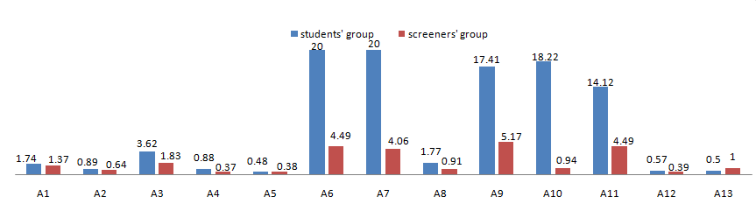
The data of the first fixation time of all the subjects were extracted and the averages of the two groups’ were calculated (Note: the first fixation time would be recorded as 20ms if the subject did not observe the AOI in the process of the experiment). Results were showed in Figure 2:
Figure 2. Compare of the first fixation time
Figure 2 showed that screeners’ averages were lower than that of students’ in all the AOIs except A13, indicating that the former found these AOIs earlier. To A6, A7, A9, A10 and A11, the averages of the students’ group were so high that were close to 20ms, indicating that at least one member in the students’ group did not find all these AOIs. To all the AOIs, the averages of the screeners’ group were much lower than 20ms, indicating that all the members found all the AOIs. To A13 (in B10), the students’ average was lower, which was surprisingly. The video recorded by Tobii T120 eye tracker showed that P03’s sight was in A13 after he finished the judgment of B9, which meant the first fixation time to A13 was 0ms, and this situation caused the abnormal result in A13.
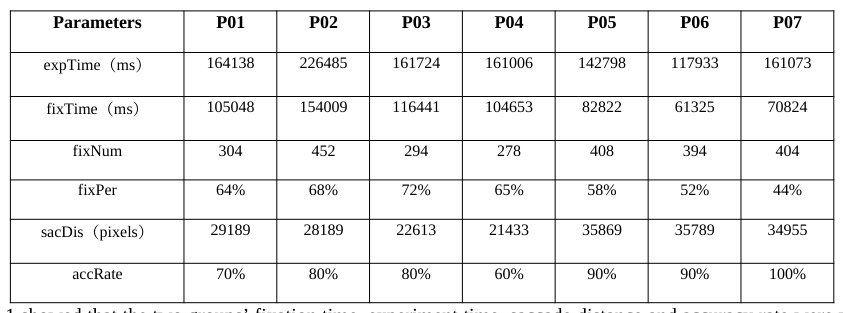
Analysis of experimental data In the process of security screening, gaze and saccade are the two main types of eye movements. Gaze was defined as an eye behavior that needed eyes to aim at a target, letting its image stay on the fovea, to achieve the clearest vision (Tagare et al., 2001; Dewar & Olson, 2001). A saccade is defined as a fast motion of the eyes to change the gaze point between fixation points (Underwood & Chapman, 2003), and its main function was to move a new content of the target to the fovea (Underwood et al., 2002). The data were simply processed and all the subjects’ details, including experiment time (expTime), fixation time (fixTime), the number of the fixation point (fixNum), the percentage of the fixation time (fixPer), the saccade distance (sacDis) and the accuracy rate (accRate) were listed in Table 1.
Table 1: The experiment data of the subjects
Table 1 showed that the two groups’ fixation time, experiment time, saccade distance and accuracy rate were with a high discrete level. In order to give an intuitive comparison of the two groups, Mann-Whitney U test was adopted. The Mann-Whitney U test is a nonparametric test that allows two groups or conditions or treatments to be compared without making the assumption that values are normally distributed. The results of U test were show in Table 2.
Table 2: The results of Mann-Whitney U test
Table available in the original PDF paper.
Ergonomics In Design, Usability & Special Populations I (2022)
Because the sample size was small, making the decision must take exact probability of U test into consideration. In this test, the significance level was 0.05. From Table 2, the two groups had no significant difference on experimental time, but had significant difference on the percentage of the fixation time, the saccade distance and the accuracy rate.
Megaw divided a visual search process into four stages: search, detect, judgment, and output decision in his visual search process model (Megaw & Richardson, 1979). In a visual search process, completing the first two stages mainly relies on saccades, judging must relies on gaze, and the output decision stage relies on the previous three stages. To the eye movement data in this experiment, the subject’s fixation and saccades could reflect his cognition of the contraband information in the image synthetically, and the saccade distance could reflect a subject’s comprehensiveness of his visual search. Table 1 and Table 2 indicated that the screeners’ subjective feeling of the task difficulty was smaller, and they had a more comprehensive visual search. Analyses were as follows.
The airport-security screeners all had at least five years of working experience, and they would not see back to it after finished the judgment of an area of the image, while the situation of the students was not so, so on average, the screeners needed less time to complete the same task. That there was no significant difference on experimental time may caused by the low resolution of these images. The airport-security screeners were all familiar with the appearances and colors of the contraband, so they did visual search fast and comprehensively, and this was the reason for their low percentage of the fixation time, long saccade distance and high accuracy rate.
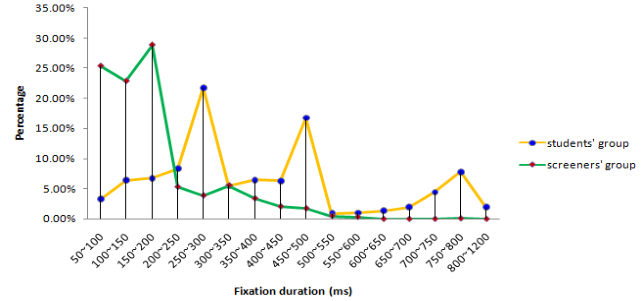
Analysis of the fixation duration Observer acquires information and processes it repeatedly when he is in a state of gazing. Especially to the role of airport-security screeners, they would suspend the image for further observation if he could not make a judgment immediately. Therefore, to the subjects, the fixation duration was a direct response to the subjective difficulty level of the task. The numbers of the different fixation durations were different, and their percentages were listed in Figure 3.
Figure 3. Comparison of the two group’s fixation duration
From the above diagram: i) The both of the two groups’ fixation durations were not evenly distributed. Students’ varied from 50ms to 1200ms, while screeners’ varied from 50ms to 600ms.
ii) To the students’ group, the fixation durations lasting 250~300ms accounted for the largest proportion (21.76%), followed by 450~500ms (16.67%); to the screeners’ group, the durations lasting 150~200ms accounted the highest Ergonomics In Design, Usability & Special Populations I (2022) proportion (28.86%), followed by 50~100ms (25.37%).
iii) The average fixation duration of the students’ was longer.
iv) In terms of the durations shorter than 100ms, students’ accounted only 11%, but screeners’ 89%, much higher than the former.
During eye movements, the more difficult the information is, the longer the gaze lasts (Tagare et al., 2001; Dewar & Olson, 2001). The above results indicated that one’s subjective feeling of the task was related to his experience. The students had no experience of the real airport-security screening, and they had little knowledge about the contraband, so they felt more subjective difficulty and needed longer fixation time to examine x-ray images of carry- on luggage with making more errors.
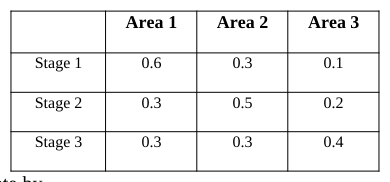
Analysis of Visual Search To learn the sequence of the searching, each image (B01, B03, B07, and B10) that contained contraband information was divided into three areas (Area 1, Area 2 and Area 3) according to complexity. Area 1 was the most complex area, Area 3 was the least complex area, and the complexity of area 2 was between theirs. Then, the process of visual search was divided into three stages: Stage 1 (from the beginning to the half of the experiment time), Stage 2 (from the half to the 5/6) and Stage 3 (from the 5/6 to the end of the experiment). At last, 10 experts were invited to give scores for these fixations in different regions during different stages based on the principle of airport-security screening------from difficult to easy, from complex to simple. The scores should not be larger than 10, or less than 1. If he thinks it is reasonable to observe the area during the stage, he gives a high score; otherwise, he gives a low score. The weight (Wij) for the fixation point in stage i (i=1, 2, 3), area j (j=1, 2, 3) was calculated as follows:
Equation reproduced from the original PDF.
Where Gij represented the sum of the experts’ scores for stage i, area j; and Gi represented the sum of the experts’ scores for stage i. The weights were in Table 3.
Table 3: Weights of the stages in different areas Area 1 Area 2 Area 3
To a subject, his score was calculate by
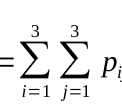
Equation available in the original PDF paper.
Equation reproduced from the original PDF.
Where pij=nij/ni, where nij represented the number of the fixation points in stage i and area j, ni represented the number of the fixation points in stage i. Each subject’s score was showed in Table 4.
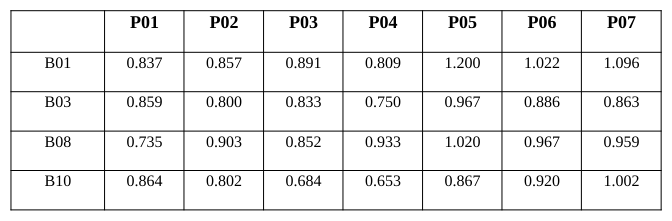
Table 4: Scores of each subject P01 P02 P03 P04 P05 P06 P07
Ergonomics In Design, Usability & Special Populations I (2022)
From the above table, it could be seen that screeners (P05, P06 and P07) that screeners scored higher than students, which was in accordance with the expectations. The result was caused by the difference of the two groups’ different experience level. The screeners tended to examine the images according to the principle of airport-security screening systematically and orderly, but the students did this in a random order. The rationality of the current security principle was proved, and the result was accordance with Drury’s research (Drury, 1990).
CONCLUSIONS
In this study, we analyzed the eye movement data of the experienced screeners’ and the inexperienced students’ in a simulated airport-security inspection task. As expected, the screeners outperformed the students. The screeners tended to examine the images systematically, but the students in a random order. The result also proved the rationality of the current security principle to some extent.
The experimental conclusions may provide some suggestions for novice training. Similar simulated experiments may help improve the principles of airport-security screening if a number of experienced screeners think it unreasonable. But the number of the subjects in this study was so small that the results might be fortuitous, so choosing more subjects to examine more images is expected.
ACKNOWLEDGMENTS: This research is supported by Research Fund of Civil Aviation University of China (No. 2012QD20X). Moreover, we are very thankful to Tianjin Binhai International Airport for their providing the x-ray images of carry-on luggage. Then, we thank the airport-security screeners for their participation in the experiment. We also thank the experts in security screening for their valuable help with the image analyses.
REFERENCES
Araujo C, Kowler E, Pavel M. (2001), “Eye movements during visual search: The costs of choosing the optimal path”, Vision Research, Volume 41 No.25.pp: 3613–3625. Christ S E, Abrams R A. (2006), “Abrupt onsets cannot be ignored”, Psychonomic Bulletin and Review, Volume 13 No.5.pp:
875–880. Dewar R. E, Olson P. L. (2001), “Human Factor in Traffic Safety”, Tucson: Lawyers and Judges Publishing Company, Inc. Dillingham G L. (2000), “Aviation Security: Slow Progress in Addressing Long-standing Screener Performance Problems”, Testimony Presented before the Subcommittee on Aviation, Committee on Transportation and Infrastructure, House of Representatives, Washington, DC. Drury C G. (1990), “Visual Search in Industrial Inspection”, In: Brogan, D. (Ed.), Visual Search. Taylor and Francis, London. Goonetilleke R S, Lau W C, Shih H M. (2002), “Visual search strategies and eye movements when searching Chinese character
screens”, International Journal of Human-Computer Studies, Volume 57 No.6.pp: 447-468. Najemnik J and Geisler W S. (2005), “Optimal eye movement strategies in visual search”, Nature, Volume 434 No.7031.pp: 387-391. LIU Jie, Pei luen Patrick RAU. (2006), “A Study on the User Visual Search Performances for Web Visual Design”, Chinese
Journal of Ergonomics, Volume 12 No.2.pp:1-3. LIU Zhongqi, YUAN Xiugan, LIU Wei. (2006), “Quantitative measuring method of pilots’ attention allocation”, Journal of Beijing University of Aeronautics and Astronautics, Volume 32 No.5.pp:518-521. McCarley, J.S., Kramer, Arthur F.,Wickens, Christopher D., Vidoni, Eric D., Boot, Walter R. (2004), “Visual skills in airport-
security screening”, Psychological science, Volume 15 No.5.pp: 302-306. Megaw E D, Richardson J. (1979), “Eye Movements and Industrial Inspection”, Applied Ergonomics, Volume 10 No.3. pp: 145-
154. Neider M B, Zelinsky G J. (2006), “Searching for Camouflaged Targets: Effects of Target- background Similarity on Visual Search”, Vision Research, Volume 46 No.14.pp:2217-2235. Ojanpää H, Nasanen R, Kojo I. (2002), “Eye movements in the visual search of word lists”, Vision Research, Volume 42
No.12.pp: 1499-1512. Over E A B , Hooge I T C, Vlaskamp B N S and Erkelens C J. (2007), “Coarse-to-fine eye movement strategy in visual search”, Vision Research, Volume 47 No.17.pp:2272-2280. Underwood G, Chapman P. (2003), “Driving experience attentional focusing and the recall of recently inspected events”,
Transportation Research, Volume 6 No.4.pp: 289-304. SHI Jin-fu, CAO Xiao-hua, WANG Gang. (2008), “An Eye Movement Study on Visual Search of Web Page Layout”, Chinese Ergonomics In Design, Usability & Special Populations I (2022)
Journal of Ergonomics, Volume 14 No.4.pp:1-3. Smith JD, Redford J S, Washburn D A. (2005), “Specific-token Effects in Screening Tasks: Possible Implications for Aviation Security”, Journal of Experimental Psy-chology: Learning, Memory, and Cognition, Volume 31 No.6.pp: 1171-1185. Tagare H. D, Toyama K, Wang J. G. (2001), “A maximum-likelihood strategy for directing attention during visual search”,
IEEE Transactions on Parrern Analysis and Machine Intelligence, Volume 23 No.5.pp:490-500. Underwood G, Chapman P, Bpwdem K et.al. (2002), “Visual search while driving: skill and awareness during inspection of the scene”, Transportation Research, Volume 5 No.4. pp: 87-97. Verghese P, McKee S P. (2004), “Visual Search in Clutter”, Vision Research, Volume 44 No.12.pp: 1217-1225. Wolfe JM, Horowitz T S, Kenner NM. (2005), “Rare Items Often Missed in Visual Searches”, Nature, Volume 435 No.1.pp:439-
450. Wolfe JM, Oliva A, Horowitz T S, et al. (2002), “Segmentation of Objects from Backgrounds in Visual Search Tasks”, Vision Research, Volume 42 No.28.pp: 2985-3004. YU Ruifeng, Cheng Yuchen. (2013), “Empirical Study on the Environment of Subway Security-Checking Task and Its
Improvement”, Industrial Engineering Journal, Volume 16 No.1.pp:14-18. YUAN Wei, FU Rui, MA Yong. (2011), “Effects of vehicle speed and traffic sign text height on drivers’ visual search patterns”, Journal of Traffic and Transportation Engineering, Volume 24 No.1.pp:119-126. ZHANG Xianfeng, YE Wenling. (2006), “Review of oculomotor measures in current reading research”, Studies of Psychology
and Behavior, Volume 4 No.3.pp:236-240.
Ergonomics In Design, Usability & Special Populations I (2022)
LISTED IN THE AHFE DIGITAL BOOKSTORE CATALOGUE
Explore the complete digital volume
Advances in Ergonomics In Design, Usability & Special Populations: Part I
Read this individual research paper free through the original publisher, or explore the full digital proceedings book.
ISBN 978-1-4951-2106-7
Explore this ISBN in the AHFE Bookstore ↗Listed in the July 2026 bookstore catalogue; search by ISBN to confirm current availability · Digital book purchase optional