Alexey Anokhin, Alexey Ivkin (2022). Evaluation of Ecological Interface Design for Supporting Cognitive Activity of Nuclear Plant Operators. In: Advances in Ergonomics In Design, Usability & Special Populations: Part I. AHFE Open Access, vol. 18. https://doi.org/10.54941/ahfe100773
National Research Nuclear University ‘MEPhI’ Obninsk Institute for Nuclear Power Engineering Studgorodok 1, Obninsk 249040 Kaluga Region, Russian Federation ↗
The paper describes procedure and results of evaluation of the Ecological display for monitoring and control of the drum-separators at the RBMK-type NPP. This task is characterized by heavy cognitive workload and insufficient human-machine interface. Trial operation of the proposed Ecological display has been carried out during four months at the full scope simulator of the Leningrad NPP with participation of six licensed control room operators. Four exercises and three realistic scenarios were used to collect experimental data. After execution of the tasks the participants filled the questionnaire.The results from the trial operation demonstrate that the ecological interface essentially quickens response time and execution of tasks (in more than 80% of all cases). The Ecological display provides operator with efficient feedback which ensures moderate increase of accuracy and smoothness of control actions. It was revealed that the use of the ecological interface four time reduces frequency of errors compared with the use of conventional interface. However, the efficiency of the Ecological display depends on situation. We revealed that the additional logical processing and the additional director pointer are required to prevent operator from delays and too sharp control actions
The results from the trial operation demonstrate that the ecological interface essentially quickens response time and execution of tasks (in more than 80% of all cases). The Ecological display provides operator with efficient feedback which ensures moderate increase of accuracy and smoothness of control actions. It was revealed that the use of the ecological interface four time reduces frequency of errors compared with the use of conventional interface. How- ever, the efficiency of the Ecological display depends on situation. We revealed that the additional logical process- ing and the additional director pointer are required to prevent operator from delays and too sharp control actions Keywords: Ecological interface, Nuclear Power Plant, Empirical Evaluation, Cognitive Activity
INTRODUCTION
Nuclear Power Plant (NPP) is a technological system where humans meet with high complexity, responsibility and threats. In order to identify situation the operators have to bring together and to compare numerous items of perma- nently updated information. Technological complexity of NPP can set such conditions under which the behaviour of some process parameters is not like it is anticipated by operators. In such situations operators have to perform nu- merous mental operations and to take into account large number of logical conditions. This can cause cognitive overload especially when control actions to be run under time pressure. “Ecological interface” is one of the most ef- fective ways to support operators in such situations.
This article describes a practical application of the ecological interface framework to support Main Control Room (MCR) operator in performance of a particular task related with monitoring and control of water level in the drum- separator of the RBMK-type NPP. We created the Ecological display using the results from prior functional, task and empirical analysis. Then we developed and conducted evaluation study which purpose was to estimate how much the proposed EID improves reliability and situational awareness.
Ergonomics In Design, Usability & Special Populations I (2022) https://openaccess.cms-conferences.org/#/publications/book/978-1-4951-2106-7
Ecological Interface Design Ecological Interface Design (EID) is a theoretical framework proposed by K. Vicente and J. Rasmussen (1992) in the early 1990s for designing human-system interface in complex work domain, such as power plant control room or airplane cockpit. The main idea of the EID framework is to provide operator with such an interface that supports cognitive activity, especially when unanticipated and unfamiliar events are occurring. There are two main features which make distinction between ecological interface and any other kind of interface.
First feature of the EID is an intuitively understandable and easily recognizable visual image which can be perceived by human operator at a glance. Second feature is that the EID is intended to support the knowledge-based behaviour which takes place when trained skills and clear operational rules or procedures are absent. In such situations human has to perform numerous mental operations in order to understand physical processes and to recognize state of sys- tem. It means that the visual image perceived by operator must provide not only obvious representation of techno- logical system but also facilitation of mental operations.
It seems fair to suppose that the main theoretical precursor of EID is the gestalt psychology which maintains that hu- man perceives objects in their entirety before perceiving their individual parts (this phenomenon is called “gestalt ef- fect”). In other words, the gestalt effect is a visual recognition of figures and whole forms instead of just a collection of simple lines and curves (Lehar, 2003). An outstanding contribution to practical application of the main gestalt psychology ideas has been made by R. Arnheim (1969) who supposed and experimentally proved the phenomenon of “visual (or perceptual) thinking”. In according with his hypothesis, humans are able to make up a conclusion just on the base of perception of visual image shape instead of mental analytical processing of perceived information. In other words, properly designed shape can unload brain by partial removing of mental activity to perception level.
Some patterns and recommendations developed as a result of generalization of decennial ecological interface design experience have been described by C. Burns and J. Hajdukievicz (2004). They described the patterns providing transference of such mental operations as comparison, summation, etc. to the perception level. However proper us- age of these patterns is possible only jointly with Work Domain Analysis (WDA) which purpose is to structure com- plex system operation in several levels of abstraction. The “Abstraction Hierarchy” suggested by Rasmussen (1985) consists of five levels representing functional purposes, abstract functions, generalized functions, physical functions and physical forms.
WDA does not take into account operator’s tasks because the EID generally intends to support problem solving dur- ing complicated unexpected situations. Nevertheless, some another techniques such as various modifications of the Hierarchical Task Analysis (HTA) (Stanton, 2006) and Cognitive Work Analysis (CWA) (Vicente, 1999) can be used when ecological interface is being designed for supervisory control of carefully explored system. The sorts of information which can be gathered using system and task analysis are identified in (Jamieson et al., 2007).
The EID framework was successfully tested for various and diverse problem domains, such as aviation, railway, sea and automotive transport, petrochemical and power plants, food industry, financial systems, etc. There is some expe- rience in designing of ecological interface for NPP supervision (Burns et al., 2008; Lau, Veland et al., 2008). The EID for the secondary (non-nuclear) systems of BWR-type NPP has been successfully tested using full-scope simu- lator (Lau, Jamieson et al., 2008). The present paper provides an approach to evaluation of innovative interface for NPP process control.
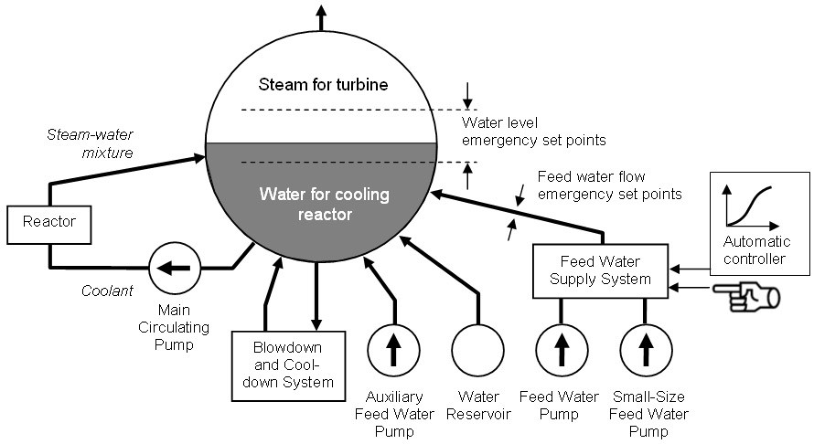
The Task of Drum-Separator Control The Drum-Separator (DS) is an extremely important system providing steam for the turbine and water for cooling of the reactor. Water flowing through the reactor boils and turns into a steam and water mixture. This mixture is re- leased to four DSs where steam and water to be separated from each other. The DS is a horizontal cylindrical vessel approximately 30 metres long and 2,3 meters in diameter. Working pressure and temperature in the DS are 6,57 MPa and 284 [Equation or mathematical symbol available in the original paper PDF]C, respectively. These parameters make condition nearly the saturation line. The steam separated in the DS is transferred to the two turbines after which the steam is condensed. Then the condensate is deaerated and pumped by the feed water pumps into the bottom part of the DSs where the feed water mixes with the water sepa- rated from the steam.
DS is quite complex system which is very sensitive to any disturbance appearing at NPP. Functional analysis based on the structure approach (Anokhin, 2009) revealed a few potential suppliers and consumers of water and steam (Fig. 1), namely
Main, Small-Size and Auxiliary Feed Water Pumps supply the DS with water, Ergonomics In Design, Usability & Special Populations I (2022) https://openaccess.cms-conferences.org/#/publications/book/978-1-4951-2106-7
Water pressure Reservoirs provide waters in severe emergency conditions,
the Blowdown and Cooldown System takes some amount of water from DS and returns it after cleaning,
the Turbine Systems are the main consumers of the steam from DS,
the Reactor takes water and returns it after heating and boiling.
Figure 1. Simplified diagram of the flows through the DS
Operators have to monitor carefully the level of water in the DSs and must avoid approaching setpoints which acti- vate reduction of power or emergency shutdown. In normal conditions the level is maintained by the automatic con- troller. However in the case of the controller failure or during low levels of the reactor power the level of water has to be controlled manually. In order to compensate a disturbance the operator should govern one of three regulating valves and adjust feed water flow until the material balance between all incoming and outcoming flows is estab- lished. When reducing the flow the operator have to take into account the permissible minimum of the flow rate which value depends on current reactor power. The task is complicated by the presence of nonlinearity, time lags and paradoxical behaviour of water level.
All the cognitive operations to be performed by operator were analysed in terms of required information, complex- ity, time pressure, human-machine interface and existing means to attract operator’s attention. Also the previous op- erational experience was reviewed, which demonstrates that operators often misunderstand situation and perform wrong control actions resulting in reactor shutdown.
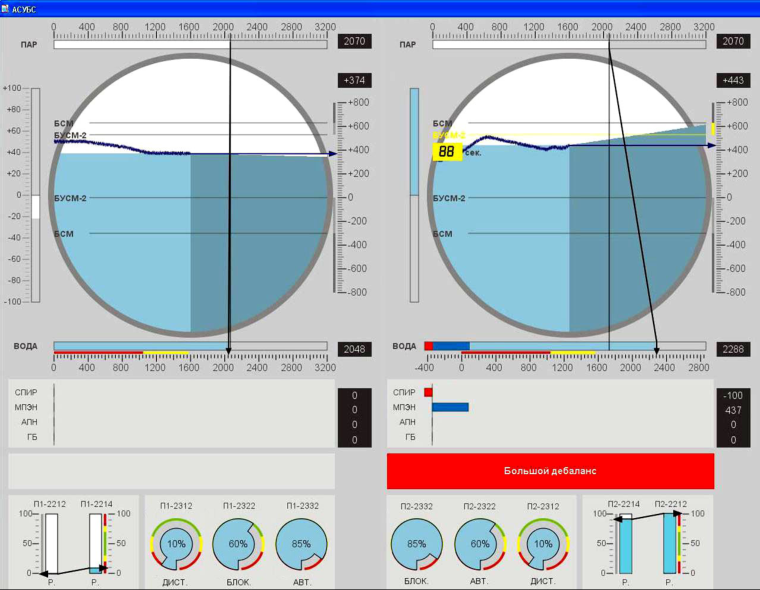
The EID to Support Cognitive Activity Fig. 2 shows the Ecological display developed for facilitation of the DS monitoring and control. The visual format includes 22 graphical elements, such as numerical display, vertical and horizontal bar graph, circular graph, movable pointer, trend curve, etc. Top half of the display contains two circles depicting the DSs. Level of water is indicated by the scale located on the right of each circle. The grey horizontal lines crossing the circle indicate the emergency setpoints. Color of the corresponded line changes from grey to red or yellow when water level approaches a setpoint. Simultaneously, the digital indicator counting the time available for compensative actions is activated.
Water is shown by blue filling of the circle. Blue region is divided into two parts. The left side filled by light blue contains a historical information (trend chart) about behaviour of water level during previous three minutes. The right side filled by blue-gray shows a predicted trend of water level calculated for next three minutes.
The horizontal bar graph above the circle indicates current outcoming steam flow rate. This parameter depends on the reactor thermal power and the operator cannot change it. The horizontal bar graph below the circle is a cumula- tive graph that summarizes all the incoming and outcoming water flow rates. The line connecting top and bottom bar graphs indicates the material balance. In normal situation this line has vertical orientation.
Bottom region of the display contains the horizontal bar graphs which indicate flow rates of feed water incoming Ergonomics In Design, Usability & Special Populations I (2022) https://openaccess.cms-conferences.org/#/publications/book/978-1-4951-2106-7 from particular suppliers, the alarm tile and the regulating valves position indicators.
Figure 2. Ecological display supporting the task of monitoring and control of the drum-separators
METHOD
In order to evaluate efficiency and usability of the proposed Ecological display, the following hypothesis were ex- amined: 1) The display and its components are intuitively obvious to operators without any additional explanations; 2) All graphic forms and layout are easy perceivable and don’t break established professional user stereotypes; 3) Operators are able to recognize imbalance and trend of water level sooner than using conventional interface; 4) The display reduces mental load and provides more efficient feedback from control actions in comparison with conventional interface; 5) The display quickens identification of source of imbalance and facilitates decision making in comparison with conventional interface; 6) The ecological interface reduces probability of errors committed by operators during control of water level.
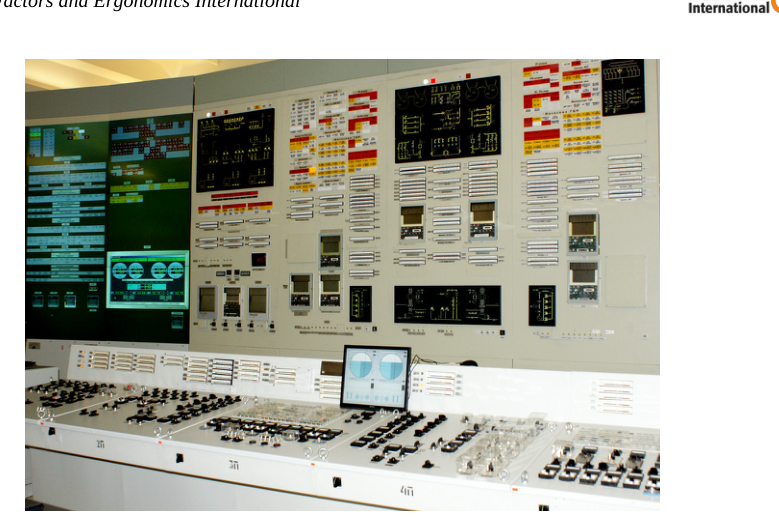
An empirical study was carried out at Leningrad NPP in order to confirm or refuse the mentioned hypothesis. The EID was installed in the Full Scope Simulator (FSS) that is a replica of real Main Control Room (MCR) at the Leningrad NPP (Fig. 3). Six experienced licensed MCR operators (average age is 42 years) and two FSS instructors were recruited for experimental evaluation. All the operators have the position of the Unit Operator (average experi- ence is 5,5 years) who is responsible for control of the drum-separators, the steam pipelines and the feed water preparation and supply system.
Evaluation programme consisted of three experimental studies, namely: 1) the Ecological display familiarization of operators followed by interviewing, 2) execution of evaluation exercises, and 3) running of realistic scenarios.
Ergonomics In Design, Usability & Special Populations I (2022) https://openaccess.cms-conferences.org/#/publications/book/978-1-4951-2106-7
Figure 3. Ecological display in the FSS (LCD VDU with resolution of 1280×1024 pixels and screen size of 300[Equation or mathematical symbol available in the original paper PDF]375 mm is used) Familiarization and Interviewing
At the first stage of familiarization a static screenshot of the display (Fig. 2) is shown to participant without any ad- ditional comments. After some time participant is asked to explain purpose of those graphical elements which he has recognized. At the second stage the FSS and the EID are activated and participant is invited to manipulate any con- trols at conventional control desks in order to make process disturbances. Comparing behaviour of conventional MCR displays and the EID, participant obtains possibility to learn purpose of earlier unrecognized graphical ele- ments. At the third stage the instructor asks participant to make a guess about purpose of those elements which were not recognized during two previous stages.
The stage when participant recognizes each graphical element of the display is recorded in the check list (Fig. 4). Then participant is asked to point to those elements which are unusual, illegible or inconsistent with professional stereotypes established at the plant.
Fig. 4. Check list for registration of familiarization process
Evaluation Exercises At the second study participants perform series of four exercises which provides operators with possibility to acquire skills in using the EID. An exercise consists in compensating for the material balance disturbance in manual mode without any support from automatic controller. Four technological events were preliminary selected to be used as an initial cause of disturbance, namely (see Fig. 1): 1) unintended activation of the auxiliary feed water pump causing jump in feed water flow, 2) unintended activation of the small size feed water pump increasing feed water flow, 3) fast reduction of the reactor thermal power up to 60% decreasing content of steam in the steam-water mixture, 4) unintended shutdown of the main circulating pump, which sharply decreases pumping of water from the DS.
Ergonomics In Design, Usability & Special Populations I (2022) https://openaccess.cms-conferences.org/#/publications/book/978-1-4951-2106-7
Participant is asked to stabilize as soon as possible the level of water in the DS at the normal value without identifi - cation of occurred event. The series of exercises has to be performed twice. First series is performed using conven- tional instrumentation panels and ‘hard’ controls. Then participant repeats exercises with the use of the Ecological display as the only source of information.
Realistic Scenarios Three fault scenarios were selected for evaluation of the EID. All the scenarios to be performed at the FSS by whole MCR operating team. Similarly to the exercises, each scenario is run twice: without the EID and with the EID. The scenarios replicate the real abnormal situations that took place in previous operating experience. It was noted that the operators committed errors more often than not when managing these situations.
In the first scenario, the spurious opening of the feed water regulating valve is occurred. Subjective complexity of this situation is that operator usually is confronted with difficulties when recognizing this event via regular conven- tional displays. In the second scenario, the small size feed water pump starts up unintentionally, which is accompa - nied by the water level automatic controller failure. Main problem in this situation consists in time pressure. Opera- tor must very quickly (within less than one minute) identify material imbalance and recover it manually. In the third scenario, fast reduction of the reactor thermal power (from 80 to 47%) is occurred as a result of protection activa- tion. This is accompanied by the water level automatic controller failure. The controller generates spurious com- mand resulting in sharp increase of water level which achieves an emergence setpoint in 1–1,5 minutes.
All process data and participants’ actions were automatically recorded in the log. After exercises and scenarios the participants were asked to fill questionnaire.
RESULTS AND DISCUSSION
Hypothesis 1: Intuitive Clarity of the EID The display and its components are intuitively obvious to operators without any additional explanations. Checking of this hypothesis was carried out during first experimental study intended for familiarization of operators with the EID. The hypothesis is considered to be proved if participants recognize the purpose of all 22 graphical elements without any comments and explanations. Most elements (76%) were recognized at the first stage of familiarization when a static screenshot of the display was demonstrated to the participants. Four elements (18%) were recognized at the next stage when the participants were being provided with possibility to make disturbance and to observe the display response. One element was recognized by one operator at the third stage while all other participants have recognized this element at first two stages. Five graphical elements were not recognized by one operator only while the others have recognized them at once.
Some difficulties arose with recognizing the trend graphs representing history and forecast of water level in the DS. This can be explained by the fact that most operators associate horizontal axis with flow rate scale rather than with a time line. One operator did not interpret the yellow box with digits. This element indicates how much time is left till the level achieves nearest setpoint. The participants had some difficulties in interpretation of the horizontal bar graph which summarizes a few water flow rates. Three of six operators understood this graph only after they have ob- served behaviour of the graph at the second stage of familiarization. Most operators had difficulties in recognition of the vertical bar graph at the left of DS circle. This graph indicates difference between flow rate of the incoming feed water and flow rate of the outcoming steam. After some additional discussions and consultations we made decision to exclude this graph from the Ecological display.
Hypothesis 2: Compliance with Professional Stereotypes All graphic forms and layout are easy perceivable and don’t break established professional user stereotypes. An- swering the question “How easy to get accustomed to the Ecological display?”, overwhelming majority of the partic- ipant (83%) chose the answer “Very easy and quickly”. Then the operators were asked to point out unusual shapes, behaviour and layout of graphical elements. They made 14 remarks which have been taken into account for develop- ment of the next version of the system.
Ergonomics In Design, Usability & Special Populations I (2022) https://openaccess.cms-conferences.org/#/publications/book/978-1-4951-2106-7
Hypothesis 3: Quickness of Imbalance Recognition Operators are able to recognize imbalance and trend of water level sooner than using conventional interface. To check this hypothesis, the two key parameters, duration of execution and response time, were compared for each evaluation exercise or scenario performed with the use and without the use of the Ecological display.
To estimate saving of time provided by the Ecological display, the following index is calculated: sij={T CI ij/T EID ij, when T CI ij>T EID ij|{0, when T CI ij=T EID ij|,
where T CI ij – time of execution of the task i (i =1…7 – four exercises and three scenarios) by the participant j ( j =1…6) with the use of conventional interface; T EID ij – time of execution of the task i with the use of the ecologi- cal interface.
Similar index rij is calculated to represent time of operator’s response. Response time is a time period between ap- pearance of disturbance and first action performed by operator. The usage of relative indexes instead of absolute val- ues is explained by considerable variation of efforts required to perform various exercises and scenarios. The index has positive value when the EID quickens response and execution of task.
Six executions of seven tasks (6[Equation or mathematical symbol available in the original paper PDF]7=42 cases) have been analysed. It was revealed (Fig. 5) that in 80% of all cases the EID quickens execution of task two, three and more times. 20% of the tasks were performed more quickly with the use of conventional interface. In overwhelming majority of cases (92%) the EID decreased response time consider- ably, and only in 8% the EID slightly increase time of reaction. These conclusions have been confirmed by the ANOVA procedure.
Execution time index – s Response time index – r
Fig. 5. Execution time index (at the left) and response time index (at the right) frequency histograms Fig. 6 shows average execution and response time for the each of the tasks. An advantage of the use of the EID is prominent for the first three exercises. These tasks are easily recognizable and require quite simple response actions. In the realistic scenarios where operator must perform some additional actions besides control of the DS the differ- ence between the use and disuse of the Ecological interface is not so evident. There is one more obstacle to quick operator response in the scenarios. All the four exercises are performed in manual mode and all the participants know that the water level automatic controller is deactivated. On the contrary, the controller is in use in the begin- ning of the each scenario. During the scenarios the controller generates some commands (spurious commands some- times) and operator does not have a direct sign indicating inadequacy of these commands. Failure or inefficiency of the controller can be discovered only after the material imbalance has occurred. So, operator has to wait some time in order to be sure that the controller has failed. This time period inserts some delay into response time.
The results from statistical data manipulation are complemented by subjective opinions of the participants. Answer- ing the question “Does the Ecological display simplify and quicken detection of challenges to water level and the material balance?”, the majority of the operators (67%) said “Yes, the precursors became visible much earlier and prominently”. The others answered simply “Yes”.
Ergonomics In Design, Usability & Special Populations I (2022) https://openaccess.cms-conferences.org/#/publications/book/978-1-4951-2106-7
Fig. 6. Average execution and response time when performing the tasks with the use and without the Ecological display
(Ex. – Exercise, Sc. – Scenario)
The results confirm the hypothesis 3, i.e. the Ecological interface provides operators with the evident saving of time, however the degree of this advantage depends on situation. The advantage is reduced in the situation involving fail- ure of the controller. There are two strategies to support operator and to decrease time response in such situations. First, some additional knowledge-based processing of logical conditions can be implemented. Second, the existing Ecological display can be supplemented with additional elements simplifying visual recognition of discrepancy be- tween the controller’s commands and the water level behaviour.
Hypothesis 4: Efficient Feedback The Ecological display reduces mental load and provides more efficient feedback from control actions in compari- son with conventional interface. Management of water level in the DS is an ‘adjustment’ type process where a feed- back plays the key role. In order to adjust level to a target value, the operator has to monitor permanently the mate- rial balance in the DS and to foresee how his actions can influence the water level.
Estimation of material balance at the real MCR includes perception and mental arithmetical processing of a few process parameters. Such estimation being carried out with the use of conventional meters is characterized by low accuracy and essential time delay. This results in oversupplying of the feed water and low precision of adjustment process. So, an accuracy of adjustment of water level may serve as the main indicator of efficient feedback.
The accuracy has been analysed only for the exercises where the participants were instructed to adjust the level as precisely as possible. In contrast to the exercises, the selected scenarios don’t require high accuracy and the partici- pants did not pay attention to this factor. Fig. 7 demonstrates a moderate advantage of the EID. Much more informa- tion can be extracted from Fig. 8 which shows behaviour of the water level during execution of the exercises by one of the participants. Wide oscillation of the level arises after strong disturbance when using conventional interface. This oscillation suggests that the participants used a trial-and-error method when restoring the material balance and adjusting the level. On the contrary, the Ecological display clearly indicates the value of feed water flow rate that is a target point which ensures achievement of the material balance.
The prognosis curve representing calculated behaviour of the water level for the next 3 minutes is an additional im- portant feedback information. This importance can be illustrated by the following scenario (Fig. 9). Operator opens the regulating valves in order to increase the flow of feed water when the level in the DS begins to fall (time point 1). The more the level falls the more water to be injected. However the temperature of incoming feed water is con- siderably less than the temperature of the medium inside the DS. This leads to decrease of steam concentration and to shrinkage of the steam-water mixture inside the DS. In other words, an additional feed water may cause further falling of the level instead of the increasing as it is expected by operator. To avoid overrunning the lower setpoint, the operator more increases the feed water flow (time point 2). This does not go on for a long time. The water is heated after just one circulation through the reactor, and the level begins to increase extremely sharply (time point 3). Despite the fact that the operator immediately reduces the feed water flow (time point 4), this can result in ex- ceeding the upper setpoint (time point 5).
Ergonomics In Design, Usability & Special Populations I (2022) https://openaccess.cms-conferences.org/#/publications/book/978-1-4951-2106-7
Fig. 7. Average accuracy of water level ad-
Fig. 8. Behaviour of water level in the DS when performing the exercises with the justment when performing the exercises use (the blue curve) and without (the red curve) the Ecological display with the use and without the EID
Fig. 9. Unexpected behaviour of water level in the DS when operator is trying to avoid achievement of the lower setpoint One more evidence of high efficiency of the feedback provided by the Ecological interface has been got from the questionnaire filled by the participants. The majority of the operators (83%) said that the EID considerably simpli- fies and quickens the procedure of keeping of the level at the prescribed value.
Hypothesis 5: Facilitation of decision making The display quickens identification of source of imbalance and facilitates decision making in comparison with con- ventional interface. The Ecological display clearly shows a target value of feed water flow rate (see the vertical line at the right side of the Fig. 2). The slanting line indicates that there is an excess feed water which flow rate should be reduced to the value specified by the vertical line. This essentially simplifies decision making.
Checking of this hypothesis was based on the participants’ subjective opinions rather than on the experimental data processing. Filling the questionnaire, all the participants indicated that the Ecological display provides much more holistic representation of the information about the material flows through the DS.
This opinion was indirectly confirmed by the FSS instructors who were evaluating the actions carried out by the par- ticipants during execution of the scenarios and exercises. The instructors noted the increased quickness and correct- ness of situation identification by the participants.
It should be also noted the clearly distinguishable strategies of the participants’ behaviour when using the Ecological interface or conventional interface. Using the Ecological display, the operators, as a rule, were standing in front of the desk with the necessary controls and were permanently manipulating the switches. The contrary behaviour was observed when the operators were working with conventional interface. They often moved between the desk and the back vertical panels. Control actions were interrupted by long pauses during which the participants were examining the meters at back panels and were analyzing the situation. This prevented from concentration at the task and re- sulted in loss of time and unnecessary movements.
Ergonomics In Design, Usability & Special Populations I (2022) https://openaccess.cms-conferences.org/#/publications/book/978-1-4951-2106-7
Further discussions of the obtained results with the experts revealed one more problem. The Ecological display sug- gests to adjust feed water flow rate to the balance point. Problem can occur if there is a big difference between cur- rent and target flow rates. In the case of the positive imbalance (feed water flow is greater than steam flow), operator may to reduce feed water flow as much as it is necessary. In the case of the negative imbalance (steam flow is greater than feed water flow), operator has to increase feed water flow rate. However, too sharp action is fraught with the undesirable transient described at the Fig. 9. In such situations operator is advised to adjust feed water flow smoothly using the ‘steps by step’ strategy.
To avoid undesirable transient, the Ecological display represents expected behaviour of the level. Operator can use this prognosis in order to ensure that undertaken action will not result in emergency situation. However, there is a possibility that he may disregard this information under time pressure. A director pointer, similar to the director indi- cator which is used in aviation, can effectively suggest decision. Director pointer is an additional slanting line indi- cating an interim target which should be achieved when operator has to considerably increase feed water flow rate.
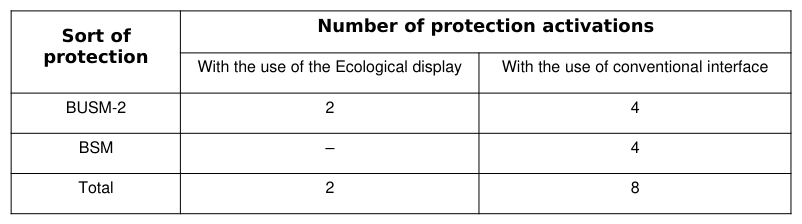
Hypothesis 6: Prevention of errors The ecological interface reduces probability of errors committed by operators during control of water level. Usu- ally, gross errors committed by operators result in activation of plant protection system. In other words, activation of emergency protection is the main indicator of failure in the adjusting of water level. There are two gradations of pro- tection. First gradation ‘BUSM-2’ consists in fast reduction of the reactor thermal power till 46%, while the second one ‘BSM’ results in full shutdown of the reactor. There are the following process conditions which can cause acti- vation of protection during control of the DS:
water level upper and lower setpoints activating the ‘BUSM-2’ protection;
water level upper and lower setpoints activating the ‘BSM’ protection;
feed water flow rate lower setpoint activating the ‘BUSM-2’ protection.
Frequency of activation of the emergency protection during execution of the evaluation programme is shown in the Table 1. The ‘BUSM-2’ protections occurred only twice when the participants were using the Ecological display. So, the relative frequency of the errors committed during the work with the EID is 0,05. Number of errors essen- tially increased (the relative frequency is 0,19) when the operators were using conventional interface. Most errors were committed during running the scenarios 2 and 3, which includes failure of the automatic controller. The error frequency characterizes not only the efficiency of the EID but also demonstrates the positive influence of the Eco- logical display on NPP safety.
Table 1: Frequency of protection activation during running of the evaluation exercises and scenarios
CONCLUSIONS
The described study enabled to acquire additional experience in application of the EID for nuclear power plant con- trol. The EID framework was applied to support operator during execution of the drum-separator control task. In spite of the fact that this task is carefully explored, the operators often have to work at the knowledge-based behav- iour level due to the necessity to carry out an intensive mental calculations and inappropriate human-machine inter- face. The EID methodology makes it possible to transfer some cognitive operations, such as summarizing, compari- son, etc., from the mental level to the perception level. The proposed Ecological display simplifies the most of such operations revealed during the functional analysis.
The evaluation programme carried out at the Leningrad NPP full-scope training simulator has shown a prominent Ergonomics In Design, Usability & Special Populations I (2022) https://openaccess.cms-conferences.org/#/publications/book/978-1-4951-2106-7 advantage of the Ecological display in comparison with traditional interface. It was experimentally confirmed that the proposed display reduces the frequency of operators’ errors, improves the situation awareness, quickens identifi- cation of any challenge to the material balance, simplifies the decision making process, and improves the accuracy of operators’ control actions.
However, it was revealed that the efficiency of the EID depends on situation. Some functional capabilities of the Ecological display were extremely helpful in particular situations, while in other situations the efficiency of these functions was not so prominent. The experience gathered from the trial operation shows that the ecological interface design can not be reduced only to simple graphic design. Some operational situations require the ecological ap- proach to representation of information to be accompanied by more sophisticated logical processing. For example, one of the main finding from our study is that the ecological interface should be supplemented with logical analysis of automatic controller behaviour and the director pointer preventing operator from too sharp control actions.
The study demonstrated that it is impossible to design an ideal interface just on the base of theoretical analysis (such as task analysis, functional analysis, work domain analysis, etc.) of problem domain. Quality and efficiency of hu- man-machine interface is strongly depends upon practical experience providing extremely valuable knowledge for improvement of usability.
ACKNOWLEDGEMENT
The authors are grateful to A. Podkopaev and L. Tarasov, the FSS instructors at the Leningrad NPP. They make in- estimable contribution to implementation of the evaluation programme. They immersed us in the details of the tech- nological process and explained everything with inexhaustible patience.
REFERENCES
Anokhin, A. N. (2009). Structural approach to functional analysis and design of main control room. Nuclear Plant Instrumentation, Controls, and Human Machine Interface Technologies: NPIC&HMIT'2009 (Knoxville, TN, USA, April 5-9, 2009). La Grange Park, IL: ANS Inc., 2484–2495. Arnheim, R. (1969). Visual thinking. Berkeley and Los Angeles: University of Carolina Press. Burns, C. M., and Hajdukievicz, J. R. (2004). Ecological interface design. Boca Raton: CRS Press LLC. Burns, C. M., Skraaning, G., Jamieson, G. A., Lau, N., Kwok, J., Welch, R., and Andresen, G. (2008). Evaluation of
ecological interface design for nuclear process control: Situation awareness effects. Human factors, 50(4), 663–679. Jamieson, G. A., Miller, C. A., Ho, W. H., and Vicente K. J. (2007) Integrating task- and work domain-based work analyses in ecological interface design: A process control case study. IEEE Transactions on Systems Man and Cybernetics, Part A: Systems and Humans, 37(6), 887–905. Lau, N., Jamieson, G. A., Skraaning, G., Burns, C. M. (2008). Ecological interface design in the nuclear domain: An
empirical evaluation of ecological displays for the secondary subsystems of a boiling water reactor plant simu- lator. IEEE Transactions on Nuclear Science, 55(6), 3597–3610. Lau, N., Veland, Ø., Kwok, J., Jamieson, G. A., Burns, C. M., Braseth, A. O., and Welch, R. (2008). Ecological interface design in the nuclear domain: An application to the secondary subsystems of a boiling water reactor plant simulator. IEEE Transactions on Nuclear Science, 55(6), 3579–3596. Lehar, S. (2003). The world in your head: A gestalt view of the mechanism of conscious experience. Mahwah, NJ:
Lawrence Erlbaum Associates. Rasmussen, J. (1985). The role of hierarchical knowledge representation in decision making and system management. IEEE Transactions on Systems, Man, and Cybernetics, 15(2), 234–243. Stanton, N. A. (2006). Hierarchical task analysis: Developments, applications, and extensions. Applied Ergonomics,
37, 55–79. Vicente, K. J. (1999). Cognitive work analysis: Toward safe, productive, and healthy computer-based work. Mahwah, NJ: Lawrence Erlbaum Associates. Vicente, K. J., and Rasmussen, J. (1992). Ecological interface design: Theoretical foundations. IEEE Transactions
on Systems, Man, and Cybernetics, 22, 589–606.
Ergonomics In Design, Usability & Special Populations I (2022) https://openaccess.cms-conferences.org/#/publications/book/978-1-4951-2106-7
LISTED IN THE AHFE DIGITAL BOOKSTORE CATALOGUE
Explore the complete digital volume
Advances in Ergonomics In Design, Usability & Special Populations: Part I
Read this individual research paper free through the original publisher, or explore the full digital proceedings book.
ISBN 978-1-4951-2106-7
Explore this ISBN in the AHFE Bookstore ↗Listed in the July 2026 bookstore catalogue; search by ISBN to confirm current availability · Digital book purchase optional