Irma Cecilia Landa Ávilaa, Lilia Roselia Prado Leónb (2022). Influence of Web Usability as Stimulus to Generate Positive Emotions. In: Advances in Ergonomics In Design, Usability & Special Populations: Part II. AHFE Open Access, vol. 19. https://doi.org/10.54941/ahfe1001252
The study of web usability has forayed into increasingly subjective scopes, such as user experience, where usability is regarded as a stimulus that may impact in the generation of positive emotions. This nexus between usability and positive emomciones still has several questions, since the studies show mixed results and have not been able to establish a critical relationship between them. However, there is a tendency to suggest that better usability is the trigger for express positive emotions about the use of that product. An usability test allow us get metrics about the usability components, which were analyzed in relation to the positive emotions reported by users through the PrEMO tool after using a design. Do the results we can assume that the relationship of the usability with positive emotions lacks a determinant structure, even if the frequency in which emotions like fascination were generated made us assume that it would be strongly affected by variations in the usability, otherwise the further analysis showed negative relationship and pointed that usability metrics like quality level of completed tasks and perceived mental effort are those that have a greater relationship with the expression of positive emotions.
Using products has shown a connection to emotional user responses, these manifestations involved a direct relation in function of a better usability generate positive emotions. Does this relationship exists with these characteristics? The human being is conditioned to interact with their emotions, though unconsciously, while they are acting or thinking. Other approaches have shown that humans are more efficient and have managed to solve creative problems when they are happy (Hirt, ER et alt, 1996).
Feist (1994) found that emotions play an important role when solving problems and making decisions. Inclusive, there is evidence suggesting that the emotions that arise during the product use are linked to the acceptance and user satisfaction.
Previously, much of the HCI research tended to focus on the ease of use of the cognitive system, in which the topics of greatest interest were related to ease of use, efficiency, ease of learning and error handling. These cognitive factors are certainly of great importance to HCI, but the feelings of users interacting with the system are equally Ergonomics In Design, Usability & Special Populations II important, as stated Barnes and Thagard (1996) in their study. They argued that emotions interact together with knowledge in order to achieve a certain goal. Recent scientific studies are beginning to suggest that emotions arise as a result of user interaction with the products, and are also trying to find them a place within academic fields that have the same rigor as any other developed metrics.
For the emotions report, methods for nonverbal offering successfully applied across a broad spectrum of participants. The PrEMO tool, developed by Pieter Desmet, is a good alternative for users to express their emotions after they used the products. For its development Desmet based the tool in the existence of positive emotions and the source they generates, his justify this metric as feedback to improve the sources that generated only to evoke positive emotions. The objective of the study is to discover in what way the use of the product, as measured by the usability metric, influences the generation of positive emotions. For this case we consider the metric obtained from a usability test, (effectiveness, efficiency and satisfaction) to define if some of these elements has a closer relationship with the evocation of positive emotions.
BACKGROUND
What are emotions?
Emotion is a psychophysiological reaction to certain stimuli related to needs, goals or individual concerns; it's also composed of further physiological, affective, behavioral and cognitive components. Physiologically, emotions organize responses of biological systems, such as facial expressions, tone of voice, the autonomic nervous system and endocrine system; behaviorally they set a position relative to the environment (empathy for people, objects, actions and ideas). Emotions are affected by innate and learned influences, with invariant features and others that depend on the group or culture to which they belong (Levenson, 1994).
The word "emotion" is often applied to a wide variety of phenomenon, such as the passions, feelings, temperament and moods. Even if these words are regularly used interchangeably, in fact, it refers to specific and different experience. According to the field to which emotions relate, certain elements arise. In the field of HCI, the interpretation of emotions focuses on emotional responses (feelings) that are assigned to an interface during and after their use.
It is believed that emotions are intentional, because they comprise and involve a relationship between the person experiencing it and a particular object: one is afraid of something, proud of something, in love with someone and so on (Frijda, 1994). Also, people are able to identify the object causing the emotion (Ekman 1992).
The research literature shows two approaches that are used to distinguish between different types of affective states. This can be distinguished by observable characteristics (intensity), or for the circumstances that give force to them (origins). Because the current research interest is focused on emotions from a particular origin, the second approach based on eliciting conditions, it seems more relevant.
There are various classifications of emotions emerging in relation to the needs and specific applications, for this study we need a classification that allows us to see which are considered positive. In his classification, Desmet (2012) established that positive emotions are found in the Human-Product Interaction.; he made nine categories with 25 positive emotions: admiration, amusement, anticipation, confidence, courage, desire, dreaminess, enchantment, energized, euphoria, fascination, hope, inspiration, joy, kindness, love, lust, pride, relaxation, relief, respect, satisfaction, surprise, sympathy and worship. Subsequently, for the development of the tool for reporting emotions he selected 6 positive emotions wich are the most representative: desire, satisfaction, pride, hope, joy and fascination.
Emotions in product use One of the questions that underlie the study of emotions during the use of products, is whether if these are real (also called origin emotions). An emotion that is origin is one the people feel to important events that we experience in our lives, and the hope that we can feel to be in the company of a loved one, or the anger we feel toward someone who demeans us (Lazarus, 1991).
If emotions caused by the use of products are genuine, then the desire we feel to possess certain object only by being well designed and anger felt by the impracticality of small buttons on an expensive mobile phone, should be similar to the desire and anger traditionally understood in the field of emotions. Are the emotions generated by the use of authentic products or are, in fact, a "special type" of emotion? The presence of emotional responses in the use of products is supported by several studies that attempt to describe the relationship that is supposed to exist with a particular element of the system. In psychology the functionalist approach to emotions provides theoretical foundations that can be used to explain how the products generate emotions and because different designs to different answers.
It is said that an emotion always include the evaluation of how an object or its use can harm or benefit a person (Arnold, 1960) and that evaluation is always immediate and direct in a positive or negative sense. Emotions are a mechanism that signals when an event is favorable or harmful to the person who is concerned and this implies that every emotion hides a concern.
The emotion model of the product identifies three variables for activation of emotions, one is the product. According to Ortony et al. (1988) there are three main aspects of the world in which we can focus: events, agents or objects.
Methods to evaluate the emotions A type of instruments has some important advantages over the other: the self-report instruments (measuring subjective feelings) are able to measure a mixture of excitement and measure other than the basic emotions and these in turn are subdivided into scales verbal and nonverbal .In the study by Agarwal and Meyer (2009) we can find one of the most formal methodologies in the field of integrating emotions and their relation to usability. One of the main challenges was to measure emotions, since humans have problems to describe how they feel and are not always able to distinguish what they feel.
In general, all the feedback collected by Agarwal and Meyer was rich in content and often emotionally charged. They concluded that a positive user experience cannot be expressed only in terms of usability metrics and that it is valuable to study emotions, because they supplement the evaluation of interfaces, since it allowed them to know whether there were differences with standard usability metrics that they would not notice.
Agarwal and Meyer also noted that the use of artificial quantitative measurement techniques to define emotions (PAD scale) do not represent a real human emotion and recommend the use of emocards to create a certain ambiguity that is necessary for a real measurement of emotion.
PrEMO. The acronym of Product Emotion Measurement is an instrument specifically designed to measure the emotions of any product. Developed by Pieter Desmet (2005), it is based on 14 animations of a cartoon character, seven of them pleasant (desire, pleasant surprise, inspiration, fun, admiration, contentment and fascination), and seven unpleasant (anger, contempt, disgust, unpleasant surprise, dissatisfaction, disappointment and boredom).In the validation process, two emotions failed the test, so they were removed from the instrument.
It measures various and mixed emotions and does not require participants to verbalize their emotions, avoiding excessive mental effort, since it was designed to be fast and intuitive to use.
The visual display is accompanied by a body animation of a character and a sound that lasts approximately one second. Participants are required to report their emotional response to the twelve animations by interacting and placing each of them on a scale of five values ranging from 0 for no feeling to 4 for a strong feeling. PrEMO was designed to meet the following requirements:
It is applicable in different cultures (language independent).
It should not require equipment or expertise.
It is capable of specifically measuring emotions that most often occur due to the appearance of the product.
It is capable of measuring mixed emotions, for instance, when more than one emotion is experienced simultaneously.
Operates primarily on an unconscious level.
How web usability is evaluated? Ergonomics In Design, Usability & Special Populations II
The usability concept starts precisely in the HCI field, the first uses of the term are related to web interfaces. The International Organization for Standardization (ISO) has defined usability, in the ISO / IEC 9126, as: "Usability refers to the ability of software to be understood, learned, used and being attractive to the user, within specific conditions of use”. This definition emphasizes the internal and external product attributes, which contribute to its functionality and efficiency.
One of the most prominent figures in the world of Web usability is Jakob Nielsen, who in 2003 defined usability as "a quality attribute of a product that assesses the ease with which the user can use the interface."
Therefore, if we perform a usability test, we must have the measurement of various factors, which allows us to generate a comprehensive evaluation of the web interface. These factors can be placed into two groups: the objectives as effectiveness and efficiency, that can be obtained by the time measurement, tasks number and mistakes, and the subjective can locate where subjective satisfaction, which is commonly questionnaires presenting a scale. The usability test is the traditional method by which we can get results on traditional metrics.
Bevan and Macleond found that the nature of the scope required in the study of usability depends on the context of use of the product. Bevan said that usability is a feature of the system as a whole, that is "the quality of its use in a certain context" and that existing methods to measure usability are limited in their accuracy because they only model limited aspects of users, tasks and environments. In an effort to provide a method that provides a usability evaluation, Bevan developed the MUSiC method; it has tools that can be used to measure the usability both in the laboratory and in field research. Bevan explains that it is not mandatory that all the metrics proposed in this measurement method of usability are present, as they depend on the type and objectives of each study. For Bevan, usability is the critique of the quality of successful use of a product as well as the relationship between the cost and the benefit derived from any interactive object.
Effectiveness is often difficult to measure in a comprehensive manner; this may be the reason why many studies of complex tasks refrain from measuring the efficiency and are content to sticking with measurements of the efficiency of the interaction. However, Frøkjær, Hertzum and Hornbæk determined that those three measurements (effectiveness, efficiency, and satisfaction) should be considered as an independent aspect of usability, but all must be included and evaluated in the test.
In the study by Sauro and Lewis (2009) indicate that in order to build usability, one must find reasonable values that can be used in combinations of target values and subjective factors. Due to recent and similar studies offering mixed results, it can be anticipated that in all usability tests the correlation will present itself in the same way.
Sauro and Dumas (2009) conducted a review of the most common satisfaction tests that are applied at the end of the studies to find those that were more reliable and easier to use. After they finished, they analyzed the times of task completion, errors and responses of each different scale and found that the results of their performance hardly matched their perceived difficulty; nonetheless they observed some correlation with other measurements which was evidence of its validity. Among the reviewed instruments, the scale of the Subjective Mental Effort Question (SMEQ) showed the best performance, it was easy to learn and highly correlated with other measurements, so their suggestions pointed at its use on other post-test scales.
The After-Scenario Questionnaire (ASQ) studied by Lewis (1991) from a psychometric approach. In the study, Lewis concluded that the three items in the ASQ questionnaire can greatly condense the results of post-test assessments by adding up the results. Another conclusion was that ASQ is sensitive enough to be used in usability studies, and that its concurrence validity in each of the scenarios was equally good. Lewen recommended the use of this scale in usability testing because he found no evidence to the contrary. In this study we used both tools to obtein all the usability metrics.
METHODOLOGY
Participants
Recruitment was used to obtain participants for convenience. The exclusion criteria were being older than 18 and not having previous experience with design software. It featured a sample of 32 participants (11 men and 21 women, mean age of 21 years and a standard deviation of 3.9).
Materials
The test was conducted in a room with two computers, one for the use of the software, in which the user performed the tasks of the test, and a program that allowed videotaping the test for later review, in which other usability metrics would be obtained.
Reporting PrEMO emotions To report emotions, the PrEMO system was installed on a computer with internet connection. The tool evaluates the emotion through a 5-point scale by the participants after each task, the range was from 0 if no emotion was felt and it goes up to 4 if they felt it strongly.
SMEQ Scale It is also known as the effort grading scale. After each task the moderator conducted the Spanish version of the SMEQ questionnaire. This scale has a range of 1 to 150 and nine labels from "not at all difficult to do" to "extremely difficult to do."
ASQ Scale Self-reported satisfaction questionnaire, it was performed at the end of each of the tasks comprising 3 statements regarding satisfaction with the time taken to perform the task, the ease with which it is performed and help to do so. Here, the participant could respond by using a scale that ranges from 1 for strongly agree until 7 for strongly disagrees.
Time The time was recorder for each task, although it had set a maximum time for completion.
Number of errors By a count of errors detected, an error was considered as any action that did not respond to the user's intention. It was not considered wrong to follow an order, to conduct a search or to visually scan the interface.
Level and quality completed tasks A checklist for each of the tasks was made. This list was made according to a subdivision by individual actions, which were assigned a score relative to the complexity they had. Each task could have a score 100 if it had been fully completed with quality and accuracy.
Tasks The test was made of three tasks, which should always be made in the same order, due to the learning that participants could obtain from the preceding task.
Task 1: In the first task the participant had to make a red square of 8 cm and a blue circle of 5 cm in diameter. The maximum time to complete the task was 3 minutes.
Task 2: The second task was to make a business card, this design required to make rectangles, enter text in specific sizes and place some elements that were provided as input. The maximum task time was 6 minutes.
Task 3: For the third task the participant was asked to do a poster. Some of the specific actions that had to be done were making boxes, changing colours, copying items, changing size, writing text, and making blueprints. The maximum task time was 10 minutes.
Procedure At the beginning of the session participants were informed about the dynamics of the test, permission to videotape the test was requested and an initial questionnaire that collected demographic data was applied, also one for similar design software. Each of the tasks was explained just before beginning, task aids were given and questions concerning the task were answered. Questions regarding how to do it using software were not answered. The participants that were performing the task had to talk out loud at all times and they had to mention the actions performed or intended to perform. If participants showed little verbal activity, the moderator made some questions during the course of the tests.
At the end of the task or the maximum end time the ASQ and SMEQ questionnaires were delivered. Immediately thereafter, the PrEMO tool was used for reporting the emotions of each of the tasks, the participants had unlimited time to assign a value to each of the characters used.
Once task 3 concluded, a final questionnaire was administered in which participants were asked about their overall perception and satisfaction with the software. The test had a maximum duration of 45 minutes. Subsequently, a review of each of usability test for a count of errors per task was conducted. Also, a complete checklist regarding the level and quality of completed tasks was made.
RESULTS
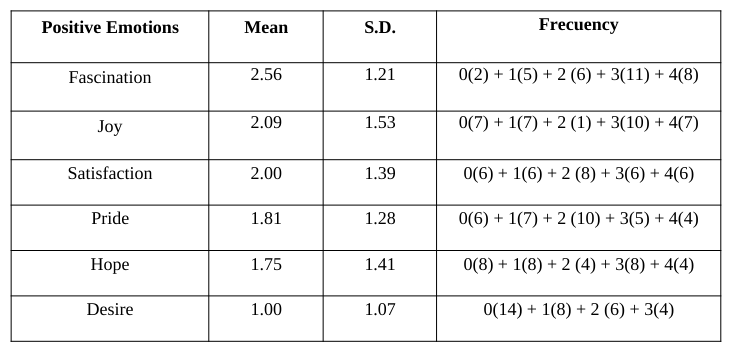
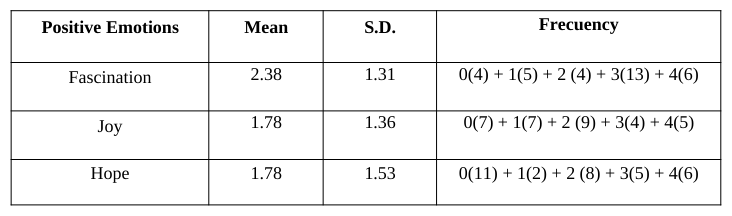
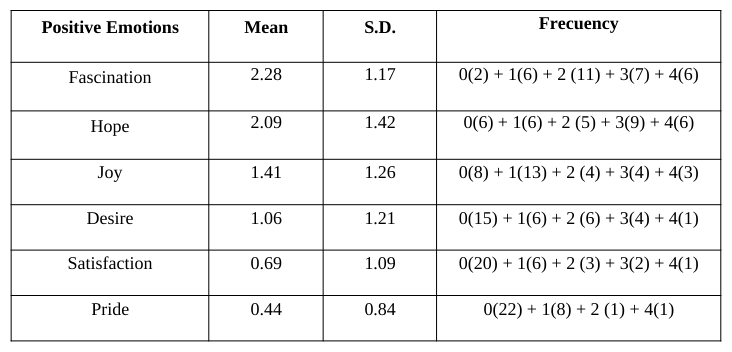
The tasks of the usability test were analyzed individually as there is no evidence that the simple addition will give us an overall rating of usability. Below is the ranking of the emotions that were reported with greater strength by users. The list is for each of the last task that the users performed.
Table 1: Ranking of positive emotions in task 1 Positive Emotions Mean S.D. FrecuencyTable 2: Ranking of positive emotions in task 2 Positive Emotions Mean S.D. FrecuencyTable 3: Ranking of positive emotions in task 3 Positive Emotions Mean S.D. Frecuency
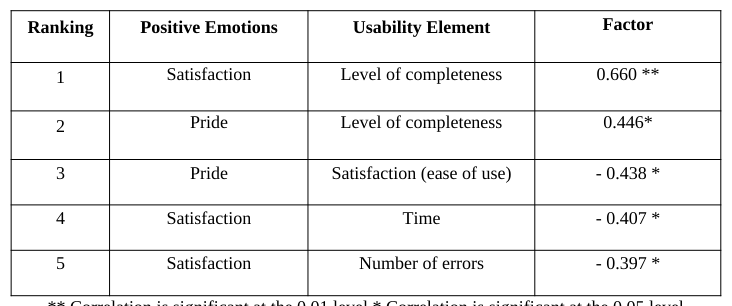
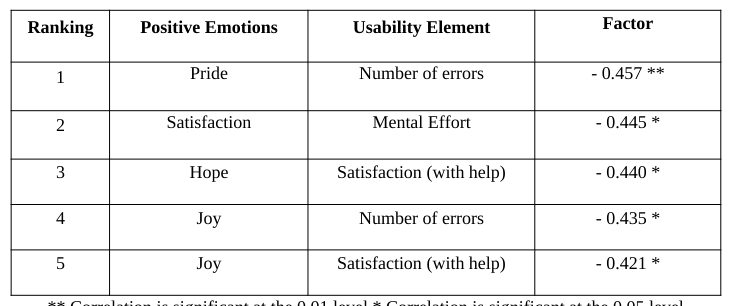
Moreover, a bivariate Spearman correlation analysis was performed to detect which usability factors are related with positive emotions. To illustrate the relationships per task is up the top five with some degree of significance.
Table 4: Strongest relationship between usability elements and positive emotions of task 1 Ranking Positive Emotions Usability Element FactorTable 5: Strongest relationship between usability elements and positive emotions of task 2 Ranking Positive Emotions Usability Element Factor
** Correlation is significant at the 0.01 level * Correlation is significant at the 0.05 level
Table 6: Strongest relationship between usability elements and positive emotions of task 3 Ranking Positive Emotions Usability Element Factor
CONCLUSIONS
During the development of a usability test, we were able to detect that some positive emotions were motivated, so actually we can consider that the product use is detected by users as the stimulus for this effect. Within these emotions, the fascination was that one than users expressed more strongly in the three tasks, suggesting that the use influences more intensively to that emotion. Also joy showed a high prevalence among the participants, and this emotional response is easily detectable among individuals when they are performing the action, even when they were using the tool PrEMO it was reported that participants laughed and granted respectable scores.
However, what we might be able to predict through these frequencies is decreased by the variation derived from correlations made. If the fascination was expressed in all tasks invariably, it was surprising that there wasn’t a significant relationship with the metrics to the elements of usability, which suggests that probably an independent external factor could influence the variation of emotional response. The empathy with the proposed task and the order, quickly emerge as the variables to consider for this phenomenon.
The detected relationships were not determinants, but probably the influence of the level and quality of completed tasks and mental effort were those usability metrics that continuously influencing the emotion of satisfaction. satisfaction was one that highlighted as positive emotion that was most affected by variations of usability.
This brings us to consider the relationship of usability to evoke positive emotions is complex, and we should consider other variables such as the task and the order in which the instruments are applied to determine, in order to determinate the causality of this phenomenon.
REFERENCES
Agarwal, A. & Meyer, A. (2009). “Beyond usability: evaluating emotional response as an integral part of the user experience” CHI '09 Extended Abstracts on Human Factors in Computing Systems, 2919-2930. Arnold, M.B. (1960). “Emotion and personality”. New York: Colombia University Press. Barnes, A. & Thagard, P. (1996) “Emotional decisions. Proceedings of the Eighteenth Annual Conference of the Cognitive
Science Society”, University of California, 426-429. Bevan, N. & Macleod, M. (1994). “Usability measurement in context”. Behaviour and Information Technology, 13, 132-145. Desmet, P.M.A.. (2012). “Faces of Product Pleasure: 25 Positive Emotions in Human-Product Interactions”. International Journal of Design, Vol.6 (2), 1-29. Ekman, P. (1992) “An Argument for Basic Emotions, Cognition and Emotion” Volume 6,169–200. Ekman, P. (1994). “Moods, emotions, and traits”. The nature of emotions, fundamental questions, Oxford: Oxford University
Press, 56-58 Frijda, N.H. (1994). “Varieties of affect: emotions and episodes, moods, and sentiments”. The nature of emotion, fundamental questions Oxford: Oxford University Press, 59-67. Frøkjær, E., Hertzum, M. & Hornbæk, K. (2000, 1-6 de abril). “Measuring Usability: Are Effectiveness, Efficiency, and
Satisfaction Really Correlated?”. Proceedings of the ACM CHI 2000 Conference on Human Factors in Computing Systems. The Hague, The Netherlands, Press, New York, Preprint version, 345-352. Lazaro R.S. (1991). “Emotion and adaptation” (p.557). New York: Oxford University Press Levenson, R. (1994) “Human emotion: a functional view”, The Nature of Emotion, Oxford University Press, 123-126. Lewis, J. (1991). “Psychometric evaluation of an after-scenario questionnaire for computer usability studies: The ASQ”. SIGCHI Bulletin, Volumen 23 (1), 78-81 Ortony, A., Clore, G., & Collins, A. (1988). “The cognitive structure of emotions2. New York: Cambridge University Press. Sauro, J. & Dumas, J. (2009). “Comparison of Three One-Question, Post-Task Usability Questionnaires”. CHI 2009. Sauro, J. & Lewis, J. (2009). “Correlations among Prototypical Usability Metrics: Evidence for the Construct of Usability”. CHI
2009.
LISTED IN THE AHFE DIGITAL BOOKSTORE CATALOGUE
Explore the complete digital volume
Advances in Ergonomics In Design, Usability & Special Populations: Part II
Read this individual research paper free through the original publisher, or explore the full digital proceedings book.
ISBN 978-1-4951-2107-4
Explore this ISBN in the AHFE Bookstore ↗Listed in the July 2026 bookstore catalogue; search by ISBN to confirm current availability · Digital book purchase optional