Ader Garcia, Julie Waldron, Carolina Bedoya, Lady Cuervo, Laura Marin, Catalina Morales, Carlos Sanchez, Andrés Felipe Sierra (2022). Evaluation of the Occupied Area of Children Aged between 3 and 5 Years Old in Different Kindergarten Spaces. In: Advances in Ergonomics In Design, Usability & Special Populations: Part III. AHFE Open Access, vol. 20. https://doi.org/10.54941/ahfe1001346
This paper contains the second stage of the research "The minimum area required for children aged between 3 and 5 years old in a kindergarten", which was developed between Buen Comienzo Programme, Medellin’s Municipality and Architects Julie Waldron and Ader Garcia. Often, kindergarten are planned in a conventional way of construction; they are designed following standard building measurements (NTC4595), given by the quantity of square meters per child, rather than the spatial necessities. Therefore, the aim of this research was to evaluate the occupation area of a child in three different spaces: the classroom, cafeteria and bathrooms, as well as their correspondent activities: drawing, sleeping, eating and cleaning up. The study was developed photographing a 5 years old model, which was performing the selected activities. The photo analysis showed that the area needed in a space should not be limited by the equivalent area physically covered by the children solely performing the activities. Thus, each activity was compared in different children grouping configurations and these were analysed in different room shapes. The results were evaluated aiming to find the average occupation area. Finally, this research integrates: activity and shape of indoor spaces and dynamic required rates.
By 2010, Medellin, Colombia had a total population of 2’343,049 inhabitants, of which 205,652 were under the age of 6 years. 71% of them, were children under 5 years and living in conditions of vulnerability (Herrera R, 2012). Nowadays public policies are making an effort to improve their coverage in order to give these children an integral care. Given the lack of proper infrastructure to educate and care for this population of children, between 2008 and 2010, under the public police of integral care to the early childhood, approved by the city council, the task of building 15 new kindergartens, located in the most vulnerable neighbourhoods of the city began. The aim of this public investment was to ensure an improvement in the area of nutrition and educational care for the young population living in these communities. An amount of COP$ 356,097 million of Colombian Pesos, approximately equivalent to US $176,460,000, were invested in this project.
In order to build the educational infrastructure, to estimate the investment required and to extend the coverage capacity of the Municipality’s early childhood programs, it was necessary to know the area occupied by a child in each of the spaces of the kindergarten. The technical standards available at the time, suggested an area per child between 1 m2 and 2 m2 (Departamento administrativo de Bienestar Social del Distrito Capital, 2006; Presidencia de la República, Fundación éxito, & AEIOTú, 2011; Programa Buen Comienzo & SEN, 2012). In the absence of more specific information about Medellin’s children population, this research was developed with the purpose of identifying the area that a child between 3 and 5 years of age uses during kindergarten activities, and its similarities to the consulted standards.
The international standards reviewed allowed the identification of values in square meters assigned to classrooms according with the standard´s social context. In countries like the United States, Canada and Australia, with considerably different cultural identities from those in the tropics, the guidelines and standards indicate a greater amount of area per child within classrooms, and they do not differentiate regarding spaces for eating, listing values between 3,30 and 5,97 m2 per child (City Council - city of Vancouver, 1993; Department of Education and Early Childhood Development, 2007; GSA, 2003).
On the other hand, in Latin-American countries, with similar cultural identities and also sharing similar habits, the area destined per child in each particular space is clear and distinct according to the activity. The area required for classroom, varies between 1,0 m2 and 2,0 m2 per child and in recreational areas the value increases to values near 3 m2. The restrooms and Cafeterias appear as differentiated spaces and complementary areas to the educational activity developed in the classrooms (Programa Buen Comienzo & SEN, 2012; Presidencia de la República, Fundación éxito, & AEIOTú, 2011; Departamento Administrativo de Planeación. Alcaldía de Medellín, 2007; MEN Colombia, 2006; Oficina Internacional de Educación de la UNESCO (OIE), 2006; Ministerio de Educación Nacional Chile, 1988).
The previous study called: The minimum area required for children aged between 3 and 5 years old in a kindergarten, presented in parallel at this conference, describes the findings of the policy analysis and describes the introduction of the first results of the measurement of body gestures, including body movement and individual behaviour. During this study, the need upon which this second stage is based was determined: the space occupied by a child depends not only on its body but also on other variables, such as the activity carried out and the shape of the space in which is developed. This document presents the procedures undertaken and the results obtained during a PVG Architects S.A.S ergonomics assessment for the Buen Comienzo Programme. The main goal was to identify the range of occupation areas necessary for a child in the early childhood development stage, according to its interaction with the space and the activities carried out within it, during each of the aforementioned environments.
METHODOLOGY
To evaluate the size of the area required by a child to develop an activity in any of the spaces of a kindergarten it was necessary to observe and differentiate the body postures they adopt during the school day, similarly analyzing how they interact with the furniture used in each activity. For this reason, this study was developed in three stages. Stage 1 consisted in a field test where a child was photographed performing a series of activities commonly undertaken in a kindergarten. In Stage 2, the photographs taken in the previous stage were analyzed, identifying the areas that are necessary to perform the evaluated activity, in order to generate a static digital image of the action. Finally, during Stage 3, different ways of grouping were simulated for the totality of children that according to the current standard, are allowed to perform the same activity simultaneously.
In the absence of an anthropometric table validated for Colombian children, the Mexican children anthropometric data table (Ávila, Prado, & González M, 2001) was used to make the percentile classification of the models. For 2 different ages, 3 and 5 years, 3 percentiles were evaluated: p5, p50 and p95. With the models, body gesture studies were made using the video camera in 3 planes technique (front, lateral and top view were recorded), and the sequences were digitalized to obtain the child´s area of occupation executing a specific routine activity in the space. With this exercise, it was concluded that the p50child of 5 years, has an average area between the areas of the percentiles p5 of 3 and 5 years, contains most of the measures that will help to get a proper overview of space- child ratio.
During this study, the area of three different spaces, the classroom, the canteen and the restrooms, were evaluated. For the classroom, 3 shapes of the plan´s space were evaluated: Square, Rectangular and Hexagonal. This measurement was taken in order to consider different architectural design choices in existing educational buildings Stage 1: Field Test
After observing the children daily routine in several kindergartens located in the city of Medellin, a series of identified standard activities were conducted in all the studied school. For this study, those activities like Drawing, Sleeping, Eating, using the restrooms and washing their hands were selected. Since they proved to be the most important; because of their spatial necessity for the children´s cognitive, social and/or motor development. Selecting those activities implies the necessity of studying the specific spaces in which they were done within a kindergarten. This with the purpose of inquiring the area per children needed in that particular space, so the user can perform comfortably each of the activities mentioned above.
Once the activities and spaces for study were selected, a script was design for each of the necessary actions to satisfactorily fulfil the evaluated activity. Subsequently, the different positions taken by a p50 5 year old child, considered as normal within the standards of growth and development of the Latin-American population. They were recorded through a standard process of image capture in 3 different planes: lateral, front and top view.
Stage 2: Image processing The images of the most representative postures of each activity were imported in a Computer Assisted Design Software – CAD, for this particular case AutoCAD 20121. In each image, both human body and furniture were delineated, making a clear distinction between head and shoulders, and drawing the extremities that were visible in the image. Once the drawings were generated, the remaining figures were scaled; taking as real the measurements of the dimension at the work plane height.
Later on, the final silhouettes of each posture were overlaid with reference to a point, whose position did not change between images. The resulting motion silhouettes represent the range of areas needed to successfully perform an activity; besides the area already occupied by the child´s body and the piece of furniture used in the activity.
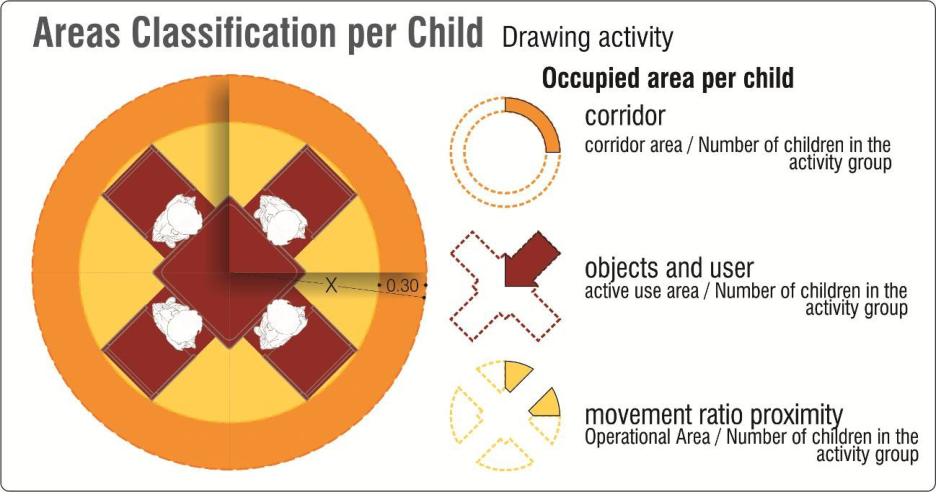
From the analysis of the overlaid silhouettes a template was made and two zones inherent to the activity were identified. The first one is the area defined by the sum of the area of the object and the area occupied by the body conducting the most representative position of the evaluated activity. This area was called the Active Use Area.
The second area, called the Operational Area, is the one that corresponds to the space needed to support the activity and to enable the changes of posture. This area was calculated starting from the total area of the motion silhouette and subtracting the area that was defined as in Active Use.
Thereafter, a third zone which responds to a functional order was added. This zone is define by an imaginary line locate at 0,30 m from the edge of the motion silhouette towards the free space around it, and was called Corridor Area. This area was calculated so the subject could comfortably go in and out of its workstation. Likewise, through this area, it was considered important to make sure that when two or more templates were tangentially arranged one beside the other, a minimum distance of 0,60 m would be preserved, so that a person could circulate through it.
Figure 1 illustrates one of the templates obtained for the activity Drawing, highlighting in colours the zones defined above and the area corresponding to each child.
1 http://www.autodesk.es/products/autodesk-autocad/overview Ergonomics In Design, Usability & Special Populations III
Figure 1. a) Areas Classification b) Areas Classification per Child
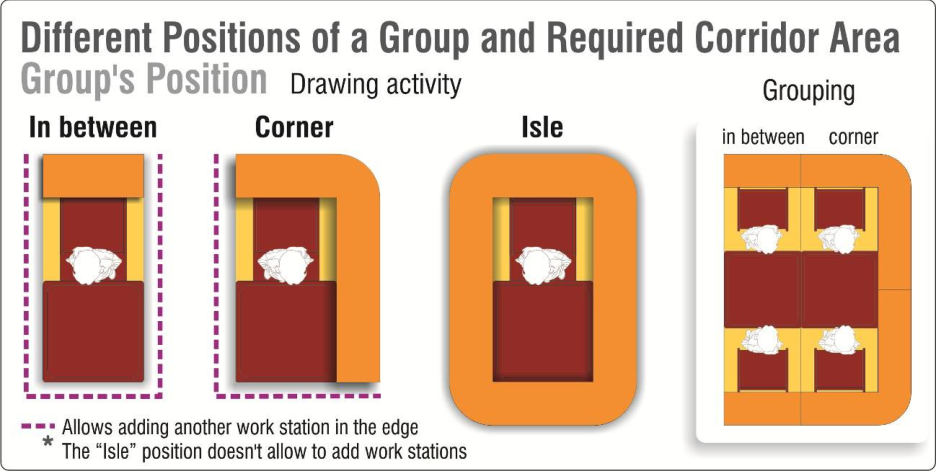
The areas may change considerably, depending on the occupied position within a grouping or the amount of people using the same piece of furniture. For example, when the position evaluated is located within a group, namely with others doing the same activity at the front and both sides of the examined position, the corridor area should be only kept at the back of the block, meaning in the “open” side, while if the work area is isolated from others, this area must be kept on all sides. Figure 2 shows different kind of positions within a grouping and its needs for preserving the corridor area.
Figure 2. Different positions of a group and required corridor area All the information obtained on the last process, was organized and classified in data processing software, as a calculation sheet.
Stage 3: Grouping of children according to the activity and space Making use of the templates generated in the previous stage, a series of spaces were simulated according to the activity performed within. Taking as a reference the current standard and the maximum quantity of students recommended for each space, hypothetical spaces were created, resulting from different kind of grouping – Isle, Couples, Groups of different number of people - of the blocks obtained for each activity.
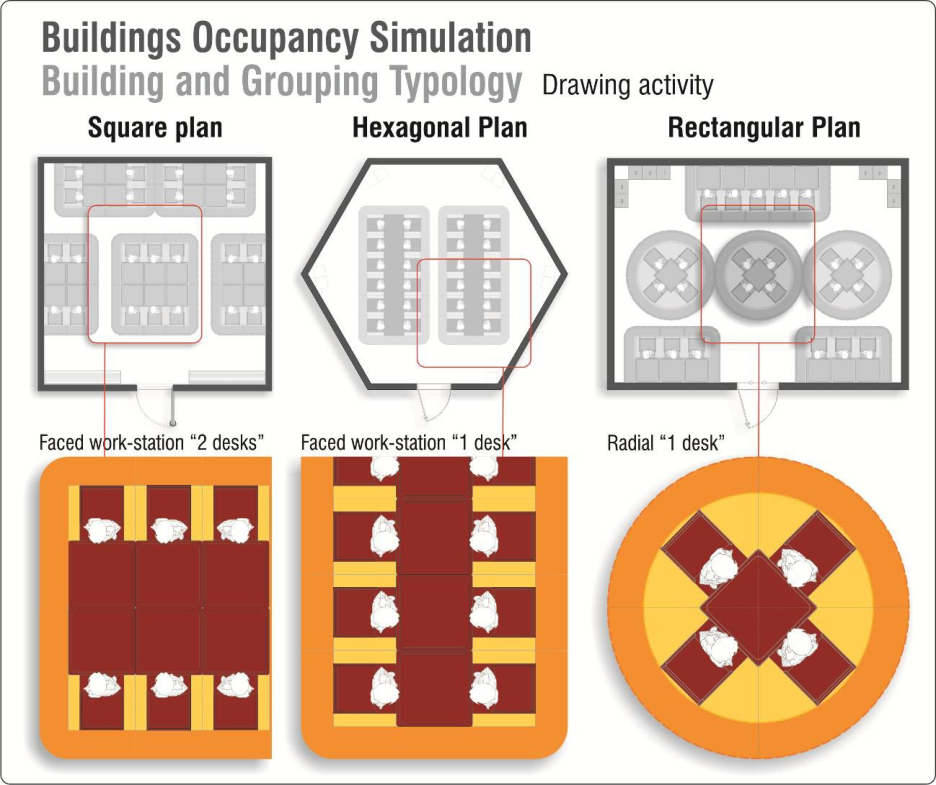
As previously mentioned, for the classroom, 3 typologies of room shapes were considered: square, rectangular and hexagonal. For all the other spaces, only rectangular shapes with different proportions and dimensions were considered. Different ways of grouping were evaluated for each typology. Figure 3, shows some of the resulting classrooms of the digital simulation, differentiating the classification of the special areas considered.
Figure 3. Buildings occupancy simulation
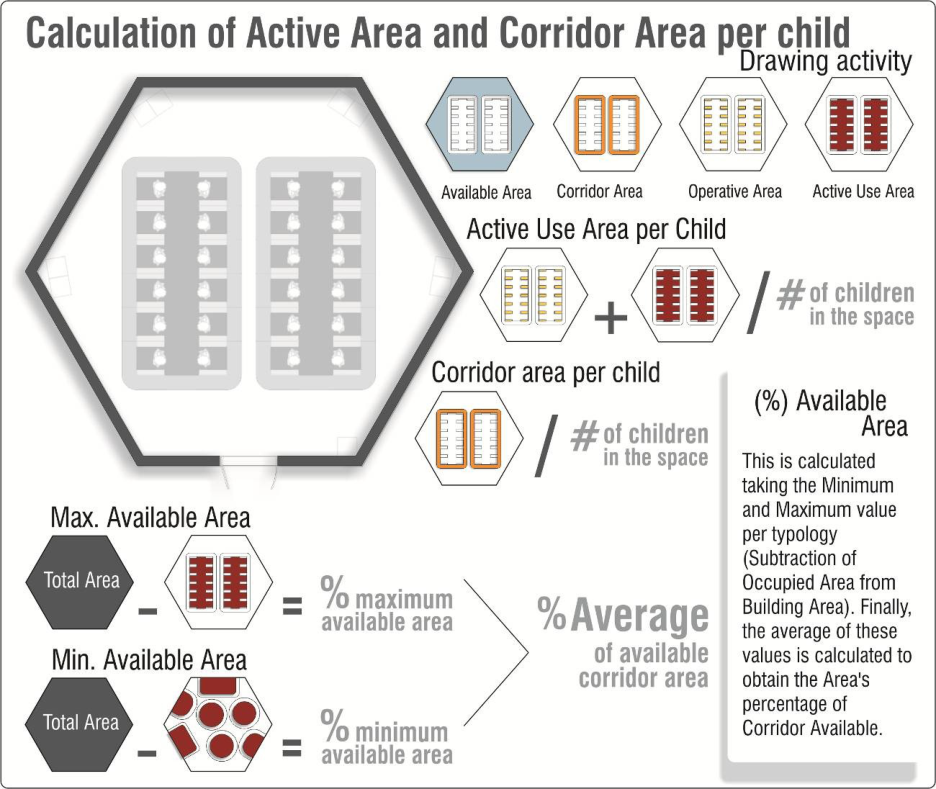
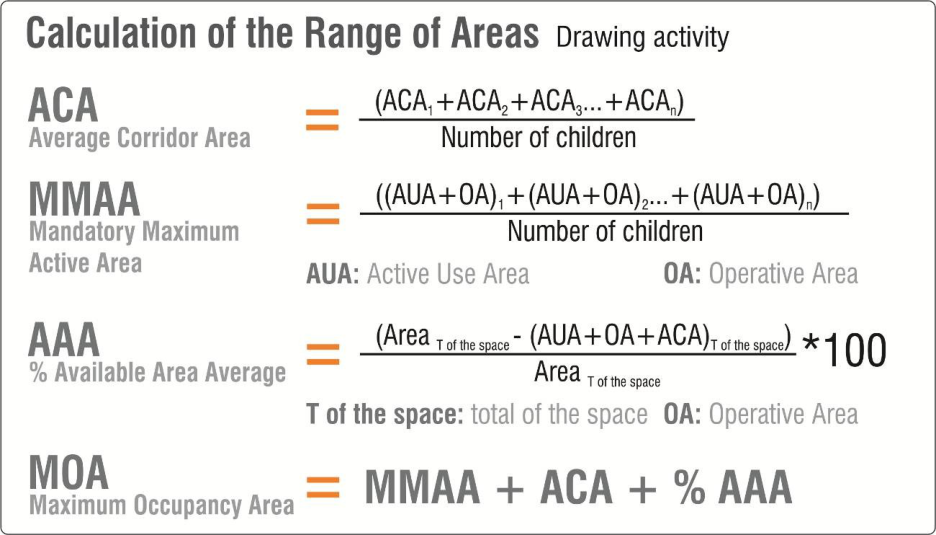
To obtain a range of areas, the calculations developed considered the Corridor Area per child and the Mandatory Active Area. The Corridor Area per child is the sum of all Active Use Areas and Operational Areas, which are contained in the resulting space, and equally divided between the total numbers of children using the space. Figure 4 illustrates this procedure.
Figure 4. Calculation of active area and corridor area per child
Additionally, it is considered a percentage of Available Area Average in all the studied shapes, so that the final value obtained includes both personal Corridor Area (given by the typology or block) and the Corridor Area of the overall space. This data is obtained by taking the minimum and maximum values of the Available Area (total area minus the area occupied by the typologies) and calculate the percentage of the space to which they correspond. Finally, both percentages are averaged. The resulting percentage corresponds to the average amount of area in the space that is available for circulation (see figure 4).
Having those 3 values, the Available Average Area was added to the maximum, minimum and average Mandatory Active Area, obtaining another 3 values. To these values, the Available Area Average was added, achieving a range of values that define the required area to interact with an object, circulate around it and move through the space (see Figure 5).
Figure 5. Calculation of the range of areas
RESULTS AND DISCUSSION
Once the exercise described above was concluded, the following values were obtained: For the Classroom, a value of minimum area per child of 1,73 m2, an average of 1,95 m2 and a maximum area of 2,17 m2 for the Drawing Activity were determined. For Sleeping, the value is constant of 2,06 m2, since the Mandatory Active Area per child is equivalent to the area of the mat where they sleep on.
Table 1. Calculation of the range of areas a) Classroom -draw b) Classroom -sleep
Table available in the original PDF paper.
Having the minimum, average and maximum values for both activities performed in the classroom, the area range adopted was the one corresponding to Drawing, as the sleeping values are the same for all conditions, and between the selected ranges the value 2,06 m2 is included.
Considering the two minimum values: 1,73 m2 for Drawing and 2,06 m2 for sleeping, one single value has been adopted. The selection of such value has been based on the most challenging condition: Drawing. Therefore 1,73 m 2 has been selected as a minimum, independently of it applied pedagogy.
It is important to clarify that for the evaluation of the canteen, the exercise was conducted with only a third of the total number of children attending the kindergarten. Three different sizes of kindergartens were considered. A kindergarten dedicated to the care of a small number of children (100 children), one dedicated to the care of 150 children, an average number of infants for the context of the city of Medellin and one dedicated to the care of a larger sum of infants (250 children). In this way, it was calculated a minimum area of 1,15 m2, and average of 1,38 m2 and a maximum area of 1,62m2, for the activity of Eating.
Table 2. Calculation of the range of areas. a) Canteen -eat b) restroom –clean up
Table available in the original PDF paper.
The chosen parameters for evaluating the use of the restrooms correspond to the usage of a sanitary unit (toilet and sink) in an estimated time of one (1) minute. This time has been determined based on the observation made by the research team. Likewise, it was determined that four sanitary units were the ideal quantity for a bathroom used by a group of 25 children, three of them for attending the everyday use, and another unit to attend a health emergency.
Accordingly with the parameters mentioned above, a minimum area of 1,71 m2, an average of 1,73 m2 and a maximum area of 1,75 m2, were calculated for the activities of using the restroom and hand washing.
In average, the classroom presents the highest occupation values. This is a consequence of the child's relationship with the mat and the table, because these elements occupy a large area and corridor. This explains the average results obtained for corridor area in both activities.
The canteen on the other hand, has the most demanding conditions of use, since it must serve a significant number of children in shifts and involves serving food continuously. The area of occupancy of a child is related to the efficiency in which the process is executed and involves the number of tables, the size of those tables, the number of people looking after the children, the corridor areas and the space relation with the kitchen and the dishwashing area. This is reflected in the percentage of Available Area Average (53%), which of the evaluated activities is the greatest.
Finally, the restrooms present a similar value for the minimum, average and maximum occupancy area. Both, the mandatory active area and the percentage of corridor area, showed intermediate values between those of the other two evaluated spaces.
CONCLUSIONS
Defining the occupancy area of a child is a complex exercise. It is influenced by physic-spatial, psychological and educational variables. Therefore, it is essential that in future investigations these variables are included in the determination of the "Minimum Area of Occupation".
It is appropriate to maintain a margin of safety in the areas of occupation, representing the activities in the most demanding conditions of use, in terms of furniture and circulations. This margin will help to ensure that the building is not conditioned only to existing uses and distributions.
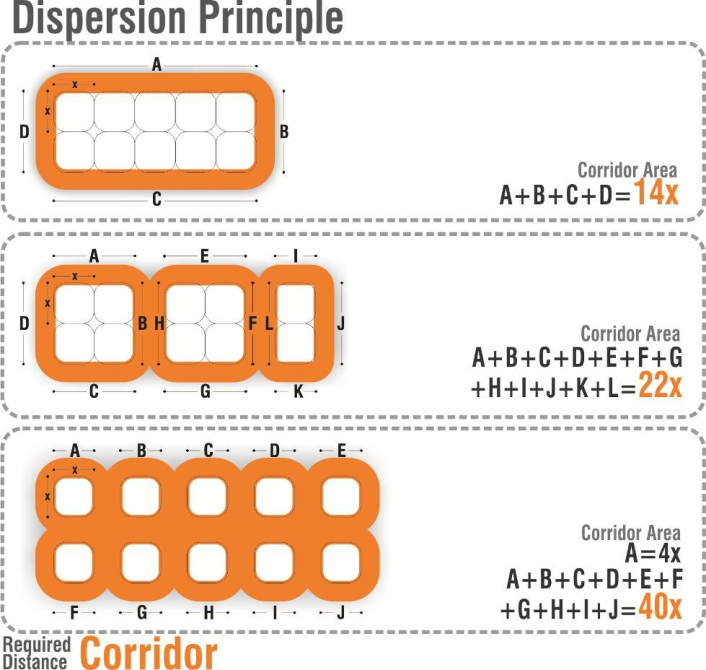
On the other hand, based on the analysis of the obtained data during the simulation, it was observed that as the number of children increases, the average area required decreased in configurations where the children were organized more compactly. This was due to the fact that the increased number of children simultaneously increased the number of inner locations, which required less corridor area than those organized in a more segregated manner. The case is illustrated in Figure 6 and it was called the Dispersion Principle.
Figure 6. Dispersion principle
The progressive increase in the number of children per space reduces the percentage of Available Area required, as the space is occupied in a more compact way, because the number of children increases by group using the same number of corridor areas.
It is important to consider that elements such as the space, architectonical shape and component location, i.e. access, windows, boards, among other elements, can influence the amount of Available Area needed in each space. In the Ergonomics In Design, Usability & Special Populations III same way, in determining the necessary areas for a space, other non-spatial components such as time, should be considered. The time children are in each space is crucial to determine the prevalence of one or some of them over others (if is used for short periods in the school day or even the school year).
ACKNOWLEDGEMENT
The research team would like to thank the active participation of the school board, the Teachers, Parents and Students of the Kindergarten “Aures”, part of the Buen Comienzo Programme.
To the Anthropologist Jesus Antonio Camacho, who performed the anthropometric measurements, and supervised the selection process of models and the data collection.
To PVG Arquitectos SAS who participated in the discussions panels, methodology and data analysis.
To the Architects: Andrés Felipe Sierra and Carlos Andrés Sánchez, for their supervision and guidance during the development of this research.
REFERENCES
Ávila, R. C., Prado, L. R., & González M, E. L. (2001). Medidas antropométricas Preescolar 4 y 5 años. (U. de Guadalajara, Ed.)
Dimensiones antropométricas de la población latinoamericana. Guadalajara: Centro Universitario de Arte, Arquitectura y Diseño, División de Tecnología y Procesos, Departamento de Producción y Desarrollo, Centro de Investigaciones en Ergonomía. City Council - city of Vancouver. (1993). Childcare Design Guidelines- Land use development policies and guidelines.
Vancouver, Canadá. Retrieved from planning@city.vancouver.bc.ca Departamento administrativo de Bienestar Social del Distrito Capital. (2006). Resolución 1001 de 2006. Bogotá, Colombia: Registro Distrital 3628 de octubre 06 de 2006. Departamento Administrativo de Planeación. Alcaldía de Medellín. (2007). Decreto 409 de 2007. Normas específicas para las
actuaciones y procesos de urbanización, parcelación y construcción. Capítulo XXI : Guarderías. Medellín, Colombia: Departamento Administrativo de Planeación. Retrieved from http://www.medellin.gov.co/ Department of Education and Early Childhood Development. (2007). Design guide for Victorian children’s services. Victoria, Australia: Office for Children, Victorian Government Department of Human Services, Melbourne, Victoria, Australia. Retrieved from www.dhs.vic.gov.au/csguidelines GSA, G. S. A. (2003). Child Care Center Design Guide. Public Buildings Service Office of Child Care. New York City, New
York: Office Of Child Care. Retrieved from http://www.gsa.gov Herrera R, M. L. (2012). DOCUMENTO DE TRABAJO INTERNO TEMA: POLÍTICAS Y PROGRAMAS DE ATENCIÓN INTEGRAL A LA PRIMERA INFANCIA – LA EXPERIENCIA DE MEDELLÍN Y EL PROGRAMA BUEN COMIENZO. Medellín, Colombia: Proantioquia. MEN Colombia Norma Técnica Colombiana NTC 4595 Ingeniería Civil y Arquitectura. Planeamiento y Diseño de Instalaciones
y Ambientes Escolares (2006). Retrieved from www.mineducacion.gov.co Ministerio de Educación Nacional Chile. (1988). Decreto de Educación No. 548/1988. Santiago de Chile, Chile. Oficina Internacional de Educación de la UNESCO (OIE). (2006). Argentina: Programas de atención y educación de la primera infancia (AEPI). Ginebra, Suiza. Retrieved from efareport@unesco.org Presidencia de la República, Fundación éxito, & AEIOTú. (2011). Memorias Lanzamiento estrategia Nacional de cero a Siempre.
Atención integral a la primera infancia. Bogotá, Colombia: Presidencia de la República. Retrieved from http://www.deceroasiempre.gov.co/ Programa Buen Comienzo, & SEN. (2012). Resolución No. 501 de 2012. Medellín, Colombia: Secretaria de Educación Nacional, Alcaldia de Medellín. Retrieved from http://www.medellin.gov.co/
LISTED IN THE AHFE DIGITAL BOOKSTORE CATALOGUE
Explore the complete digital volume
Advances in Ergonomics In Design, Usability & Special Populations: Part III
Read this individual research paper free through the original publisher, or explore the full digital proceedings book.
ISBN 978-1-4951-2108-1
Explore this ISBN in the AHFE Bookstore ↗Listed in the July 2026 bookstore catalogue; search by ISBN to confirm current availability · Digital book purchase optional