Meiqi Zhao, fei Song, Zhizhong Li, Xiaolu Dong (2022). Development of a Tool Kit for Integrated System Validation. In: Advances in Ergonomics In Design, Usability & Special Populations: Part III. AHFE Open Access, vol. 20. https://doi.org/10.54941/ahfe1001294
As one of the important elements of Human Factors Engineering (HFE) Program Review Model (PRM) proposed by NRC, integrated system validation (ISV) is an evaluation using performance-based tests to identify human engineering discrepancies (HEDs) and improve the design of systems. However, the descriptions of criteria and methodology in HFE PRM are so general that analysts in Nuclear Power Plant (NPP) industry are often encountered with confusions in real cases (Dong et al., 2013). The process of integrated system validation is so tedious and complicated that lots of manpower and time is involved. In addition, many steps of the process are repetitive and exhaustive which can be better managed by computer programs. In this study, a tool kit of ISV for NPP field is developed to support ISV data collection, data extraction and data processing. An analysis report as the output of the tool kit, would conclude results of ISV and provide reference for identifying HEDs. In this article, logic model and requirement analysis of the tool kit is described and a preliminary prototype is developed.
With the application of computerized technology in the third generation nuclear power plants, human and system performance is significantly improved, but some new safety and usability issues of the integrated interfaces are also introduced. For this reason, a review model with evaluation criteria to develop reliable digitalized systems was developed by U.S. Nuclear Regulatory Commission (i.e. NUREG-0711).Verification and validation (V&V) is acknowledged as one of the most important elements in the HFE review scheme. Integrated system validation is the final step of V&V, which evaluates an integrated system design by performance-based tests to determine whether it satisfactorily supports safe operation of the plant (O’Hara et al., 1997, 2004). At the beginning of ISV evaluation tests, variables should be identified and selected to represent measures of performance. Then experiments under a high fidelity simulation condition are designed and conducted. Raw data are recorded by different techniques, from which interested information is extracted. ISV is an indispensable process in V&V, which intends to evaluate the acceptability of those aspects of the design that cannot be determined through analytical means (O’Hara et al., 2004). It supports to identify human engineering discrepancies and provides suggestions for the improvement of HSI designs of NPPs.
HFE PRM provides essential standards and guidelines for the ISV process. However, the guidelines are so general that analysts in Nuclear Power Plant (NPP) industry are often encountered with lots of confusions in real case, such as how to specify measurements and how to derive useful information from experiment records (Dong et al., 2013). In addition, the process of data collection and processing after experiments is extraordinarily complicated and tedious. Raw data can be recorded by different techniques, such as field video and audio recording, screen recording, behavior recording, operator logging, observer logging, subjective rating, questionnaire survey, etc. The raw data from different sources may not be compatible with each other (Hwang et al., 2009; Yim et al., 2013; Dong et al., 2013). The adoption of eye trackers and EEG (electroencephalographic) in modern tests increases the complexity of data extraction and analysis (Lin et al., 2003; Sterman and Mann, 1995). The whole transformation process from raw data to abstracted information we need for analysis consists of data exporting, data conversion and formatting, data transcription and translation (Dong et al, 2013). Each of these steps is so repetitive and exhaustive that large amount of effort and time will be spent. As computer programs are good at dealing with repetitive and exhausted work, a software tool kit to support ISV process could be a solution to the above problems.
In this study, a tool kit providing accessible instructions for ISV process and supporting data collection and processing is designed and developed to improve the efficiency and reliability of ISV process. In the following part of the article, the logic model is built to define basic logical functions and the process of data flow. Requirement analysis is conducted to detail the model to the component level, that is, what raw data is need and how to achieve each of the functions defined. Then rapid prototypes of main functions are designed and described. Full implementation and evaluation of the tool kit is unfinished yet.
LOGIC MODEL The tool kit is to provide accessible instructions and support data collection and processing for ISV process. With the help of this tool kit, analysts can mostly undertake the part of decision making rather than repetitive work of data extraction and processing, which improve the efficiency and reliability of ISV process.
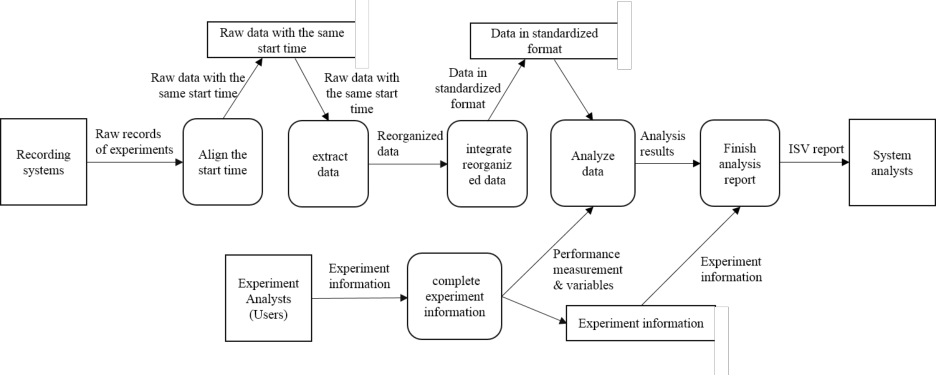
The primary functions of the tool kit are data collection, data extraction and data analysis. Before data import, performance measurement of the test should be selected and then related assessment variables are determined according to the template provided by the tool kit. Assessment variables indicate what information should be imported into the analysis system. When all of the raw data are imported, the tool kit first align the start time of time-related data recorded by different techniques such as videos, audios, system logs etc. so that the records can be compatible in time and the successive analysis is credible (Dong et al., 2013). Then raw data should be transformed to accessible and editable format. As we know, information in video and audio recordings cannot be edited directly, so further data extraction is required for convenient analysis. In a previous real case, the analysts were supposed to re-produce data manually with replays of video and audio files (Dong et al., 2013). The tool kit in this study provides smart markers to extract records. Analysts can add markers to videos or audios to complete the records and then data is saved and organized in standardized format automatically. The data analysis function provides programs of transforming the reorganized experiment records to statistical data of performance measurement variables, and then conclusions towards performance measurements are drawn. The tool kit integrates the functions of data collection, extraction and processing to avoid repetitive data import and export among different software. Finally, an analysis report including analysis and results of ISV is produced by the tool kit. The data flow model in Figure 1 describes the whole logical transformation of data in the tool kit in the functional level visually.
The process of experiment design and implementation is not supported by the tool kit. Some usability testing software provides general data recording functions such as video and audio recording, screen recording and system logs etc., which can be helpful in ISV experiment implementation.
Figure 1. Data flow model of the ISV tool kit
REQUIREMENT ANALAYSIS According to the logic model of the tool kit, the requirements are detailed from the functional level to the component level hierarchically. In this part, the results of requirement analysis is introduced, which instruct the successive physical design of programs and interfaces.
Data requirement analysis Data requirement analysis figures out the complicated data transformation relationship and explains what kind of data should be recorded in the experiment, how to transform raw data to interested information and how to measure a performance by variables.
Raw data Raw data are the original records obtained from various experiment recording systems. The recommended raw data include but are not limited to the below (Dong et al., 2013):
(1) The time of action or event (e.g. the start time of certain personnel task, the time of page transition etc.) (2) Operator’s action (e.g. click on the menu, move the cursor, and press function keys, etc.); (3) The detail of an action (e.g. text on menu, buttons, or labels, and the trace of the mouse movement, etc.); (4) The results of an action (e.g. transit to another page, popup menu or windows, and drawdown select box, etc.); (5) Notes of the observers (e.g. mark the stages of task operations, and give explanation for the operator’s behavior, etc.) (6) Answers of subjective measurement (e.g. score of cognitive workload, judgment of parameters in current
situation etc.)
Performance Measurements Performance measurements provide criteria to determine whether an integrated system design satisfactorily supports safe operation of the plant (O’Hara et al., 2004). Related variables are identified and selected to represent measures of performance. The data of assessment variables can be derived from raw records through calculation and transformation.
(1) Plant performance measurements. This group includes measurements of functions, systems, components, and HSI usability etc. Below are some examples of plant performance measurements and the related assessment variables. System interface structure and navigation design can be measured by the number of page transitions, the number of transient arrivals on a page and number of steps or time taken for reaching a page. An excessive number of page transitions indicate an over deep structure and navigation. If the number of transient arrivals on a page is abnormally large, there should be a straight connection of its antecedent and successive pages. The number of steps or time taken for reaching a page should be consistent with its visit frequency and importance. In terms of the measurement of a page layout design, cursor movement (time and trace) on the page may indicate whether the design matches human metal model. The usability of a soft-controller can be measured by the number of mouse clicks/keystrokes and their effective rates and task completion time.
(2) Personnel task measurements. This group includes measurements of personnel performance such as time or accuracy to complete a task, situation awareness, cognitive workload, etc. The assessment variables of time is generally designed as the duration of stay on pages. Accuracy can be determined by the rate of arrival on the destination page of the task. Situation awareness and cognitive workload can be measured by variables in questionnaire (e.g. score of cognitive difficulty, level of time pressure).
(3) Team communication measurements. In NPP MCR, it is often the case that a task is performed by more than one operator. The support of interface to teamwork performance is a significant measurement. All personnel task measurements can indicate teamwork performance. In addition, some specific variables such as time and frequency of communication between operators can also assess teamwork.
Functional Model The task flow of the three basic functions (i.e. data import, data extraction and data analysis) is designed. An activity diagram (Figure 2-4) is developed to represent the task flow of the function.
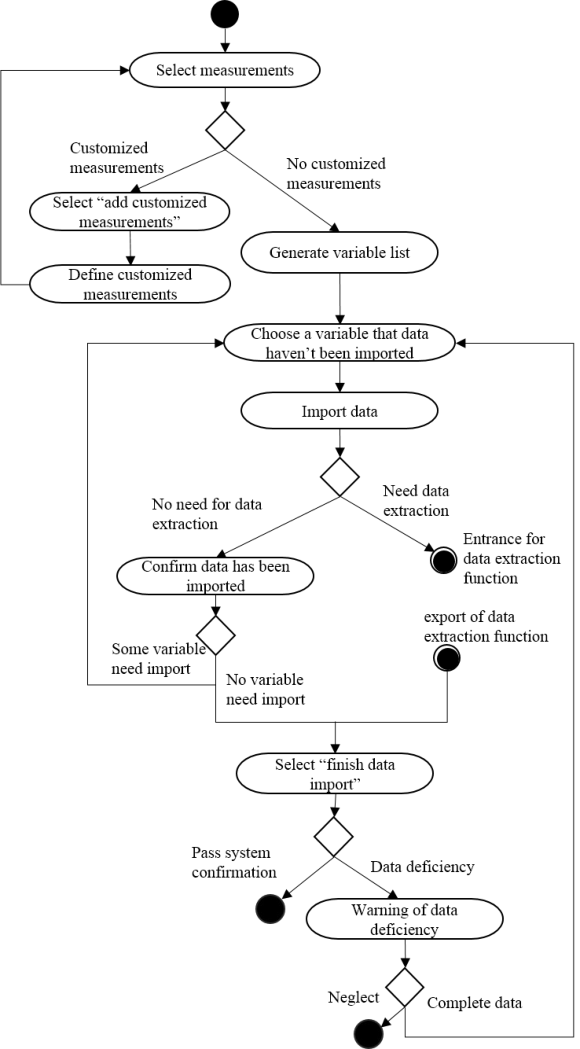
Data import Before data import, performance measurements are supposed to have been selected according to experiment plan. Measurements can be customized by analysts according to the requirements of the current experiment. Then all related variables are included in a list to conduct the successive data import. If the data need further extraction from video or audio files, switch to the data extraction function. The tool kit would confirm that all data needed are imported into the system, otherwise the system will give a warning message of data deficiency. Figure 2 presents the activity diagram of the data import function.
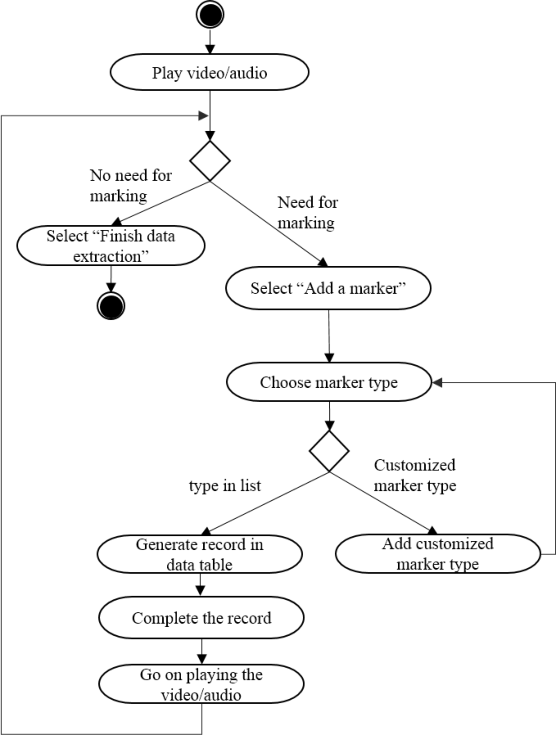
Data extraction When playing a video/audio record, a marker can be labelled at the time that an interested event emerges. The type of markers should be chosen such as Start, Error, Finish, etc. If the marker needed is not in the default list, a customized marker type can be created. Whenever a marker is made, a data record is generated. Some additional attributes of the record is to be completed by analysts. The extraction is repeated until no more information is to be extracted from the current file. The task flow of the data extraction function is described in Figure 3.
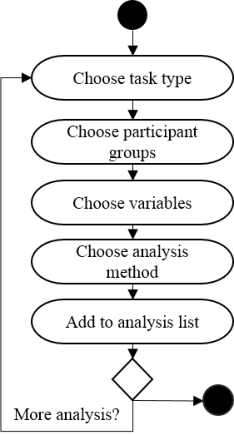
Data analysis An analysis job can be defined by task types, participants, assessment variables and analysis methods (e.g. sum, average, bar chart etc.), for example, calculate the average stay time on pages of selected participants in a selected task. Then a defined analysis job can be added into the analysis job list. Repeat the procedure of analysis job selection until a satisfactory analysis job list is completed. Afterwards, a final analysis report will be generated by the tool kit.
Figure 2. Activity diagram for data import functionFigure 3. Activity diagram for data extraction functionFigure 3. Activity diagram for data analysisfunction
PROTOTYPE DESIGN According to the results of requirement analysis, prototype interfaces are designed. Some considers and descriptions of prototype design are illustrated in the following part. For commercial and confidential reasons, the detailed interface prototypes cannot be presented in this paper visually. However, a demo will be shown in the presentation on the conference.
For all pages, a navigation is designed to indicate the current progress of ISV. The ISV process supported by this tool kit is divided into five steps. First, input experiment information, such as objectives, participants, experiment design, etc. Secondly, performance measurements are selected. Data import follows and then data analysis is conducted. Finally, a report is generated. In the follow text, the prototype designs of data import, data extraction and data analysis functions are described.
Data import pages Whenever a performance measurement is selected, the new data import page popups and the related assessment variables are generated. If data extraction is needed, the active window will be switched to data extraction function. . If the system detects the absence of some data when clicking “next page”, a popup message will instruct the analyst to complete data import or neglect the absent data.
Data extraction pages The data extraction interface consists of a video play window, a screen play window, navigation of markers, manipulating panel of video control and data marking, record table, etc. The matching video recording and screen recording can be played concurrently in two windows for an overall observation of operators’ behavior. The process of adding markers and selecting marker types can be finished at the manipulating panel. When a marker is added, a record is created in the record table.
Data analysis pages In the data analysis interface, a tree structure with branches of measurements and analysis records is designed to draw a whole picture of the analysis content. Check boxs are nested in the records of the variable list for the convenience of selection or deletion of records. Analysis job can be defined on the job select panel and added into the analysis job list.
CONCLUSIONS
In this article, the problems associated with ISV in real cases are discussed. To deal with these problems, a tool kit providing accessible instructions and supporting data collection and processing for ISV process was proposed. The logic, data and functional models of the tool kit are presented. Some preliminary interface prototypes were illustrated. Since the implementation of the tool kit is still in progress, implementation details and usability evaluation are not reported.
REFERENCES
Dong, X.L., Song, F., Li, Z.Z., Zhang, S.H. (2013), “Data Extraction and Analysis for Integrated System Validation of a Nuclear Power Plant”. Nuclear Engineering and Design, 265: 826–832
Hwang, S.-L., Liang, S.-F.M., Liu, T.-Y.Y., Yang, Y.-J., Chen, P.-Y., Chuang, C.-F. (2009), “Evaluation of human factors in interface design in main control rooms”. Nucl. Eng. Des. 239 (12), 3069–3075. Lin, Y., Zhang, W.J., Watson, L.G. (2003), “Using eye movement parameters for evaluating human–machine interface
frameworks under normal control operation and fault detection situations”. Int. J. Hum.–Comput. Stud. 59 (6), pp. 837– 873 O’Hara, J.M., Higgins, J.C., Persensky, J.J., Lewis, P.M., Bongarra, J.P. (2004), “Human Factors Engineering Program Review Model (No. NUREG-0711, Rev. 2)”, U. S. Nuclear Regulatory Commission. O’Hara, J., Stubler, W., Higgins, J., Brown, W. (1997), “Integrated System Validation: Methodology and Review Criteria (No.
NUREG/CR-6393)”, U.S. Nuclear Regulatory Commission, New York. Sterman, M.B., Mann, C.A. (1995). “Concepts and applications of EEG analysis in aviation performance evaluation”. Biol.
Psychol., 40 (1/2), pp. 115–130 Yim H.B., Kim A.R., Seong P.H. (2013), “Development of a quantitative evaluation method for non-technical skills preparedness of operation teams in nuclear power plants to deal with emergency conditions”. Nucl. Eng. Des. 255, pp. 212–225
LISTED IN THE AHFE DIGITAL BOOKSTORE CATALOGUE
Explore the complete digital volume
Advances in Ergonomics In Design, Usability & Special Populations: Part III
Read this individual research paper free through the original publisher, or explore the full digital proceedings book.
ISBN 978-1-4951-2108-1
Explore this ISBN in the AHFE Bookstore ↗Listed in the July 2026 bookstore catalogue; search by ISBN to confirm current availability · Digital book purchase optional