Ryota Horie, Kenta Kaneko (2021). Imitated Mind Uploading by Using Electroencephalography. In: Advances in Affective and Pleasurable Design. AHFE Open Access, vol. 14. https://doi.org/10.54941/ahfe100546
In recent years, technology of brain-computer interface has been developed, and the technology has potential extensibility in combination with ubiquitous environments. In science fiction, an idea that personality is copied to a computational device by scanning brain activity, called mind uploading, ghost dubbing, and so on, has been frequently represented. If the idea becomes realized in a future ubiquitous world, design of highly human-friendly interfaces is expected. In this study, as a step towards realizing the idea, we proposed a method to imitate the mind uploading by using electroencephalography (EEG). We proposed a novel method to extract and digitize an essential feature of the EEG signals by using Hilbert-Huang transform (HHT) and symbolic dynamics analysis. A sequence of symbols was obtained from each of the EEG measurement. Then, we constructed 2nd-order Markov sources from the symbol sequences. Both of the cluster analysis and identification tests by human subjects revealed that the Markov source successfully represented both personal invariants and inter individual differences in EEG signals. In sum, we concluded that the imitated mind uploading can be realized by using EEG signals.
In recent years, technology of brain-computer interface (BCI) has been developed, and the technology has potential extensibility in combination with ubiquitous environments (Saeki, Komaki, and Horie, 2013). In science fiction, an idea that personality is copied to a computational device by scanning brain activity, called mind uploading, ghost dubbing, and so on, has been frequently represented. If the idea becomes realized in a future ubiquitous world, design of highly human-friendly interfaces is expected. In this study, as a step towards realizing the idea, we proposed a method to imitate the mind uploading by using electroencephalography (EEG).
We recognize that the mind uploading can’t be realized as the science fiction by the BCI technology at present, especially by using the noninvasive technology. The present technology to measure brain activity and to decode the brain activity gave us insufficient information to copy personality. On the other hand, as known as the Eliza effect, it has been well known that human has tendency to assume that computer behaviors are analogous to human behaviors. We hypothesize that human can assume that a computer behavior are analogous to behavior of a particular person when brain activity of the parson is somehow embedded in the computer behavior. In this sense, we consider that the mind uploading can be realized by the BCI technology at present. We call this imitated mind uploading.
In this study, we propose a simple example of imitated mind uploading. We use EEG as the simplest technology to measure brain activity. We measured EEG signals twice from three subjects. We proposed a novel method to extract and digitize an essential feature of the EEG signals by using Hilbert-Huang transform (HHT) and symbolic dynamics analysis. A sequence of symbols was obtained from each of the EEG measurement. Then, we constructed 2nd-order Markov sources from the symbol sequences. Finally, we evaluated whether the Markov source represents both personal invariants (within the two measurements in each subject) and inter individual differences (among the three subjects) in EEG signals by calculating distances among the Markov source. We also conducted identification tests to examine whether human can recognize personal invariants and inter individual differences from motion of an object which was generated by the Markov sources.
DIGITAL MODELING OF EEG SIGNALS Measuring EEG Signals
Three volunteers of twenties, subject A, subject B, and subject C, participated in experiments. We measured EEG two times, run 1 and run 2, for each subject. Thus, six data sets were collected. While the participant was seated on a comfortable chair and was in eye-opened and relaxed condition, EEGs signals were measured during 150 s, and the middle 128 s was used for analysis. By using a compact EEG headset (Emotiv, EPOC), the EEG was amplified with a 0.2-45Hz band pass filter and a 50Hz notch filter, and sampled continuously at 128Hz in 16 bits. We used electrodes attached on the participants’ scalps at the sites of T7, T8, P7, and P8 of the international 10-20 system. The four sites were selected from 14 electrode sites of the compact EEG headset, because the four sites had little artifacts.
Extracting and Digitizing an Essential Feature of the EEG Signals We proposed a novel method to extract and digitize an essential feature of the EEG signals by using HHT and symbolic dynamics analysis. On a physiological mechanism of EEG generation, it is known that a local group of pyramidal neurons which receive post-synaptic potentials from other part of the brain becomes a source of EEG, and which part of axons (surface or depth) receives the post-synaptic potentials decides polarity (positive or negative) of EEG signals. Thus, we assumed the most essential feature of the EEG signals might be their polarity. Because the polarity can be digitized as one bit, we can extract a sequence of the two symbols, ‘0’ as negative and ‘1’ as positive, from the polarity of EEG signals.
Hilbert-Huang Transform EEG signals fluctuate and are composed of multiple rhythms each of which has a narrow frequency band, that is, theta wave, alpha wave, beta wave, gamma wave, and so on. It is known that different frequency bands reflect different neuronal functions. Thus, we should define the polarity not on EEG signals directly but on the rhythms separately. In this study, we treated the alpha band, 8 to 12 Hz, which increases in the relaxed condition.
The HHT has recently been developed for analyses of nonstationary signals (Huang et al. 1998). In the HHT, a nonstationary signal is first decomposed into a set of analytical signals called the intrinsic mode functions (IMFs), each of which has a narrow frequency band, by the Empirical Mode Decomposition (EMD), and then the IMFs are transformed to analytical signals, which take complex number, by the Hilbert Transform (HT), and instantaneous amplitude, instantaneous phase and instantaneous frequency of each analytical signals are obtained. It has been studied that EEG signals can be decomposed into the multiple rhythms, and the alpha band can be extracted as one of IMFs (Takizawa and Horie, 2012).
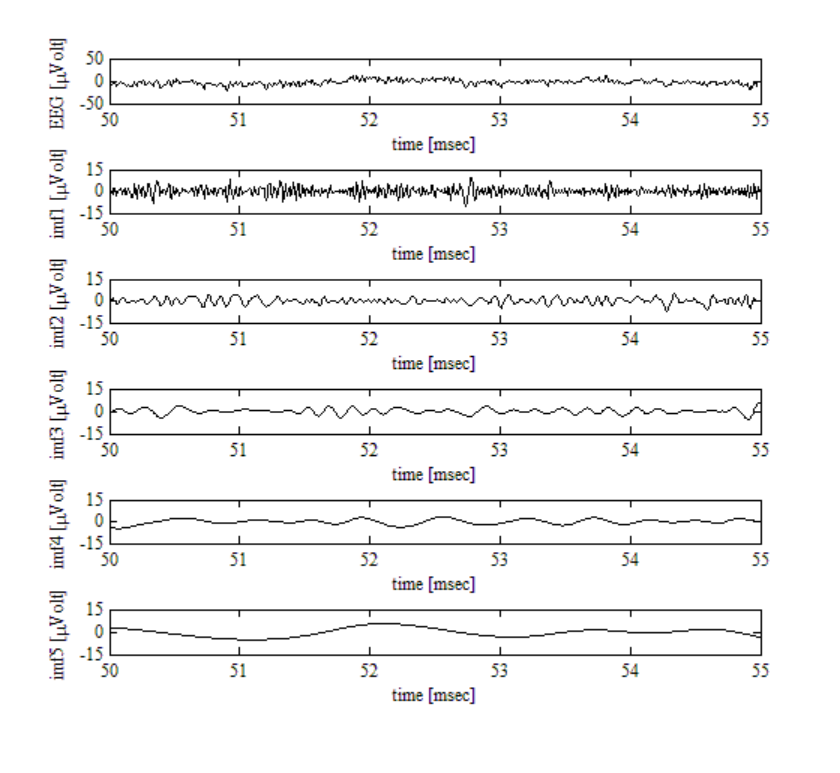
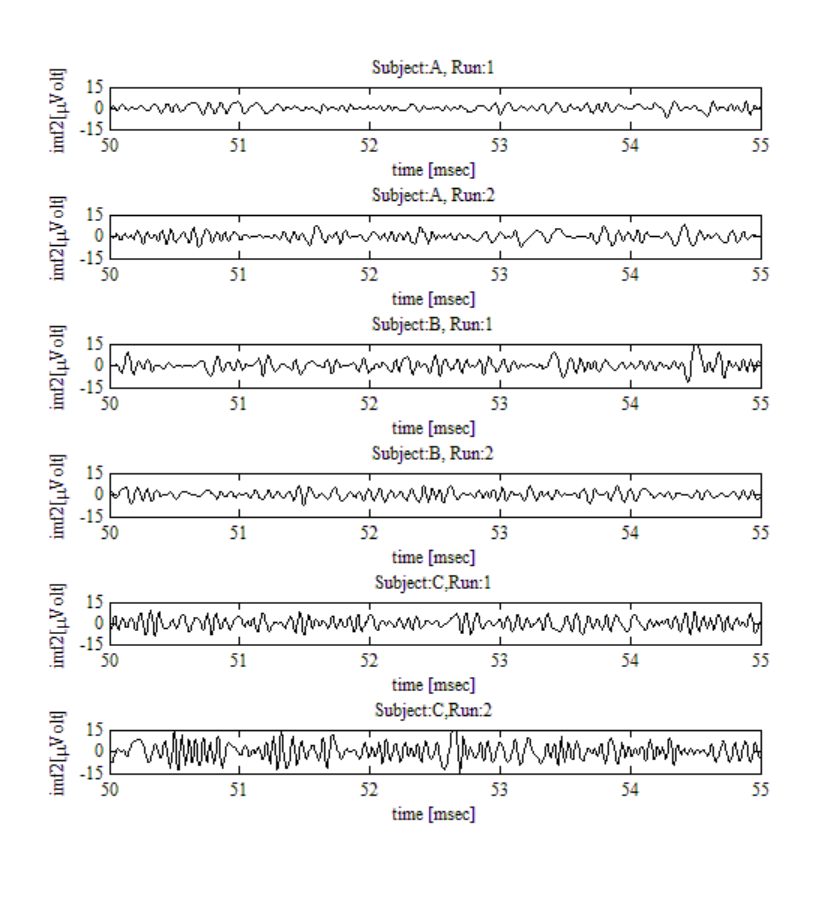
Thus, we decompose the measured EEG signals into IMFs by the HHT, and extracted the alpha band from the IMFs. Figure 1 shows an example of EEG signal and its decomposition into IMFs by the EMD. A period of 5 s in the EEG signal at T7 site in the run 1 of the subject A was illustrated. The horizontal axes indicate time [msec] and the vertical axes indicate voltage [[Equation or mathematical symbol available in the original paper PDF]Volt]. The EEG signal was decomposed into nine IMFs and a residue. The top column shows an EEG signal, and the second to the last columns show the first to the fifth IMFs respectively. The sixth to ninth IMFs and the residue were not shown in the Figure 1. The second IMF (imf2) had the alpha band. It was common across all EEG signals in the six data sets that the second IMFs had the alpha band. Thus, we selected the second IMF for further analyses. Figure 2 shows examples of the second IMFs of the six data sets at the T7 site. The horizontal axes are time [msec] and the vertical axes are voltage [[Equation or mathematical symbol available in the original paper PDF]Volt]. The alpha rhythms were observed in the IMFs.
Symbolic Dynamics Analysis The second IMFs were transformed to analytical signals by the HT. For each analytical signal, instantaneous phase
Figure 1. An example of EEG signal and its decomposition into intrinsic mode functions by the empirical mode decomposition.
and instantaneous frequency were calculated. We can define polarity of the analytical signals as the polarity of its real part. When the second IMF is positive (negative), its analytical signal is on the right (left) half-plane. We can encode the polarity into two symbols, ‘0’ as negative and ‘1’ as positive. The definition of the polarity is same as the binary phase encoding. We call this digitization phase encoding. The proposed method is a kind of symbol dynamics analysis, in which a continuous signal is transferred to a series of symbols. The symbol dynamics analysis has been studied for analyses of physiological signals.
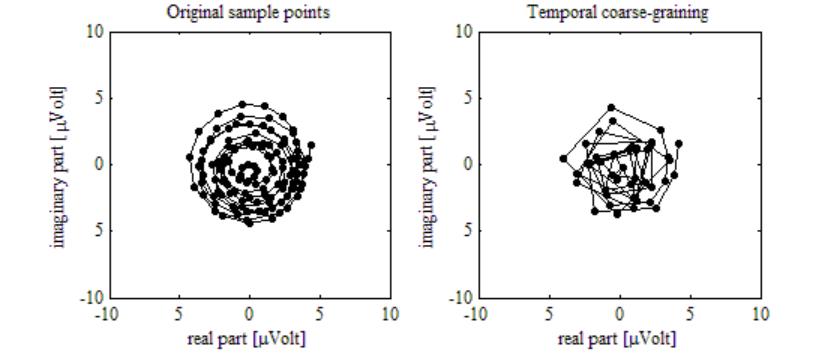
Before the encoding, temporal coarse-graining of the analytical signals is required. In the alpha band, the polarity changes every 50ms in average. Then, with the sampling rate of 128Hz, the same polarity continues 6.4 times in average. This is over sampling. Thus, we conducted temporal coarse-graining of the analytical signals. For each second IMF, a characteristic time scale was defined as a median of its instantaneous frequencies. Then complex vectors of the analytical signal were averaged in every one fourths of the characteristic time scale. Figure 3 shows an example of analytical signal transformed from the second IMF (left side) and its temporal coarse-graining (right side). The second IMF was extracted from the EEG signal at T7 site in the run 1 of the subject A. The temporal coarse- graining shows moderate sampling. The illustrations of temporal coarse-graining were similar across all EEG signals in the six data sets.
After the temporal coarse-graining, we encoded the polarity into the two symbols. Figure 4 shows an example of a sequence of symbols obtained by the phase encoding. The sequence of symbols was obtained from the EEG signal at T7 site in the run 1 of the subject A. The illustrations of a sequence of symbols were similar across all EEG signals in the six data sets.
Figure 2. Examples of the second intrinsic mode functions which have the alpha bands.
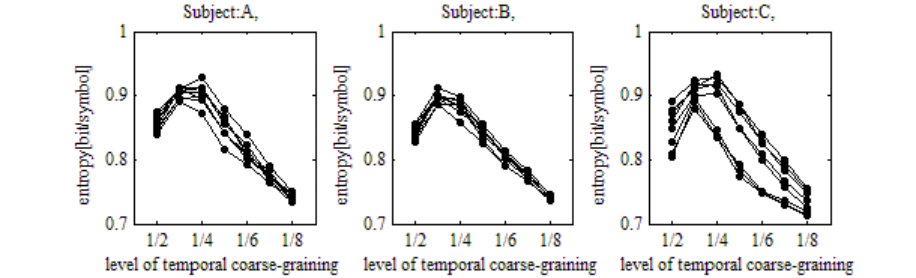
Note that the one fourths of the characteristic time scale was optimal. We calculated entropy of the 2nd-order Markov sources, which were modeled from sequences of symbols as mentioned below, with each levels of temporal coarse-graining, which were defined as one half to one eighths of the characteristic time scale. Entropy decreases when the temporal coarse-graining results to under or over sampling. Figure 5 shows changes of entropy depending on the levels of temporal coarse-graining for every subject. The horizontal axes are the levels of temporal coarse-graining. The vertical axes are entropy [bit/symbol]. Each line with dots represents entropy obtained from each run of each subject. Entropy became maximal at the one fourths of the characteristic time scale.
In this study, the EEG signals were measured when the subjects were in relaxed condition. Thus, the EEG signal can be regarded as a stationary process. The stationary process can be modeled as a Markov source. Thus, we constructed 2nd-order Markov sources from the symbol sequences. We used the 2nd-order Markov source as a simple model, though higher order Markov sources may be more suitable for modeling the symbol sequences. Figure 6 shows state transition matrices of the 2nd-order Markov sources which modeled symbol sequences obtained from EEG signals at the T7 site for each run of each subject. State transition probability of the Markov sources was represented in the gray scale, white as 0 and black as 1. The illustrations of state transition matrices were similar across all electrode sites.
Figure 3. An example of analytical signal transformed from the second intrinsic mode function and its temporal coarse-graining.
Figure 4. An example of a sequence of symbols obtained by the phase encoding.
Figure available in the original PDF paper.
Figure 5. Optimal time scale in the temporal coarse-graining.
Fig. 6 State transition matrices of modeling EEG signals at T7 for each subjects and each runs.
EVALUATION OF INDIVIDUALITY IN THE MODEL Quantitative Evaluation
EEG signal characteristics are changed according to individual differences. If the EEG signal characteristics can be sufficiently modeled by the Markov source, we might discriminate the individuals from the Markov source quantitatively. We evaluated whether differences among the Markov sources represent both personal invariants and inter individual differences. We calculated Kullback–Leibler divergence among the Markov sources as a naturally defined distance. Then, we conducted cluster analysis among the Markov sources based on the Kullback–Leibler divergence. Figure 7 shows a dendrogram obtained from the cluster analysis. The result was obtained from EEG signals at the T7 site. The horizontal axis represents the Kullback–Leibler divergence. In the dendrogram, branches are grouped according to the three subjects. The result shows that the Markov sources successfully represent both personal invariants and inter individual differences. However, the clustering analyses were failed with electrode sites of T8, P7 and P8. For example, Figure 8 shows a result from EEG signals at the T8.
Identification Tests We also conducted identification tests to examine whether human can recognize personal invariants and inter individual differences from motion of an object which was generated by the Markov sources. Three volunteers participated in the tests. Figure 9 shows an example of the identification task. The subjects were shown motion and its trajectories of seven objects. Each Markov source generated 500 symbols. Each objects moved according to the sequence of symbols. The object moved forward left (right) when the symbol was 0 (1). The participants were forced to choice one object from the six objects (in the second and the third column) as an object which was most similar to the target (the top column) in their behaviors. The participants performed 10 trials. For all trials, the motion of target was generated by the Markov source which modeled the EEG signal at the T7 site in the run 1 of
Fig. 7 Cluster analysis for the Markov sources which modeled EEG signals at T7.
Fig.8 Cluster analysis for the Markov sources which modeled EEG signals at T8.
the subject A. The motions of the six objects were generated from the EEG signals at the T7 sites in the six data sets. Figure 10 shows performances of the three subjects. Black, gray and white squares represent frequencies of choices of the three subjects respectively. Choice of the run 1 of the subject A was the successful identification in the identification of measurement (left side). Choice of run1 or run2 of the subject A was the successful identification in the identification of subject (right side). In all subjects, for the both identification, frequency of correct choice was over chance level. The result shows the subject could recognize personal invariants and inter individual differences from motion of the object which was generated by the Markov sources.
Figure.9 An example of the identification test.
Figure.10 Performance of the identification test.
CONCLUSIONS
In this study, we propose a simple example of imitated mind uploading. We proposed a novel method to extract and digitize polarity of the EEG signals by using Hilbert-Huang transform (HHT) and symbolic dynamics analysis. Then, we constructed 2nd-order Markov sources from the symbol sequences obtained from the EEG signals. Both of the cluster analysis and identification tests by human subjects revealed that the Markov source successfully represented both personal invariants and inter individual differences in EEG signals. In sum, we concluded that the imitated mind uploading can be realized by using EEG signals.
One of the conceivable applications with use of the imitated mind uploading is to make motion of a toy robot from a family living apart or from a star. If we can assume that behavior of the robot is analogous to behavior of the family or the star, we can live with who we want to be together ubiquitously.
In future work, evaluation with many electrodes, many subjects, other mental tasks, and modeling by higher order Markov sources are required.
REFERENCES
Huang, N.E., Shen, Z., Long, S. R., Wu, M. C., Shih, H. H., Zheng, Q., Yen, N.C., Tung, C. C., Liu, H. H. (1998), “The empirical mode decomposition and the hilbert spectrum for nonlinear and non-stationary time series analysis”, Proceedings of the Royal Society of London, A454, pp. 903-995 Saeki,S., Komaki, H., Horie, R. (2013), “Implementation of a Simple Brain-Computer Interface Composed of a Compact EEG
Recording Device, a Smartphone, and Microcomputers with ZigBee Modules”, 35h Annual International Conference of the IEEE Engineering in Medicine & Biology Society Conference Abstract Book Takizawa, K., Horie. R. (2012), “Online Detection of Event Related Desynchronization by the Short Time Hilbert-Huang Transformation”, 34th Annual International Conference of the IEEE Engineering in Medicine & Biology Society Conference Abstract Book
LISTED IN THE AHFE DIGITAL BOOKSTORE CATALOGUE
Explore the complete digital volume
Advances in Affective and Pleasurable Design
Read this individual research paper free through the original publisher, or explore the full digital proceedings book.
ISBN 978-1-4951-2109-8
Explore this ISBN in the AHFE Bookstore ↗Listed in the July 2026 bookstore catalogue; search by ISBN to confirm current availability · Digital book purchase optional