Gautier Drusch, J.M. Christian Bastien, Stéphane Paris (2020). Analysing Eye-Tracking Data: From Scanpaths and Heatmaps to the Dynamic Visualisation of Areas of Interest. In: Advances in Science, Technology, Higher Education and Society in the Conceptual Age: STHESCA. AHFE Open Access, vol. 10. https://doi.org/10.54941/ahfe100394
To understand the visual behaviors of people searching for information on Web pages, heatmaps and Areas Of Interest (AOI) are generally used. These two techniques bring interesting information on how Web pages are scanned by several users. However, two remarks can be expressed: the first one relates to the fact that heatmaps are usually used to represent fixation areas for a given task after it is completed. Thus, it does not represent fixation areas over time. The second remark relates to the use of AOI, which must be defined by the analyst. We present a method, which address these two points. This bottom-up approach is based on a mean-shift clustering procedure for the identification of areas of interest, which takes into account the temporal aspect. The identification of AOI is thus data driven. This approach allows us to show the evolution of a posteriori AOI both in space and time. The limitations and implications of this new approach are discussed
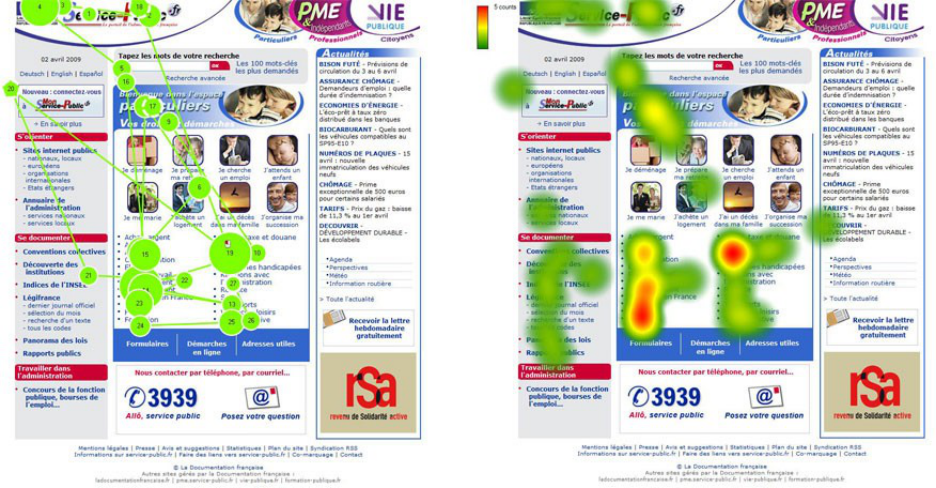
To understand the visual behaviors of an individual, scanpath representations are generally used. A scanpath is an ordered set of fixations points (depicted by circles) connected by saccades (depicted by lines). To represent eye- tracking data from several individuals, heatmaps representations are widely used. Typically, heatmaps aggregate fixations from a set of individuals where colors or opacity vary with the density of the number or duration of fixations (Figure 1).
These two techniques, although interesting, have their own limitations. Scanpath representations, which preserve the order of fixations, cannot be used appropriately to represent several scanpaths. Heatmaps, which generally represent post-task static density of fixations, does not, by definition, represent fixations areas over time.
To preserve the order of fixations, scanpaths of “representative” individuals from groups are sometimes used. In this case, the first step is to compare scanpaths. The comparison of scanpaths is well documented (for example: Privitera and Stark 2000; Jarodzka et al., 2010; Duchowsky et al., 2010; Drusch et al., 2011). Specifically, the probability for two individuals to stare exactly at the same point of a stimulus is very low. So, to overcome this difficulty, researchers usually define Areas Of Interests (AOIs), on the stimulus, so as to group fixations (Figure 2). It is thus possible to compare sequences of AOIs and find the most representative or “prototypical” one (Aula et al., 2005; Hembrooke et al., 2006; Jarodzka et al., 2010; Mason et al. 2012). With this approach however, important information is lost. Thereby, authors sometimes provide the frequencies of fixations by AOI but it is possible that scanpaths differ on other criteria like the order of fixations.
Figure 1. A gazeplot (left) and a heatmap (right) of one participant.
Some visualization methods have been proposed to improve the level of details of AOIs based data analysis. The parallel scanpath visualization, for example, allows visualizing many individuals on a single screen in a parallel layout (Raschke et al., 2012). Another approach is based on the representation of scanpaths in a (3D) Space Time Cube (Li et al., 2010). However, these interesting methods seem not to be very readable with large number of scanpaths.
Figure 2. An example of AOIs on a webpage (partial view).
Figure available in the original PDF paper.
AOIs are widely used to describe visual stimuli, but there is no method for defining them in terms of size, and granularity (a region of the Web page?, a link?, an image?, etc.). Defining an AOI is a “top-down” approach characterized by making assumptions on areas viewed by users, sometimes based on certain experimental conditions Technology, Higher Education and Society (2020)
(e.g., type of website, type of task). Thus, size and location of the AOIs depend entirely on the researcher. Nothing else can help her/him in deciding the level of the granularity of the AOI.
To overcome AOIs limitations, Santella and DeCarlo (2004) proposed a “bottom-up” (data-driven) approach to automatically set AOIs from eye fixations positions. This approach is based on a mean-shift clustering procedure. However, this approach has only been applied to individual data.
The aim of this paper is to extend their approach to the analysis and representation of eye-tracking data from large sets of individuals, in such a way as to preserve the dynamics of these data.
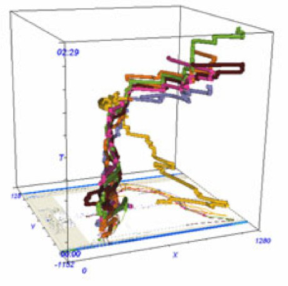
THE SPACE-TIME MEAN-SHIFT APPROACH Every session of eye-tracking recording delivers data consisting of: x and y coordinates, time-stamps and fixation durations. These points can be described in a space-time cube (STC) as illustrated in Figure 1 (Li et al. 2010). In a STC, the fixation durations are transformed into points at the same spatial coordinates but at different times which generate straight lines parallel to the vertical lines in Figure 3. Although the STC is a very effective model to describe eye-tracking data, bringing together all the individual scanpaths produce a quite unreadable representation.
Figure 3. An example of the space-time cube
However, a careful analysis can greatly clarify the observed STC. The scanpaths approximately closed to each other could be grouped into a single path labeled by the session it represents. As every scanpath is described by its fixation points in the STC, the question could be: which fixations points in the STC can be grouped together to form the main scanpaths of the STC?
There are many ways to classify a cloud of points in a multi-dimensional space. Two approaches are possible. In one hand, there are global techniques such as the k-means or the support-vector-machine (SVM). These techniques group points according to a given criterion. The k-means estimates the center of the cluster such that data points are closed to their respective centers, while maintaining the centers well separated from each other. The SVM identifies the cluster frontiers such that they bring the best separations between points of different clusters. The main drawbacks of these algorithms are that they are time consuming and the number of clusters must be defined a priori. On the other hand, local techniques estimate both the number of clusters and the point assignments. A very attractive one is the mean-shift algorithm (Yizong, 1995). It is based on the density of data points. The mean-shift efficiently identify the local extrema of the data points, i.e., regions where the density is high.
After the eye-tracking data are plotted in the Space-Time Cube, the algorithm finds the local extrema using a polyhedron window. When the window is centered at a given location in the Space-Time Cube, the algorithm estimates the local barycenter of the data inside the window and labels them with this value. When barycenters are closed to each other, the algorithm merges them into a single barycenter. The algorithm iterates until no more data remain unlabeled. This labeling separates data into clusters representing the modes in the Space-Time Cube, which correspond to data-driven AOIs.
The only parameter we need to set is the window size but not the number of modes, i.e., the number of AOIs, which are indeed what we are looking for. In our approach, three dimensions are taken into account: x and y coordinates (space) plus time. The window size parameter was set to 23 for the data analyzed here and its formal definition is given by:
Given this formula, the Space-Time Mean-Shift provides the modes, which are the AOIs, localized in the Space- Time Cube. Moreover, the algorithm is actually effective in time and memory consumption. For all these reasons we chose this algorithm against the classical clustering tools such as the K-means algorithm which necessitates to define a priori the number of clusters. In fact, it is quite obvious that defining the number of AOIs (i.e. the number of modes) should be part of the answer of the algorithm and not one of its parameters. Conversely, the size of the window depends only on the density estimation of the data.
The AOIs extracted from the data represent the nodes in the Space-Time Cube where the scanpaths converge, and from where they go out. A direct and easy extension of this work is the estimation of the Averaged Space-Time Paths (ASTP). In other words, these ASTP would reflect user profiles if any. The importance of a node is given by the number of scanpaths passing through it divided by the total number of scanpaths. Its application to the STC is straightforward. The high-density regions in STC represent locations of the fixations of several users. These locations group together individuals fixations to form the main scanpaths. Every path shows the fixations followed by several individuals.
APPLICATION EXAMPLE
Method
Participants 113 French subjects were recruited for the study. Data from 13 subjects were discarded due to calibration problems. Their average age was 23 years old (σ = 3.72) with an equal proportion of men and women. Most of the subjects (97,7%) have used the Internet for at least 3 years and 88.6% of the participants indicated to be connected on the Web for at least one hour per day.
Apparatus The Tobii T120 eye-tracking system with a resolution of 1280x1024 Pixels was used in this experiment. The Tobii Studio software (v.1.3.14) was used to manage the test and to collect eye-tracking data. A fixation was here defined as a gaze of at least 100ms in a radius of 35 pixels.
Stimuli Two French e-government Websites were selected for this study. Although recordings were performed on all the Web pages participants explored during task completion, only the data recorded on the homepage of the first task are used in this paper.
Procedure Subjects were instructed to perform two tasks on each Website without any temporal restrictions (i.e., “What are the three cases allowing to dissolve a civil pact of solidarity?”). All subjects performed the tasks in the same order. Technology, Higher Education and Society (2020)
First, and between each task, a calibration was performed. All the tasks were presented visually and verbally. Each task started from the homepage of each Website.
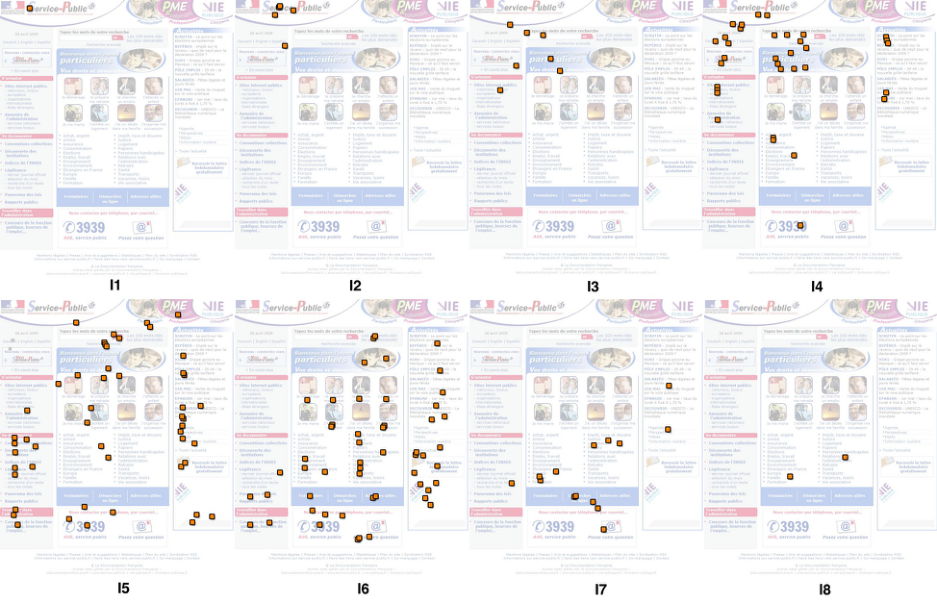
Figure 4. Locations retrieved by the space-time mean-shift during the experiment
RESULTS
Figure 4 shows the web page used for the experiment. Images I1 and I2 show the AOIs identified by the space- time mean-shift at the very first time in the STC model. They are superimposed on the original web page. The AOIs are clusters of data points. Here, only their centers are represented. Few AOIs are extracted meaning that the users start to look at the same element in the web page. Later in the experimental session, many more AOIs are extracted. The users separate into several groups where each group follows a specific scanpath (cf. image I3 in Figure 4). At the end of the experiment, the users stare on few elements of the web page as illustrated by images I7 and I8 in Figure 2.
The analysis based on the locations (and the induced main scanpaths) extracted by the space-time mean-shift shows that the individuals start and end on some few specific elements of the web page. During the session, individuals separate into several groups following their own scanpaths. An obvious extension of this analysis could be to attach profiles to the users (age, sex, etc.) as attributes in the STC to identify which kind of users follows which kind of scanpaths.
DISCUSSION
The aim of this paper was to extend the mean-shift procedure to analyze and visualize the dynamics of eye- tracking data from many individuals. This method allows the analysis of eye-tracking data in a bottom-up way without too much aggregation of the data.
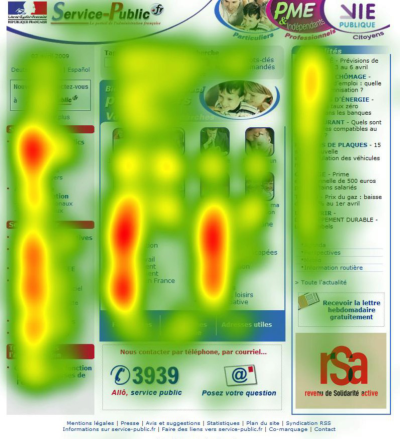
If we compare the results of the heatmap (Figure 5, corresponding to the same eye-tracking data but without the temporal dimension), with the results of the space-time mean-shift analysis, there are some interesting conclusions. Aggregated data could let us think that participants tended to view the webpage in a pattern that does not exist, or at least that do not represent accurately the behaviors of the participants. Another conclusion could be made with the help of the heatmap: the logo seems not to be very important. However, with the space-time mean-shift approach the logo appears clearly to be the starting point of the visual exploration even if participants don’t look at it later.
Figure 5. Heatmap of the eye-tracking data from the experiment.
CONCLUSIONS AND FUTURE WORKS Although the space-time mean-shift appears to be promising in analyzing and representing the dynamics of eye- tracking data from many individuals, several aspects need to be addressed: the adjustment of the kernel, and the classification of individuals within the AOIs.
A difficult part of this analysis is related to the adjustment of the size of the kernel (i.e. the size of the spatio- temporal window). In fact, it is difficult to find a validation mechanism to ensure that this parameter reveals the “good” configuration of clusters (AOIs). We currently consider solving this problem with an automatic estimation of the kernel (Rodriguez et al. 2011): statistics tell us that it is possible to set both the time unit and the window size with a good density estimation of a subsampling of the data.
With the identification of individuals in each cluster, we are thinking about identifying patterns of visual behaviors with the space-time mean-shift procedure.
This research raises an important point in eye-tracking studies, i.e., the analysis and interpretation of eye tracking data and many other questions. What we have presented here to solve the problem of the analysis and visualization of scanpaths from many individuals is only one strategy. Other approaches will have to be tested and, more importantly, compared on the same set of data. The stability of the scanpaths or rather, the stability of the determinants of the scanpath will also have to be addressed. When users find themselves in a group, will they find themselves in the same group if we change tasks or conditions? Are these characteristics stable over time? Given that groups of users can be identified, what are the implications for providing designers with ergonomic guidelines? All these points should remind us that despite their utility, and their ease of use, eye- tracking tools should be used with caution as many questions regarding the analysis of the data are waiting for answers.
REFERENCES
Aula, Anne, Majaranta, Päivi, & Räihä, K-J. (2005). Eye-Tracking Reveals the Personal Styles for Search Result Evaluation.
Human-Computer Interaction-INTERACT 2005, 1058-1061. Drusch, G., Bastien, J.M.C., & Dinet, J. (2011). From gaze plots to eye fixation patterns using a clustering method based on Hausdorff distances. In ACM (Ed.), 23ème Conférence Francophone sur l'Interaction Homme-Machine Nice-Sophia Antipolis, France: ACM. Dorin, C., & Meer, P. (2002). Mean Shift: A Robust Approach Toward Feature Space Analysis. IEEE Transactions on Pattern
Analysis and Machine Intelli-gence (IEEE), 24(5), 603-619. Hembrooke, H., Feusner, M., & Gay, G. (2006). Averaging scan patterns and what they can tell us. Paper presented at the Proceedings of the 2006 symposium on Eye tracking research & applications - ETRA '06, New York, New York, USA. Jarodzka , H., Holmqvist, K., & Nyström, M. (2010). A vector-based, multidimensional scanpath similarity measure Proceedings
of the 2010 Symposium on Eye-Tracking Research & Applications (pp. 211-218). Austin, Texas: ACM. Keinosuke, F., & Hostetler, L.D. . (1975). The Estimation of the Gradient of a Density Function, with Applications in Pattern Recognition. IEEE Transactions on Information Theory (IEEE), 21(1), 32-40. Li, X. , Çöltekin, A., & Kraak, M-J. (2010). Visual Exploration of Eye Movement Data Using the Space-Time-Cube. LNCS,
6292, 295-309. Mason, M., Tornatora, M.C., & Pluchino, P. (2012). Do fourth graders integrate text and picture in processing and learning from an illustrated science text? Evidence from eye-movement patterns. Computers & Education, 60, 95-109. Privitera, C.M., & Stark, L.W. (2000). Algorithms for Defining Visual Regions-of-Interest: Comparison with Eye Fixations.
IEEE Trans. Pattern Anal. Mach. Intell., 22(9), 970-982. doi: 10.1109/34.877520 Raschke, M., Chen, X., & Ertl, T. (2012). Parallel Scan-Path Visualization. In ACM (Ed.), roceedings of the 2012 Symposium on Eye-Tracking Research Applications (ETRA) (pp. 165-168). New York, USA: ACM. Rodriguez, R., Suarez, A.G., & Sossa, J.H. (2011). A Segmentation Algorithm Based on an Iterative Computation of the Mean
Shift Filtering. J Intell Robot Syst, 63, 447-463. Santella, A., & DeCarlo, D. (2004). Robust Clustering of Eye Movement Recordings for Quantification of Visual Interest. Paper presented at the ETRA 2004. Yizong, C. (1995). Mean Shift, Mode Seeking, and Clustering. IEEE Transactions on Pattern Analysis and Machine Intel-ligence
(IEEE), 17(8), 790-799.
LISTED IN THE AHFE DIGITAL BOOKSTORE CATALOGUE
Explore the complete digital volume
Advances in Science, Technology, Higher Education and Society in the Conceptual Age: STHESCA
Read this individual research paper free through the original publisher, or explore the full digital proceedings book.
ISBN 978-1-4951-2110-4
Explore this ISBN in the AHFE Bookstore ↗Listed in the July 2026 bookstore catalogue; search by ISBN to confirm current availability · Digital book purchase optional